

 PDF
PDF Citation
 Print
Print


INTRODUCTION
Recent studies have revealed osteoporosis is closely related to chronic diseases such as diabetes, chronic kidney disease (CKD), and chronic obstructive pulmonary disease (COPD).1 In COPD patients, it has been established that bone mineral density (BMD), and bone quality and strength are reduced, and the prevalence of vertebral fracture ranges from 24 to 79%.1234 A low forced expiratory volume in one second (FEV1), which is used to define the severity of COPD, is also associated with a low BMD in these patients.5 Moreover, previous studies have reported a significant positive association exists between pulmonary function and BMD in general populations.67 However, few studies have investigated associations between pulmonary function and bone quality parameters, although bone quality deterioration is a more important aspect of the pathogenesis of secondary osteoporosis than BMD loss.89
Although the prevalence of osteoporosis is higher in women than in men, male osteoporosis is increasingly becoming a serious global health problem due to societal aging.101112 Specifically, about 30-40% of all osteoporotic fractures occur in men and the 1-year mortality rate after hip fracture in men is twice that in women.131415 With regard to the etiology of male osteoporosis, it is known that secondary causes such as hypogonadism, alcohol abuse, malabsorption, CKD, or COPD account for about 50% of cases.12 Therefore, it is important to actively evaluate bone health, including bone density and quality in men with risk factors for fracture and to provide them adequate treatment after osteoporosis is diagnosed.
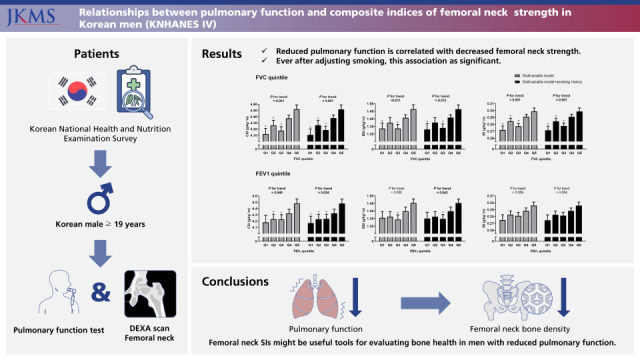
Composite indices of femoral neck strength are tools for measuring bone strength using BMD and hip geometry and represent contributions of bone macroarchitecture to bone strength.16 Given the lack of adequate straightforward methods for measuring bone structural abnormalities, composite indices of femoral neck strength offer a potentially useful means of evaluating fracture risk.17 Therefore, we investigated the relationship between pulmonary function and composite indices of femoral neck strength in men using data from the Korea National Health and Nutrition Examination Survey (KNHANES IV).
Go to : 
METHODS
Study participants
The study cohort was extracted from KNHANES IV (2008) because analysis of hip geometry was only conducted during that year. KNHANES IV was conducted using a cross-sectional nationwide survey and used a stratified, multistage, clustered probability sampling method to select a nationally representative sample of noninstitutionalized, civilian Koreans.18 KNHANES IV data were collected using health interview, health examination, and nutrition survey. Data were collected by conducting household interviews and performing standardized physical examinations at mobile examination centers. All participants provided informed consent. The KNHANES database is available in English at the KNHANES website (http://knhanes.kdca.go.kr/knhanes/eng). Initially, we selected men aged ≥ 19 years with BMD, hip geometry, and pulmonary function test data (n = 1,138). The exclusion criteria applied were prescription of any drug affecting bone metabolism, diagnosis of respiratory disease (e.g., COPD, pulmonary tuberculosis, asthma, or bronchiectasis), or chronic disease affecting bone metabolism (e.g., CKD, chronic liver disease, malignancy, and thyroid dysfunction). Finally, 936 men composed the study cohort.
Lifestyle factors and anthropometric and biochemical measurements
All participants underwent a thorough physical examination. Age, weight, height, smoking history, exercise habits, drinking habits, and calcium and phosphorus intakes were recorded. Weight (kg) and height (cm) were measured while participants were dressed in light clothing without shoes. Body mass indices (kg/m2) were calculated by dividing weight by height.2 Smoking was categorized as never, past, or current. Exercise was defined as ‘moderate intensity’ when a subject exercised regularly (≥ 30 minutes per session at least 3 times per week) and drinking as the consumption of ≥ 3 units of alcohol/day. Dietary intakes of calcium and phosphorus were estimated using the 24-hour dietary recall method. Blood samples were obtained from all participants for biochemical analyses, which included serum 25-hydroxy vitamin D [25(OH)D] analysis, and were immediately refrigerated, transported to the Central Testing Institute in Seoul, and analyzed within 24 hours.
BMD measurements
Areal BMD (g/cm2) was measured by dual-energy X-ray absorptiometry (DXA) using a four-scanner unit (QDR 4500A; Hologic Inc., Waltham, MA, USA) operated by licensed, trained technicians at four mobile examination centers. These DXA instruments were calibrated using a single standard, as previously described, and reference values were obtained.19 DXA calibration was maintained using an internal referencing system and daily measured spine phantoms.20 The DXA quality control program included training, monitoring of technologies, precision assessments, and central reviews of all scans. BMD measurements provided absolute values for each anatomic site, i.e., lumbar spine, femoral neck, and total hip.
Geometric bone structures of femoral necks were analyzed using a hip structure analysis (HSA) program included in Hologic APEX software, as previously described.21 The HSA program automatically sets a region of interest traversing the narrowest width of the femoral neck. The coefficient of variation of HSA indices, which was calculated from the images used for BMD precision assessments, was approximately 2%.
Composite indices of femoral neck strength
To measure the ability of the femoral neck to withstand loading, indices of compression strength (CSI), bending strength (BSI), and impact strength (ISI) at the femoral neck were calculated from mean femoral neck width (FNW), femoral neck axis length (FNAL), height, weight, and femoral neck DXA-BMD, as described previously.16 FNW was defined as thickness at the narrowest portion of the femoral neck along a line perpendicular to the femoral neck axis, and FNAL as the distance along the femoral neck axis from the lateral margin at the base of the greater trochanter to the inner pelvic brim. The equations used were as follows:
CSI reflects the ability of the femoral neck to withstand an axial compressive load, BSI reflects its ability to withstand bending forces, and ISI reflects its ability to absorb the impact of a fall from standing height.
Measurements of pulmonary function
Pulmonary functions were measured using a dry rolling seal spirometer (model 2130; SensorMedics, Yorba Linda, CA, USA) set up as described by the American Thoracic Society/European Respiratory Society.22 Spirometric data by clinical technicians were transferred to an internet review center for processing, where data was carefully examined and compared against criteria metrics for acceptability, reproducibility, and quality control. The principal investigator validated and stored the data in the Korea Centers for Disease Control and Prevention repository management system. Only interpretable data were included in this study. Pulmonary function test indices included were forced vital capacity (FVC), FVC percentage with respect to the expected normal value (FVCp), FEV1, FEV1 percentage with respect to the expected normal value (FEV1p), and FEV1 to FVC ratio (FEV1/FVC).
Statistical analysis
Continuous and categorical variables are expressed as means ± SEs and percentages, respectively, unless otherwise specified. Two adjusted multiple linear regression models were used to determine the independences of associations between pulmonary function (FVC, FVCp, FEV1, and FEV1p) metrics and femoral neck strength (CSI, BSI, and ISI) indices. The multivariate model was adjusted for age, weight, height, 25(OH)D, calcium and phosphorus intakes, physical activity, and drinking. Next, we adjusted for smoking history, in addition to the factors included in the multivariate model, due to its associations with pulmonary function and osteoporosis. Confounders were selected based on clinical applicability and from correlation analyses between pulmonary function or femoral neck strength and various clinical factors (data not shown). A multiple linear regression model was also used to determine the independences of associations between pulmonary function and components of femoral neck strength indices (SIs; femoral neck BMD, FNAL, and FNW). Components of femoral neck SIs and femoral neck SIs were also analyzed according to quintiles of FVC and FEV1 by one-way analysis of variance. To further analyze changes in femoral neck SIs according to FVC and FEV1 quintiles, multivariate-adjusted least-square means with 95% CIs were estimated and compared by analysis of covariance after adopting multivariate models. Trends shown by femoral neck SIs across increasing FVC and FEV1 quintiles were estimated by multiple linear regression analysis. The Complex Samples Plan (CSPLAN), which is available as a complex sample option in later SPSS versions (SPSS Inc., Chicago, IL, USA), was used for all analyses to account for sample weighting. The analysis was performed using SPSS Ver. 18.0, and statistical significance was accepted for P values < 0.05.
Go to :
RESULTS
Baseline characteristics
The characteristics of the study participants are presented in Table 1. Mean age of the 936 men was 42.7 ± 0.9 years and 47.3% were current smokers. Mean values of indices included in the pulmonary function test, i.e., FVC, FVCp, FEV1, FEV1p, and FEV1/FVC were 4.5 ± 0.0 L, 92.9 ± 0.5%, 3.6 ± 0.0 L, 91.8 ± 0.6%, and 0.8 ± 0.0, respectively. Mean BMD values at femoral neck, total hip, and lumbar spine were 0.849 ± 0.008 g/cm2, 0.999 ± 0.006 g/cm2, and 0.991 ± 0.006 g/cm2, respectively. Composite indices of femoral neck strength, that is, CSI, BSI, and ISI, were 4.32 ± 0.04 g/kg·m, 1.39 ± 0.01 g/kg·m, and 0.29 ± 0.00 g/kg·m, respectively.
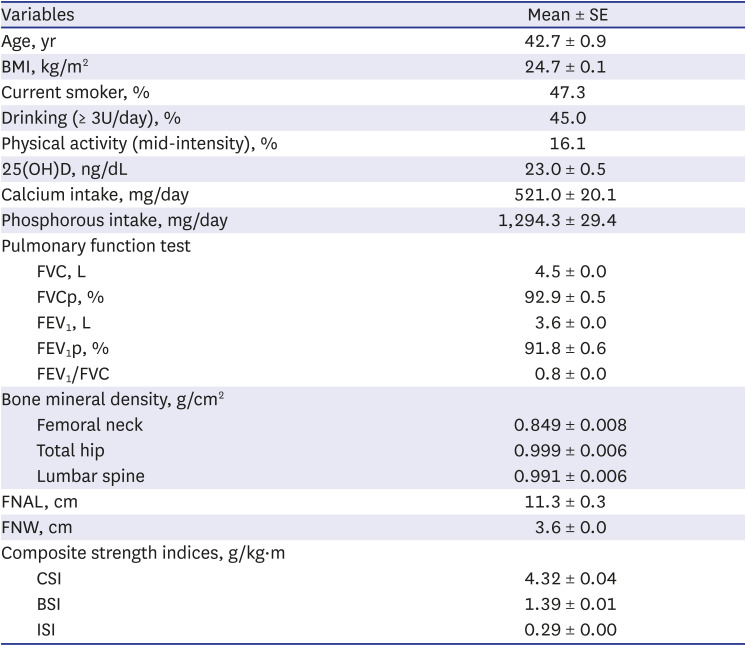
Table 1
Baseline characteristics of the study participants
BMI = body mass index, 25(OH)D = 25-hydroxy vitamin D, FVC = forced vital capacity, FVCp = percent forced vital capacity as compared with the expected normal value, FEV1 = forced expiratory volume in one second, FEV1p = percent forced expiratory volume in one second as compared with the expected normal value, FEV1/FVC = the ratio of forced expiratory volume in one second to forced vital capacity, FNAL = femoral neck axis length, FNW = femoral neck width, CSI = compression strength index, BSI = bending strength index, ISI = impact strength index.
![]()
Associations between pulmonary function and composite indices of femoral neck strength
Simple and multiple linear regression analyses were used to analyze the independences of associations between pulmonary function and femoral neck SIs (Table 2). Before adjusting for confounders, FVCp and FEV1p were positively associated with all femoral neck SIs (P < 0.001 to P = 0.035). Multivariate analysis adjusted for age, weight, height, 25(OH)D, calcium intake, phosphorus intake, physical activity, and drinking showed that FVC, FVCp, FEV1, and FEV1p were positively associated with CSI and BSI (P = 0.003–0.032), and FVC, FEV1, and FEV1p were positively associated with ISI (P = 0.009–0.048). After additional adjustment for smoking history, FVC, FVCp, FEV1, and FEV1p were positively associated with CSI and BSI (P = 0.005–0.036), and FEV1 and FEV1p were positively correlated with ISI (P = 0.010 and 0.025, respectively) (Table 2). These results revealed a positive correlation between pulmonary function and femoral neck strength independent of smoking.
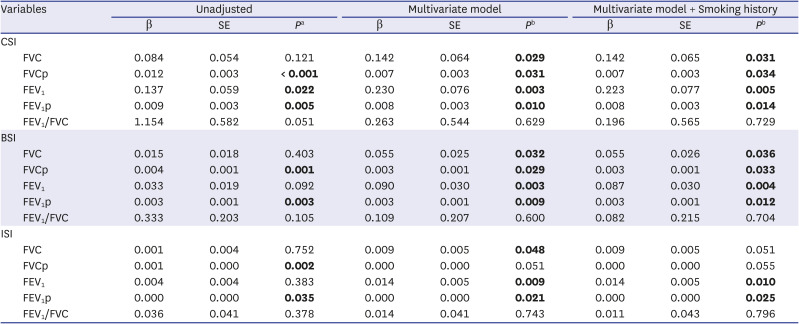
Table 2
Univariate and multivariate analysis results for relations between pulmonary functions and femoral neck strength indices
The multivariate model was adjusted for age, weight, height, 25-hydroxy vitamin D, calcium intake, phosphorus intake, physical activity, and drinking. Bolds indicate statistically significant P values.
β = standardized regression coefficient, CSI = compression strength index, FVC = forced vital capacity, FVCp = percent forced vital capacity as compared with the expected normal value, FEV1 = forced expiratory volume in one second, FEV1p = percent forced expiratory volume in one second as compared with the expected normal value, FEV1/FVC = the ratio of forced expiratory volume in one second to forced vital capacity, BSI = bending strength index, ISI = impact strength index.
a
P values were obtained by simple linear regression analysis; b
P values were obtained by multiple linear regression analysis.
![]()
Associations between pulmonary function and components of femoral neck SIs
We also analyzed relationships between pulmonary function and femoral neck BMD, FNAL, and FNW (Table 3). Results showed that all indices of pulmonary function were positively correlated with BMD at the femoral neck before adjusting for confounders (all P < 0.001). However, after adjusting for confounders, including smoking history (all confounders), these correlations were only significant for FEV1 and FEV1p (P = 0.017 and 0.019, respectively). Before adjusting for confounders, FVC was positively correlated with FNAL and FNW (P < 0.001 and P = 0.020, respectively) and FEV1 was positively correlated with FNAL (P < 0.001). However, after adjusting for all confounders, no pulmonary function test showed a significant correlation with FNAL or FNW (Table 3).
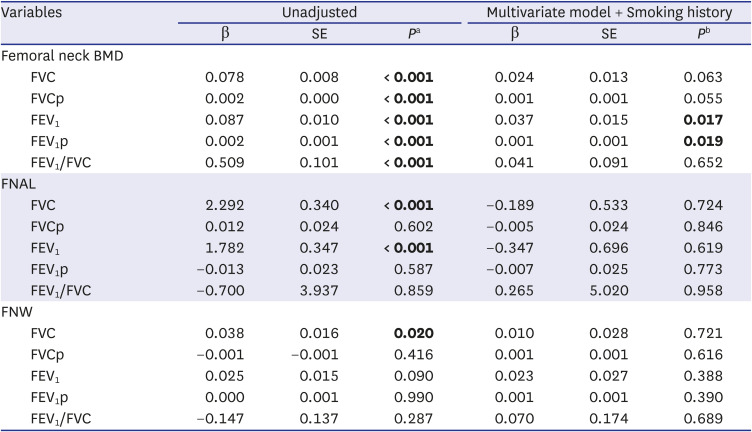
Table 3
Univariate and multivariate analyses of relations between pulmonary functions and components of femoral neck strength indices
The multivariate model was adjusted for age, weight, height, 25-hydroxy vitamin D, calcium intake, phosphorus intake, physical activity, and drinking. Bolds indicate statistically significant P values.
β = standardized regression coefficient, BMD = bone mineral density, FVC = forced vital capacity, FVCp = percent forced vital capacity as compared with the expected normal value, FEV1 = forced expiratory volume in one second, FEV1p = percent forced expiratory volume in one second as compared with the expected normal value, FEV1/FVC = the ratio of forced expiratory volume in one second to forced vital capacity, FNAL = femoral neck axis length, FNW = femoral neck width.
a
P values were obtained by simple linear regression analysis; b
P values were obtained by multiple linear regression analysis.
![]()
Changes in femoral neck SIs according to FVC and FEV1 quintiles
To investigate the natures of associations between pulmonary function and femoral neck composite SIs, we divided participants into FVC or FEV1 quintiles. Before adjusting for confounders, BMDs at all skeletal sites and FNAL showed increasing trends with FVC and FEV1 quintiles (P for trends < 0.001 to 0.018) (Table 4), and among composite indices of femoral neck strength, only CSI tended to increase as FVC or FEV1 quintiles increased (P for trends = 0.007 and 0.014, respectively).
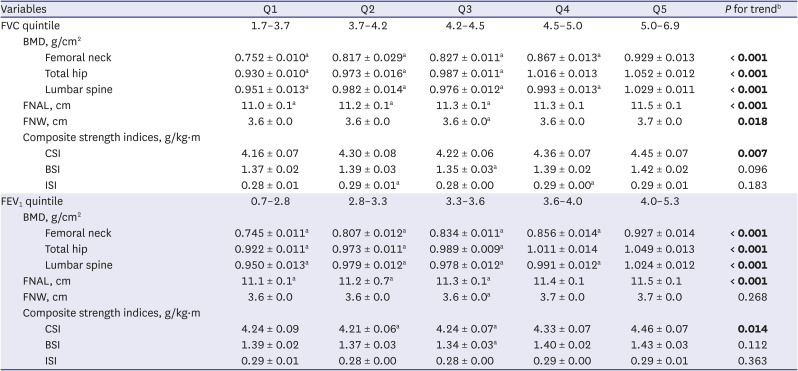
Table 4
Relations between components of femoral neck strength indices and femoral neck strength by FVC and FEV1 quintiles
Values are expressed as means ± SEs unless otherwise specified. Bolds indicate statistically significant P values.
FVC = forced vital capacity, FEV1 = forced expiratory volume in one second, BMD = bone mineral density, FNAL = femoral neck axis length, FNW = femoral neck width, CSI = compression strength index, BSI = bending strength index, ISI = impact strength index.
a
P < 0.05 vs. Q5 by post hoc analysis; b
P values for trends were determined by multiple linear regression analysis.
![]()
However, after adjusting for confounders, including smoking history, all femoral neck SIs increased as FVC quintiles increased (P for trends = 0.001 to 0.012) (Fig. 1A). Similarly, as FEV1 quintiles increased, CSI and BSI increased (P for trends = 0.034 and 0.043, respectively) (Fig. 1B). These results show that relations between pulmonary functions and femoral neck SIs were relatively linear. Post hoc analyses showed femoral neck SIs (CSI, BSI, and ISI) were significantly lower at lower FVC quintiles and CSIs were significantly lower at lower FEV1 quintiles after adjusting for all confounders (Fig. 1).
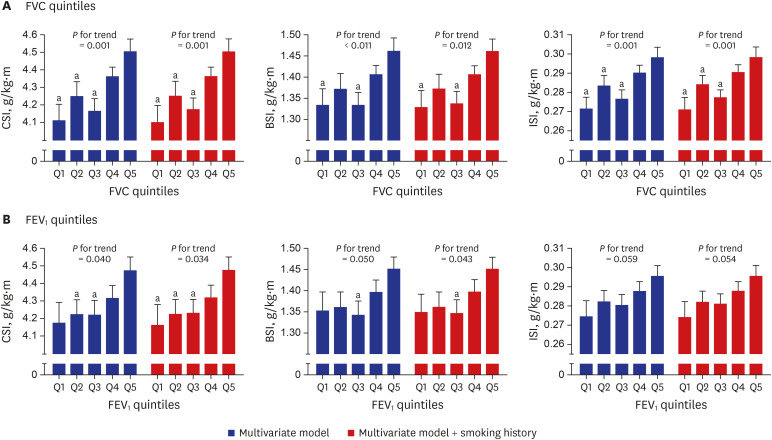 | Fig. 1Femoral neck strengths by (A) FVC and (B) FEV1 quintiles. The multivariate model was adjusted for age, weight, height, 25-hydroxy vitamin D, calcium intake, phosphorus intake, physical activity, and drinking. Values are expressed as least-square means with 95% CI unless otherwise specified. P values for trends were generated by multiple linear regression analysis.FVC = forced vital capacity, FEV1 = forced expiratory volume in one second, CSI = compression strength index, BSI = bending strength index, ISI = impact strength index.
a
P < 0.05 vs. Q5 by post hoc analysis.
|
Go to :
DISCUSSION
This study showed that after adjusting for all potential confounders (including smoking history) pulmonary functions represented by FVC, FVCp, FEV1, and FEVp were positively associated with femoral neck CSI and BSI. In this study, femoral neck SIs gradually increased across quintiles of pulmonary functions. Relationships between pulmonary functions and components of femoral neck SIs (femoral BMD, FNAL, and FNW) were not significant after adjusting for all confounders, with the exception of femoral neck BMD, which was found to be significantly correlated with FEV1 or FEV1p.
This study reports a significant association between pulmonary functions and bone quality in Korean men. Although several studies have reported a positive association between pulmonary functions and bone density, few have investigated relations between pulmonary function parameters and bone quality.35232425 However, studies that investigated the relationship between BMD and the prevalence of vertebral fractures in COPD patients concluded that BMD was not a good predictor of fracture, since there were many more fractures than BMD-defined osteoporosis cases in their cohorts.45 The authors of these studies suggested the involvement of bone density-independent mechanisms of perturbed bone metabolism in COPD patients. In this regard, a large retrospective study of 29,407 women aged ≥ 50 years in Manitoba showed that the presence of COPD was associated with lower trabecular bone scores.26 In another high resolution peripheral quantitative computed tomography based study, it was also reported that postmenopausal women with COPD had lower trabecular bone volumes and cortical widths and higher cortical porosities than normal postmenopausal controls.27
Previous studies that investigated the association between pulmonary function and bone health in general populations have produced inconsistent results. In the Hertfordshire cohort study, healthy subjects over 60 years of age showed no relationship between pulmonary function and BMD,28 whereas, in a Korean study, FVC and FEV1 showed significant positive associations with BMD in healthy non-smoking premenopausal women, but not in postmenopausal women.7 In another Korean study, FEV1 and peak expiratory flow rate were positively correlated with BMDs at the lumbar spine and femoral neck in non-smoking healthy postmenopausal women, but not in premenopausal women.6 Furthermore, in a recent study conducted in the Chinese population aged 40–70 years, BMD reduction was found to be associated with poorer lung function.29 However, evidence regarding the association between pulmonary function and bone quality is scant in general populations.
In this regard, the significant relationships identified in the present study between pulmonary function tests and femoral neck SIs in Korean men provide meaningful information on changes in bone quality according to pulmonary function in a general population. In particular, we found reduced pulmonary function was independently correlated with decreased femoral neck SIs even after adjusting for smoking, a known detrimental factor of pulmonary function and bone health. Femoral neck SIs include the size and areal BMDs of the femoral neck with body size.16 A previous study showed that femoral neck strength can predict fracture risk independently of BMD30 and suggested that combining SIs and BMD is likely to better predict future fractures than BMD alone.17 Moreover, a recent study found that 2D DXA-derived hip geometry and simple SIs were well correlated with quantitative 3D computed tomography findings in postmenopausal women.31 In addition, several epidemiological studies have reported patients with conditions associated with altered bone metabolism, such as inflammation and sarcopenia, also have low femoral neck strengths.3233 These observations suggest that femoral neck SIs calculated from hip DXA scans may provide good indicators of bone health in men with reduced pulmonary function.
Possible mechanisms have been proposed for the association between pulmonary function and bone health.34 In COPD patients, increased inflammatory cytokine levels were found to induce osteoclastic bone resorption by modulating the OPG/RANK/RANKL axis.3536 It has been also demonstrated Wnt/β-catenin signals, which control osteoblastogenesis, were attenuated in the lung tissues of COPD patients.37 In addition, it has been well established that hypoxia strongly stimulates osteoclast-mediated bone resorption.38 Hypoxia also inhibits osteoblast formation by reducing the expression of RUNX2, a key transcription factor required for osteoblast differentiation and stem cell selection toward the osteoblastic lineage.39 Since FEV1 depends on the strength of respiratory musculature, physical inactivity in combination with reduced pulmonary function may contribute to bone deterioration in subjects with reduced pulmonary function. Specifically, physical inactivity decreases BMD by reducing osteoblast recruitment and differentiation, inducing osteoblast apoptosis, and causing osteoprogenitor cell differentiation toward adipocyte lineages.40 However, further studies are needed to investigate the mechanisms that link pulmonary function and bone metabolism since most studies performed to date have focused on patients with chronic pulmonary diseases, and some reported independent effects of pulmonary function on bone metabolism were questionable after adjusting for all confounders such as smoking and physical activity.41
The strength of this study is that we collected data from a nationwide survey and included the data of almost 1,000 Korean men. Furthermore, this is the first study to investigate relationships between pulmonary function tests and composite indices of femoral neck strength in a general population. In addition, it identifies independent correlations between pulmonary function and femoral neck SIs regardless of smoking history.
However, this study also has limitations. First, the cross-sectional nature of the KNHANES IV means that we could not access the nature of causal relationships between reduced pulmonary function and femoral neck indices. Second, bone turnover markers, which are excellent non-invasive tools for predicting changes in bone metabolism, were not measured during KNHANES IV. Third, bone strength calculations based on macroarchitectures and BMDs of hips and body sizes may not reflect actual bone strength.
In conclusion, this study showed that reduced pulmonary function is correlated with decreased femoral neck strength even after adjusting for the effect of smoking history in Korean men. Therefore, we suggest femoral neck strength measurements might provide useful information for evaluating bone health in men with reduced pulmonary function.
Go to :
 XML Download