

 PDF
PDF Citation
 Print
Print


INTRODUCTION
Asthma is defined as chronic airway inflammation and reversible airway limitation.1 The traditional concept of asthma inflammation involves an acute hypersensitivity reaction to specific IgE and a type 2 (TH2) cell response.2 However, with the increasing understanding of the relevant inflammatory mechanisms, there has been recognition that eosinophils, neutrophils, and microgranulocytes are all involved in asthma-mediated airway inflammation and other clinical manifestations. Recently, the terms “T2 high” and “T2 low” have been used to describe asthma inflammation.2 Type 2 inflammatory biomarkers comprise the fraction of exhaled nitric oxide, the serum IgE level, blood and/or sputum eosinophil levels, and serum periostin levels.2 Given the increasing interest in the roles played by these biomarkers, some authors have investigated whether they might predict future asthma exacerbations. Blood eosinophil count is the most widely used indicator for eosinophilic asthmatics to initiate biologics such as IL-5 monoclonal antibody.34 The blood eosinophil count is associated with the extent of asthma control and acute exacerbations (AEs).5678 A high eosinophil count has been associated with a future risk of AEs in patients with both general and severe asthma.67 A 2014 study from the USA reported an association between the baseline blood eosinophil count and asthma exacerbation within the next year, according to findings from the National Health and Nutrition Examination Survey database. The risk of asthma exacerbation increased in adults with eosinophil counts ≥ 300 cells/µL, compared to < 300 cells/µL. A 2016 study from the UK used cohort data to calculate the relative risks of exacerbation in the years before and after blood eosinophil measurements. Patients with blood eosinophil counts ≥ 400 cells/µL experienced more severe exacerbations.7 These studies employed surveys or medical records with diagnostic codes and key signs of AE such as the use of a systemic corticosteroid or antibiotics. Furthermore, systemic steroid exposure was not considered, and atopic and non-atopic statuses (one of the “T2 high” axes) were neither distinguished nor adjusted. Therefore, we examined the association between the clinical burden of asthma and blood eosinophil count in a Korean adult asthma cohort with consideration of the factors mentioned above.
METHODS
Study population
Clinical information was extracted retrospectively from the database of the Cohort for Reality and Evolution of Adult Asthma in Korea (COREA).9 Asthmatics in this cohort were recruited by allergists and pulmonologists beginning in 2005.1011 In 2018, 21 centers were participating in the cohort study.1011 The data extraction period was July 2005 to February 2018. At enrollment in the COREA cohort, laboratory results within 3 months and medication history within 1 month were collected. The inclusion criteria were as follows: 1) blood eosinophil count collected within 1 month and no exposure to systemic corticosteroids within 1 month or blood eosinophil count collected within 3 months and no treatment; 2) age ≥ 18 years; 3) 1 consecutive year of follow-up; 4) positive result in inhalant allergen skin prick test; and 5) ≥ 50% drug compliance. Patients with chronic obstructive lung disease were excluded. We divided all patients into atopic and non-atopic asthmatics, then assessed the impact of the blood eosinophil count on the outcomes of either group.
Data collection
Data were collected using the Clinical Record Form (CRF) completed at enrollment, as well as four consecutive 3-month follow-up CRFs recorded in the COREA cohort database. Asthma was diagnosed if airway reversibility or hypersensitivity was demonstrated in a patient with asthma-related symptoms (cough, dyspnea or wheezing). Airway reversibility was defined as an increase of ≥ 12% and ≥ 200 mL in the forced expiratory volume in 1 second (FEV1) after the inhalation of a bronchodilator or after treatment. Airway hypersensitivity was defined by the bronchoprovocation test using methacholine or mannitol; the diagnostic values were PC20 ≤ 25 mg/mL and PD15 ≤ 635 mg. “PC20” refers to the provocative concentration of methacholine causing a 20% reduction in the FEV1; PD15 refers to the provocative dose of mannitol causing a 15% reduction in the FEV1. Asthma control state, asthma medication, drug compliance, and history of AEs were checked at 3-month intervals. Age, sex, body mass index (BMI), serum total IgE level, sputum eosinophil percentage, presence of rhinosinusitis, smoking status, and the results of the inhalant allergen skin prick test, pulmonary function test, bronchial provocation test and asthma control test (ACT) were reviewed. The baseline blood eosinophil counts were collected from the enrollment data, as were the percentages of eosinophils in the total white blood cell count/µL. Atopy was defined as a positive result for more than one allergen in the inhalant allergen skin prick test.12 A skin prick test result was considered positive if the mean wheal size for any allergen was greater than or equal to the mean wheal size for histamine (allergen/histamine ratio ≥ 1).13 Drug compliance was scored from 0 to 100 points depending on the amount of drug remaining at each visit. Asthma AEs were directly assessed by the cohort researchers: the type of visit (total visits, outpatient department [OPD], emergency department [ED], admission to a ward and admission to the intensive care unit [ICU]), and number of visits were collected.9 An OPD visit because of an asthma AE was defined as a moderate exacerbation; and an ED visit or hospitalization because of an asthma AE was defined as a severe exacerbation.
Definition of the clinical burden
Clinical burden was defined as 1) asthma control status, 2) medication demand and 3) exacerbation events during 1 consecutive year after enrollment. Asthma control status included the control state assigned by the clinician at the end of the year (well vs. partially/uncontrolled); a change in asthma control state (from well-controlled to partially/uncontrolled vs. from partially/uncontrolled to well-controlled); and the mean ACT score during the year (mean value ≥ 20 vs. < 19).14 Medication demand included the Global Initiative for Asthma (GINA) step (2019 GINA report) (steps 1–3 vs. steps 4, 5); a change in GINA medication (from steps 4, 5 to steps 1–3 vs. from steps 1–3 to steps 4, 5) and the inhaled corticosteroid (ICS) dose (low dose vs. medium-to-high dose) at the end of the year.15
Statistical analysis
Statistical analysis was performed using SPSS version 25 (IBM Co., Armonk, NY, USA). Means and percentages were compared by independent samples t-test, Pearson’s χ2 test, or Fisher’s exact test. Binominal logistic regression were conducted to adjust for age, sex, BMI, smoking status, baseline FEV1, baseline GINA medication step, and mean drug compliance when comparing clinical asthma burden. Two-sided P values < 0.05 were considered indicative of statistical significance. Missing data were excluded from the analysis.
RESULTS
Baseline clinical characteristics and clinical burden of asthma
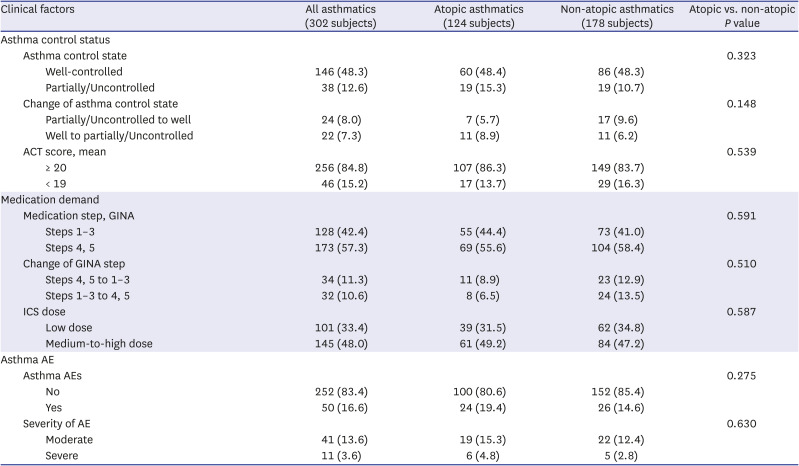
A flow diagram of the eligible patients is shown in Fig. 1. In total, 302 asthmatics were enrolled, including 124 with atopic and 178 with non-atopic asthma. Their clinical characteristics are shown in Table 1. Atopic asthmatics, compared with non-atopic asthmatics, were younger (42.7 ± 13.6 vs. 54.8 ± 13.1 years, P < 0.001), had a greater proportion of men (56.5% vs. 36.5%, P = 0.001), had a higher mean serum total IgE level (555.9 ± 692.3 vs. 272.5 ± 417.8 IU/mL, P < 0.001), and had a greater proportion of current smokers. The mean BMI values, blood eosinophil counts, FEV1 predicted values, asthma control statuses, and GINA medication statuses were similar between atopic and non-atopic asthmatics. Although the data were limited, the mean PC20 and PD15 values were also similar between atopic and non-atopic asthmatics. The mean ACT score was slightly higher in non-atopic asthmatics, but the scores were > 20 in both groups (22.2 ± 3.0 vs. 21.4 ± 3.5, P = 0.046). No asthmatic patients visited the hospital with an asthma AE during the year before enrollment. The clinical burden during the year is shown in Table 2; this burden did not differ between atopic and non-atopic asthmatics.
Fig. 1
A flow diagram of eligible subjects from the COREA database.
COREA = Cohort for Reality and Evolution of Adult Asthma in Korea.
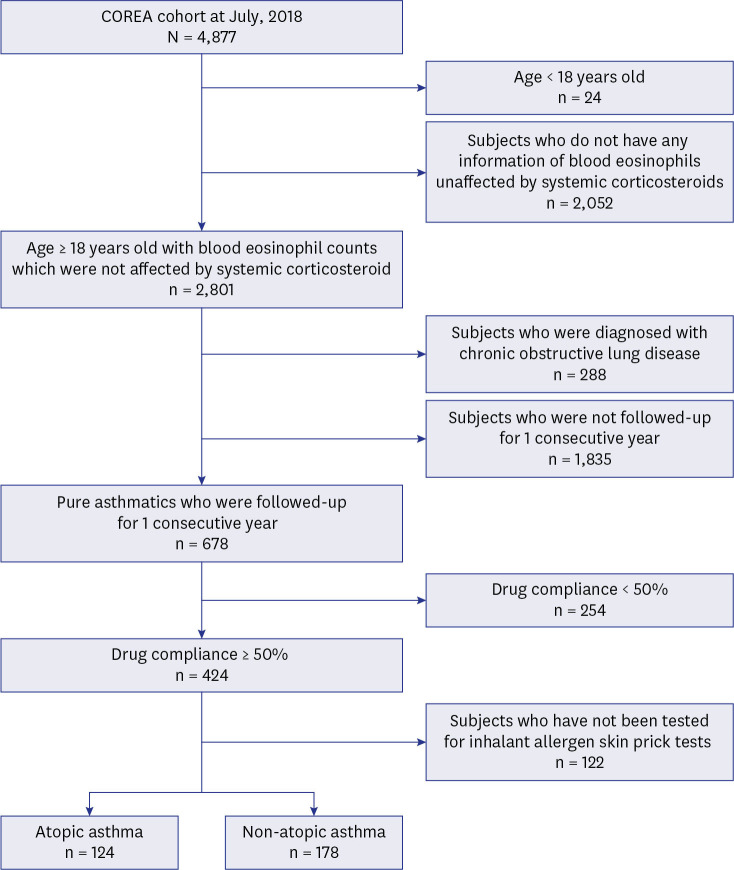
Table 1
Baseline clinical characteristics of study population
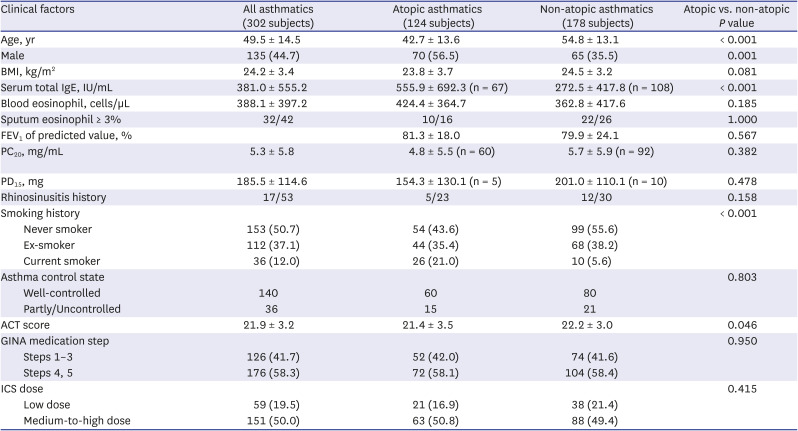
Data are presented as mean ± SD (total number collected), number (%) or number/total number collected. The total number collected is described when the number of collections is insufficient. There were limited data about asthma control status at first regular visit during one consecutive year (49 patients in atopic asthmatics and 71 patients in non-atopic asthmatics were not evaluated).
BMI = body mass index, FEV1 = forced expiratory volume in 1 second, PC20 = provocative concentration causing a 20% fall in forced expiratory volume in 1 second, PD15 = provocative dose causing a 15% fall in forced expiratory volume in 1 second, ACT = asthma control test, GINA = Global Initiative for Asthma, ICS= inhaled corticosteroid.
Table 2
Clinical burden of study population
Clinical burden according to the blood eosinophil count in all asthmatics
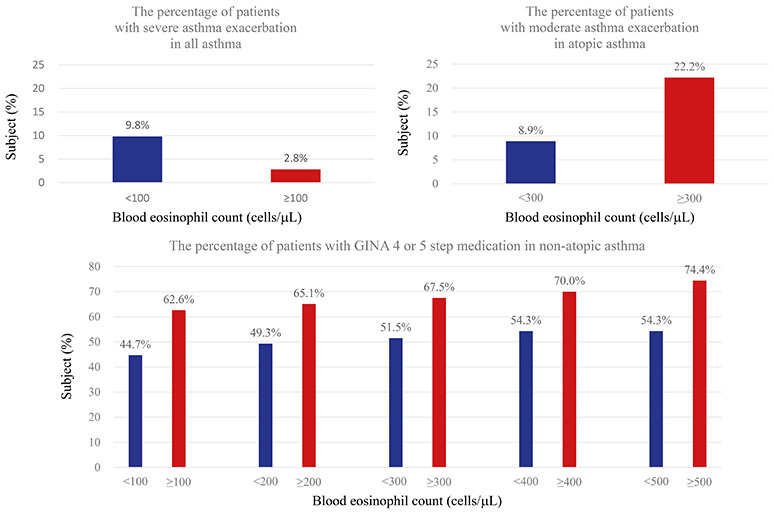
The associations between clinical burden of asthma and blood eosinophil levels in all asthmatics (adjusted for age, sex, BMI, smoking status, the baseline FEV1, the baseline GINA medication step, and mean drug compliance) are shown in Table 3. The asthma control state, any change in that state, and the mean ACT score were similar in the low and high eosinophil groups at all eosinophil cut-off values. Furthermore, asthma medication demand (in terms of the GINA step), any change in the GINA step, and the ICS dose were also similar. Of all patients, 16.6% experienced AEs (OPD visit, 13.6%; ED visit, 2.0%; admission to a ward, 1.7%). No patient was admitted to an ICU. The percentages of patients who experienced AEs were similar between the high and low eosinophil groups at all blood eosinophil cut-off values. The percentage of patients who experienced moderate AEs were also similar. Comparisons of groups divided according to blood eosinophil counts of 100 cells/µL indicated that the percentage of patients who experienced severe asthma AEs was higher in the low eosinophil group (5/51, 9.8%) than in the high eosinophil group (6/212, 2.8%) (odds ratio [OR], 5.406; 95% confidence interval [CI], 1.266–23.078; adjusted P = 0.023).
Table 3
Comparison of clinical burden according to the blood eosinophil count in all asthmatics (n = 302)
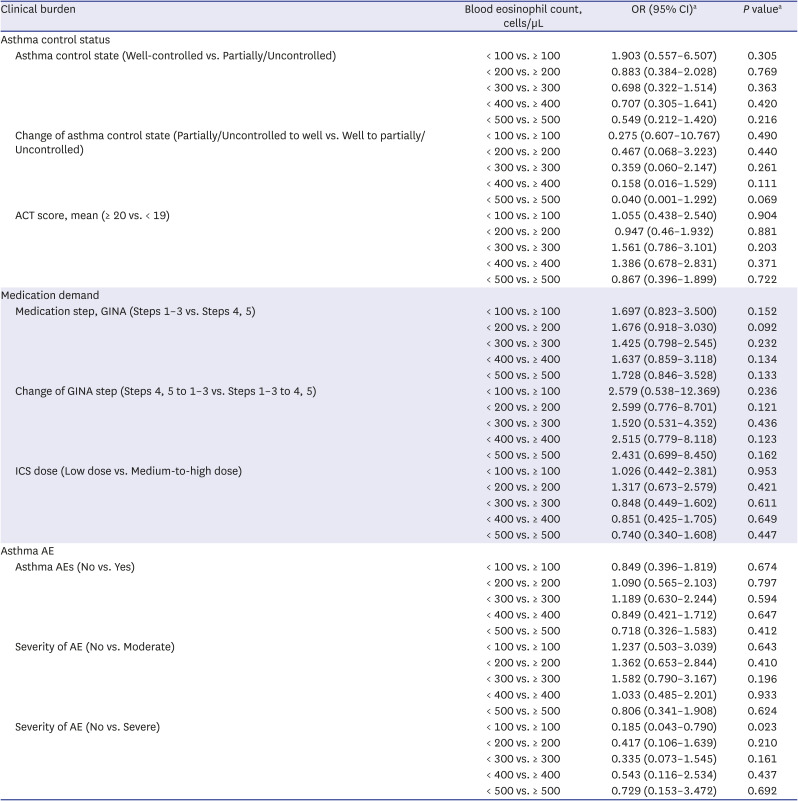
OR = odd ratio, CI = confidential interval, ACT = asthma control test, GINA = Global Initiative for Asthma, ICS = inhaled corticosteroid, AE = acute exacerbation.
aAdjusted factors were age, sex, body mass index, currently smoking, baseline forced expiratory volume in 1 second, baseline GINA medication step and mean drug compliance during 1 year. All patients had no history of acute asthma exacerbation during one year before enrollment. Baseline GINA medication step was excluded in adjusting in analyses of the change of GINA step, because there were not enough subjects to adjust.
Clinical burden according to the blood eosinophil count in atopic asthmatics
Associations between clinical burden of asthma and blood eosinophil levels in all atopic asthmatics (adjusted for age, sex, BMI, smoking status, baseline FEV1, baseline GINA medication step, and mean drug compliance) are shown in Table 4. The risk of partially/uncontrolled asthma was higher in the low eosinophil group than in the high eosinophil group (< 300 vs. ≥ 300, OR, 3.478; 95% CI, 1.009–11.986; adjusted P = 0.048; < 400 vs. ≥ 400, OR, 4.120; 95% CI, 1.077–15.759; adjusted P = 0.039; < 500 vs. ≥ 500, OR, 7.560; 95% CI, 1.398–40.881; adjusted P = 0.019). Changes in asthma control state and the mean ACT score during the year were similar in the low and high eosinophil groups at all blood eosinophil cut-off values. Furthermore, asthma medication demand (in terms of the GINA step), any change in the GINA step, and the ICS dose were also similar. Of all patients, 19.4% experienced AEs (OPD visit, 15.3%; ED visit, 3.2%; and admission to a ward, 1.6%). No patient was admitted to an ICU. The percentages of patients who experienced AEs were similar between the high and low eosinophil groups at all blood eosinophil cut-off values. Comparisons of groups divided according to a blood eosinophil count of 300 cells/µL showed that the percentage of patients who experienced moderate asthmatic AEs was higher in the high eosinophil group (14/63, 22.2%) than in the low eosinophil group (5/56, 8.9%) (OR, 3.558; 95% CI, 1.083–11.686; adjusted P = 0.036). However, no differences were evident at blood eosinophil cutoffs of 100, 200, 400 and 500 cells/µL. The percentages of patients who experienced severe asthmatic AEs were similar in all comparisons of groups divided according to the blood eosinophil counts.
Table 4
Comparison of clinical burden according to the blood eosinophil count in atopic asthmatics (N = 124)
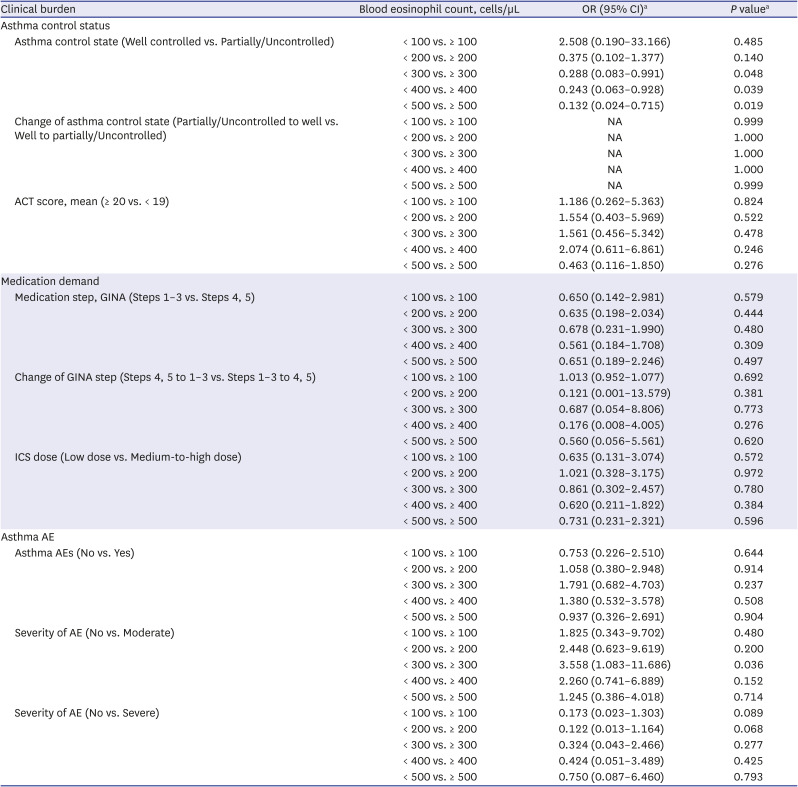
OR = odd ratio, CI = confidential interval, ACT = asthma control test, GINA = Global Initiative for Asthma, ICS = inhaled corticosteroid, AE = acute exacerbation, NA = not assessed.
aAdjusted factors were age, sex, body mass index, currently smoking, baseline forced expiratory volume in 1 second, baseline GINA medication step and mean drug compliance during 1 year. All patients had no history of acute asthma exacerbation during one year before enrollment. Baseline GINA medication step was excluded in adjusting in analyses of the change of GINA step, because there were not enough subjects to adjust.
Clinical burden according to blood eosinophil count in non-atopic asthmatics
Associations between clinical burden of asthma and blood eosinophil levels in non-atopic asthmatics (adjusted for age, sex, BMI, smoking status, the baseline FEV1, the baseline GINA medication step, and mean drug compliance) are shown in Table 5. Asthma control state, any change in such state, and the mean ACT score were similar between the low and high eosinophil groups at all blood eosinophil cut-off values. The percentage of patients on GINA medications of steps 4 or 5 was higher in the high eosinophil group than in the low eosinophil group at all blood eosinophil cut-off values (100 [87/139, 62.6% vs. 17/38, 44.7%], 200 [69/106, 65.1% vs. 35/71, 49.3%], 300 [54/80, 67.5% vs. 50/97, 51.5%], 400 [35/50, 70.0% vs. 69/127, 54.3%], and 500 cells/µL [29/39, 74.4% vs. 75/138, 54.3%]). Comparisons of groups divided according to blood eosinophil counts of 400 cells/µL and 500 cells/µL showed that the risk of GINA step-up (compared to step-down) was higher in the high eosinophil group. However, the ICS doses were similar in the high and low eosinophil groups at all eosinophil cut-off values. The percentage of patients who experienced AEs was 14.6% (OPD visit, 12.4%; ED visit, 2.1%; and admission to a ward, 1.7%). No patient was admitted to an ICU. The percentages of patients who experienced AEs were similar between the high and low eosinophil groups at all blood eosinophil cut-off values. The percentages of patients who experienced moderate or severe asthmatic AEs were also similar.
Table 5
Comparison of clinical burden (asthma control status, medication demand and asthma AEs) according to the blood eosinophil count in non-atopic asthmatics (N = 178)
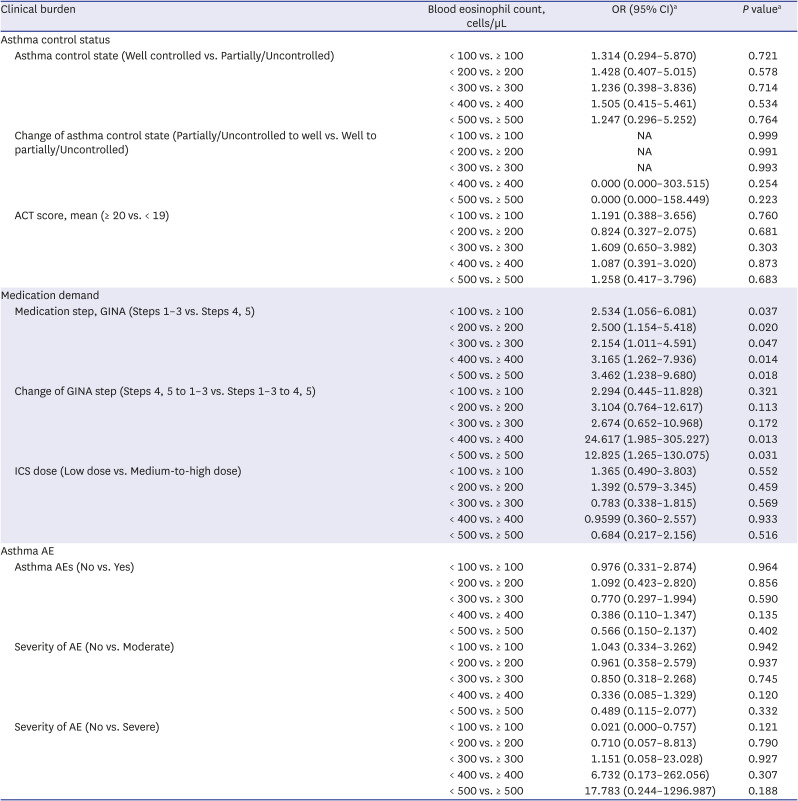
OR = odd ratio, CI = confidential interval, ACT = asthma control test, GINA = Global Initiative for Asthma, ICS = inhaled corticosteroid, AE = acute exacerbation, NA = not assessed.
a
Adjusted factors were age, sex, body mass index, currently smoking, baseline forced expiratory volume in 1 second, baseline GINA medication step and mean drug compliance during 1 year. All patients had no history of acute asthma exacerbation during one year before enrollment. Baseline GINA medication step was excluded in adjusting in analyses of the change of GINA step, because there were not enough subjects to adjust.
Quantitative relationships between blood eosinophil levels and the clinical burden of asthma
Changes in the clinical burden of asthma when the blood eosinophil counts increased in steps of 100 cells/µL, compared to the clinical burden of asthma in the group with blood eosinophils < 100 cells/µL, are shown in Table 6. Asthma control state, GINA medication step, and the occurrences of AEs were all analyzed after adjustments for age, sex, BMI, smoking status, baseline FEV1, baseline GINA medication step, and mean drug compliance. The risk of GINA steps 4 or 5 was (roughly) quantitatively dependent on the increase in blood eosinophil counts in non-atopic asthmatics. In terms of the asthma control state of all and non-atopic asthmatics, as well as moderate exacerbation in atopic asthmatics, some (insignificant) tendencies toward positive or negative relationships with blood eosinophil levels were presented. However, we found no quantitatively dependent relationship.
Table 6
Odd ratio of clinical burden (asthma control state, GINA medication step and asthma AE) by blood eosinophil counts comparing with blood eosinophil counts < 100 cells/µL
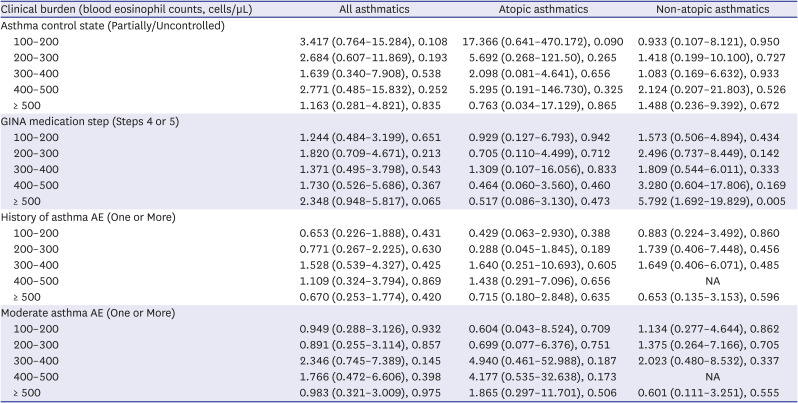
Data are presented as adjusted odd ratio (95% confidence interval), P value. Asthma control status, GINA medication step, experience of AE and moderate AE was used to analyze. Age, sex, body mass index, smoking status, baseline forced expiratory volume in 1 second, baseline GINA medication step and mean drug compliance were adjusted.
GINA = Global Initiative for Asthma, AE = acute exacerbation, NA = not assessed.
DISCUSSION
The main purpose of this study was to evaluate the association between the clinical burden of asthma and blood eosinophil counts in Korean adult asthmatics. TH2 inflammation is usually defined by reference to atopy and eosinophilic inflammation.16 Our atopic and non-atopic asthmatics partially differed in terms of age, sex, and smoking history. We sought associations between the clinical burden of asthma and blood eosinophil counts by dividing all patients into atopic and non-atopic asthmatics. We enrolled only asthmatics with good compliance; poor compliance is a major risk factor for future asthma AEs.1718 Age, sex, BMI, smoking status, baseline FEV1, baseline GINA medication step and mean drug compliance were adjusted. All enrolled patients did not have an history of asthma AE during the year before the enrollment. No patient had an asthma AE during the year before enrollment, probably because most patients who experienced AEs immediately before enrollment were excluded on the basis of systemic corticosteroid use. Among all asthmatics, the risk of severe AEs was higher in patients with blood eosinophil levels < 100 cells/µL than in patients with blood eosinophil levels ≥ 100 cells/µL. Among atopic asthmatics, the risk of moderate AEs was higher in patients with blood eosinophil levels ≥ 300 cells/µL than in patients with blood eosinophil levels < 300 cells/µL. The risk of partially/uncontrolled asthma state was higher in patients with low eosinophil levels. Among non-atopic asthmatics, the risk of a future need for a higher-step medication (GINA 4 or 5) was higher in patients with high blood eosinophil levels than in patients with low blood eosinophil levels. The risk of medication step-up (compared to step-down) was higher in patients with high eosinophil levels. Asthma AEs were not affected by the baseline eosinophil counts in non-atopic asthmatics.
Not all asthmatics with atopy exhibit high blood eosinophil counts and/or eosinophilic inflammation. A 2016 study by Tran et al.19 suggested that the atopic, eosinophilic, and TH2-high asthma phenotypes overlapped. In that study, TH2-high asthma was defined as a total serum IgE ≥ 100 IU/mL and a blood eosinophil count ≥ 140 cells/µL. Although the extent of overlap in the real world remains unclear, this overlap may explain why the mean blood eosinophil counts were similar between atopic and non-atopic asthmatics in our study. Various factors that are difficult to quantify (e.g., air pollution, allergen exposure, and inhaler technique) may affect the clinical burden of asthma in a complicated manner. It may be difficult to accurately predict the future clinical burden on the basis of blood eosinophil count alone. However, many studies have found that blood eosinophil levels reflect the risk of asthma AEs.6782021 Our work is meaningful in that we analyzed the association between the clinical burden of asthma and blood eosinophil counts (which are not affected by systemic corticosteroids) in a Korean adult asthma cohort; we studied atopic and non-atopic asthmatics separately. We excluded systemic corticosteroid-dependent patients with severe asthma, as well as patients with poor compliance. Therefore, we facilitated a good understanding of the association between clinical burden and blood eosinophil counts in most asthmatics.
We found no difference in ICS dose between groups divided according to the baseline blood eosinophil levels (both atopic and non-topic asthmatics). A 2015 study by Price et al.7 showed that the ICS dose per day was similar between groups in a UK cohort that was divided according to a blood eosinophil count of 400 cells/µL. In our study, although the ICS dose steps were similar, the risk of a need for high-step medication (GINA step 4 and 5) was higher in the high eosinophil group of non-atopic asthmatics. This is presumably because these patients also used other agents such as a leukotriene modifier or a long-acting muscarinic antagonist. In nonatopic asthmatics, clinicians may tend to prescribe a bronchodilator (rather than increasing the ICS dose) to control the symptoms of patients with high eosinophil counts. Airway remodeling was inhibited in IL-5-deficient mice, compared with wild-type mice.22 Patients with non-atopic asthma who experience weaker allergen-related effects might choose medications that dilate a remodeled airway, rather than control inflammation. It is unknown whether the blood eosinophil count exhibits a relationship with the extent of airway remodeling. Further studies are needed to explore such an association and define its details.
In most previous studies, baseline blood eosinophil counts were not affected by systemic corticosteroid use.567 Our finding was similar in the present study. In atopic asthmatics, the blood eosinophil level was associated with the risk of moderate AEs. In all asthmatics, the risk of severe AEs was higher in the low eosinophil group (< 100 cells/µL) than in the high eosinophil group (≥ 100 cells/µL), perhaps because patients with non-eosinophilic asthma tend to not respond to conventional treatment and often develop severe AEs.2324 The risk of moderate AEs was higher in the group with high eosinophil levels (≥ 300 cells/µL) than in the group with low eosinophil levels (< 300 cells/µL), consistent with previous findings.567 However, any effect of the eosinophil level disappeared when cutoffs of 400 and 500 cells/µL were used. We found no quantitatively dependent relationship between any asthma burden and the blood eosinophil level. A blood eosinophil cutoff of 300 cells/µL may predict the risk of moderate AEs. However, at higher cutoffs, other risk factors for AE may offset the predictive power of the baseline blood eosinophil count. A 2014 study from the USA reported a difference in the risk of asthma AEs at an eosinophil cutoff of 300 cells/µL; however, the risks of AEs were similar at a cutoff of 400 cells/µL (OR, 1.49; 95% CI, 0.82–2.71).6
It remains unclear why the baseline blood eosinophil count does not strongly predict the future clinical burden of asthma. Price et al.7 found that the level of severe AEs was 2.32-fold (95% CI, 1.99–2.71) higher in a group with blood eosinophil levels ≥ 1,000 cells/µL than in a group with blood eosinophil levels < 1,000 cells/µL. Zeiger et al.5 reported a 1.31-fold (95% CI, 1.07–1.60) increase in a group with blood eosinophil levels ≥ 400 cells/µL, compared to a group with blood eosinophil levels < 400 cells/µL. Direct comparisons are difficult; the group features and the adjustment factors varied. However, the results do not suggest a very strong association between the clinical burden of asthma and blood eosinophil counts. Furthermore, eosinophil stability was not considered. Blood eosinophil counts from the same person vary over time. Jung et al.25 reported that a single eosinophil count may not suffice when managing eosinophilic asthma; several factors (including technical considerations) may influence the count. Toledo-Pons et al.26 reported that, compared with the absolute count, eosinophil variability was a better indicator of hospital episode risk. Because eosinophil stability may be problematic, other biomarkers that accurately reflect eosinophilic inflammatory status are needed. A high blood eosinophil count does not suggest that eosinophilic inflammation is severe. Depending on the patient, relatively low levels of eosinophils may affect the clinical course; some patients may be asymptomatic despite high blood eosinophil numbers.2728 A recent Korean study compared patients with severe and non-severe asthma; the serum eosinophil-derived neurotoxin level reflected severity better than did the blood eosinophil count.29 Biomarkers that directly reflect the eosinophilic inflammatory state are needed to predict future clinical burden.
This study had several limitations. First, the influence of ICS on the blood eosinophil count was not considered. Inhaled high-dose budesonide (1,600 μg/day for 14 days) decreased the blood eosinophil count by approximately 200/µL in 10 asthmatics.30 The effects of other doses and types of ICS on eosinophils are unknown. Second, the 1-year period differed among patients. Seasonal effects would have been equally reflected. However, environmental factors such as air pollution and fine dust, which differ from year to year, were not considered. The numbers of patients followed up during the same year were too small to analyze. Third, more patients than expected were excluded because of poor compliance or the use of systemic corticosteroids. The impacts of these excluded patients on the outcomes were not analyzed. Furthermore, the association between the clinical burden and blood eosinophil count in asthmatics who often used systemic corticosteroids was not evaluated.
In conclusion, among atopic asthmatics who were not exposed to systemic corticosteroids at enrollment in the COREA cohort, a high blood eosinophil count (≥ 300 cells/µL) could help to predict the risk of moderate AEs. Among non-atopic asthmatics, a high blood eosinophil count (≥ 100, 200, 300, 400 and 500 cells/µL) could help to predict the risk of a future need for higher-step medication. The baseline blood eosinophil count may help to predict the future clinical burden of asthma.
 XML Download