

 PDF
PDF Citation
 Print
Print


INTRODUCTION
Stroke is one of the five leading causes of death and can result in irreversible brain damage and permanent disability; hence, rapid diagnosis and treatment are essential.1 When patients present to the emergency department (ED) with symptoms of a suspected stroke, such as neurological deficits or altered mental status, they are rapidly evaluated and treated according to the hospital’s stroke protocol.
Overall, 5–30% of patients suspected of having a stroke have non-cerebrovascular diseases that are referred to as stroke mimics.234 Recent studies have reported that 1–20% of patients presenting with stroke mimics receive tissue plasminogen activator (tPA), resulting in unnecessary imaging tests and hospitalization costs.3456 In addition, some studies have reported that 1–2% of stroke-mimic patients receiving tPA develop cerebral hemorrhage.789 Therefore, it is necessary to quickly identify stroke mimics to reduce unnecessary medical expenses and avoid potential bleeding risks.
Code stroke activation is determined based on the patient’s presenting complaints, past medical history, vital signs, and neurological examinations in the ED. Several studies have reported the characteristics of stroke mimics that differentiate them from stroke. However, many studies have focused on the etiologies of stroke mimics, risk factors, and accompanying symptoms, while the analysis of neurological examinations has been insufficient.10111213 The neurological examination will provide emergency medicine physicians with the most objective information about the likelihood of an acute stroke. Therefore, it is essential to differentiate stroke mimics from stroke based on neurological examinations as well as the patient’s medical history and neurological symptoms for the activation of code stroke.
We analyzed the clinical characteristics and neurological examination findings of code stroke patients in the ED. The aim of this study was to identify whether there are clinical features that can differentiate stroke from stroke mimics in the ED.
METHODS
Study setting and population
This was a single-center retrospective observational study of code stroke patients in the ED from January to December 2019. It was conducted in a tertiary academic hospital with approximately 70,000 annual ED visits.
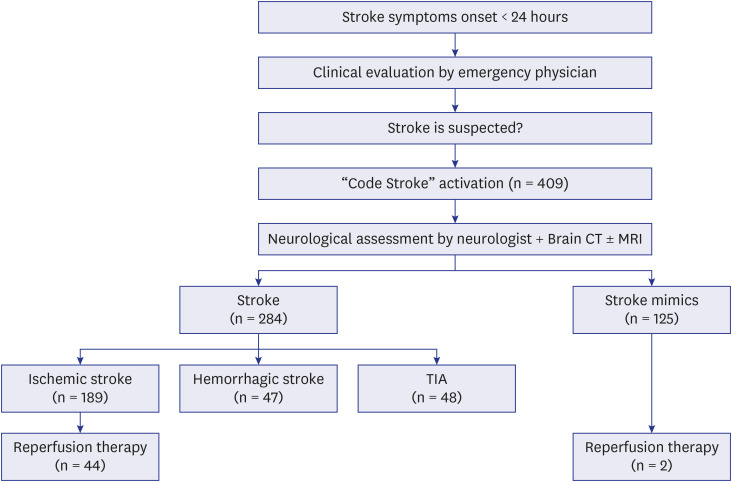
Fig. 1 illustrates the flow of the code stroke protocol. First, a nurse obtained the patient’s medical history, performed an essential neurological examination to help classify the patient’s condition, and informed the emergency physician that there was a possibility of acute stroke. The emergency physician then confirmed the medical history and performed a neurological examination. If there was a possibility of acute stroke, the emergency physician activated a code stroke. For acute ischemic stroke, the principle of treatment is intravenous injection of a fibrinolytic drug (tPA) within 4.5 hours of the onset of symptoms. However, as the effectiveness of endovascular recanalization therapy using a stent retriever has been demonstrated in large-scale randomized trials, treatment guidelines have been changed such that endovascular recanalization can be attempted up to 24 hours after the onset of stroke symptoms.141516 Accordingly, a code stroke was applied to all patients who visited the emergency room within 24 hours after the onset of stroke symptoms. For patients who recognized symptoms after waking up, a code stroke was activated in those who visited the hospital within 24 hours after falling asleep or within 24 hours of the last time they felt normal. If the time of symptom onset or when they last felt normal was unclear, it was determined by the judgment of the emergency physician whether to activate the code stroke. Patients under the age of 18 years were excluded from the study.
Data collection and outcome measurement
We used data from a single-center prospective stroke registry that included all code stroke patients treated in the ED. Additionally, we reviewed the medical records and analyzed the data retrospectively. Age, sex, past medical history, vital signs (blood pressure, heart rate, respiratory rate, body temperature) at the time of visit, clinical symptoms, last known normal time, symptom onset time, time interval between symptom onset and ED visit, National Institutes of Health Stroke Scale (NIHSS) score, and use of tPA were investigated. A neurological specialist applied the NIHSS after activation of code stroke. If there was no neurological specialist available, a neurological resident performed it. Neurological symptoms are defined as only those symptoms described by the patient or caregiver during history taking, and focal neurological deficits are defined as signs confirmed by the NIHSS. The final diagnosis was based on the primary diagnosis at discharge as identified from the medical record. After all tests, including brain CT and MRI, were completed, a neurosurgeon or neurologist diagnosed whether a stroke had occurred. If the condition was not stroke, the final diagnosis was made after consultation with all relevant departments, including emergency medicine. Cases of cerebral infarction, cerebral hemorrhage, and transient ischemic attack (TIA) were defined as stroke, and all other cases were defined as stroke mimics. Based on the final diagnosis, the patients were classified into a stroke group and a stroke mimic group. The clinical and neurological characteristics of the two groups were compared and analyzed.
Statistical analysis
We utilized IBM SPSS Statistics version 20.0 (IBM Corp., Armonk, NY, USA) for all statistical methods. If the continuous variables in two groups followed a normal distribution, the Pearson χ2 test was used, and if not, the Mann-Whitney U test was used. Independence tests and trend analyses of categorical variables were performed using the χ2 test, Fisher’s exact test, and linear-by-linear association. Multivariate logistic regression analysis was performed to identify the variables affecting stroke, and all variables with P < 0.05 in the univariate analysis were included in multivariate analysis. We also constructed a receiver operating characteristic (ROC) curve to evaluate the performance of the multivariable model and calculated the area under the curve (AUC) to estimate the predictive validity. Statistics are expressed as the mean ± SD, and if the data do not follow the normal distribution, the statistics are expressed as the median and interquartile range. In the comparative analysis of neurological tests, odds ratios (ORs) and 95% confidence intervals (CIs) are presented together. A result was considered statistically significant if its P value was less than 0.05.
RESULTS
Baseline characteristics
A total of 409 code stroke patients presented to the ED during the study period. Of these, 284 (69.4%) had strokes, and 125 (30.6%) had stroke mimics. Of the 284 strokes, 189 (46.2%) were ischemic strokes, 47 (11.5%) were hemorrhagic strokes, and 47 (11.5%) were TIAs (Fig. 1). During the study period, none of the code stroke patients were under 18 years of age.
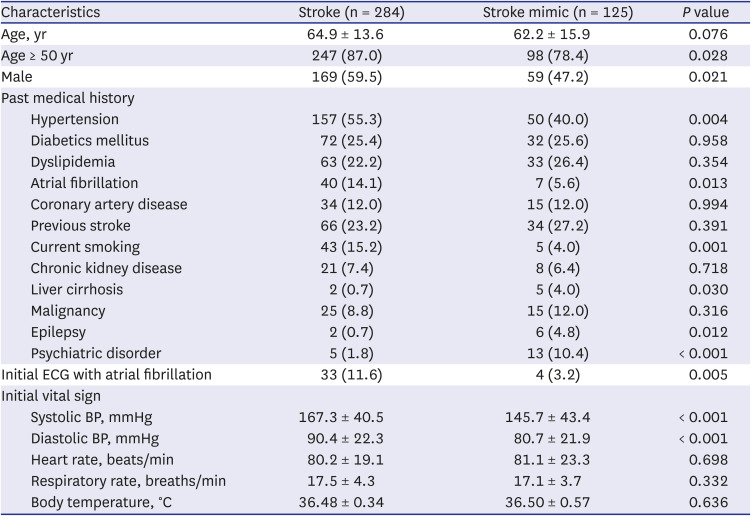
Table 1 describes the baseline characteristics. There was no significant difference in mean age between the two groups, but the number of patients over 50 years old was significantly higher in the stroke group than in the stroke mimic group (247 [87.0%] vs. 98 [78.4%], P = 0.028). The proportion of males was also higher in the stroke group (59.5% vs. 47.2%, P = 0.021). Stroke patients had a significantly more prominent history of hypertension, atrial fibrillation, and smoking, whereas stroke mimic patients had significantly higher cirrhosis, epilepsy, and psychiatric disorders (Table 1). The frequency of atrial fibrillation on the initial electrocardiogram was also higher in the stroke group (11.6% vs. 3.2%, P = 0.005). There were no significant differences in initial vital signs between the two groups except for blood pressure. Both systolic and diastolic blood pressure were significantly higher in the stroke group (Table 1).
Table 1
Baseline characteristics of patients with strokes and stroke mimics
Type and frequency of stroke mimics
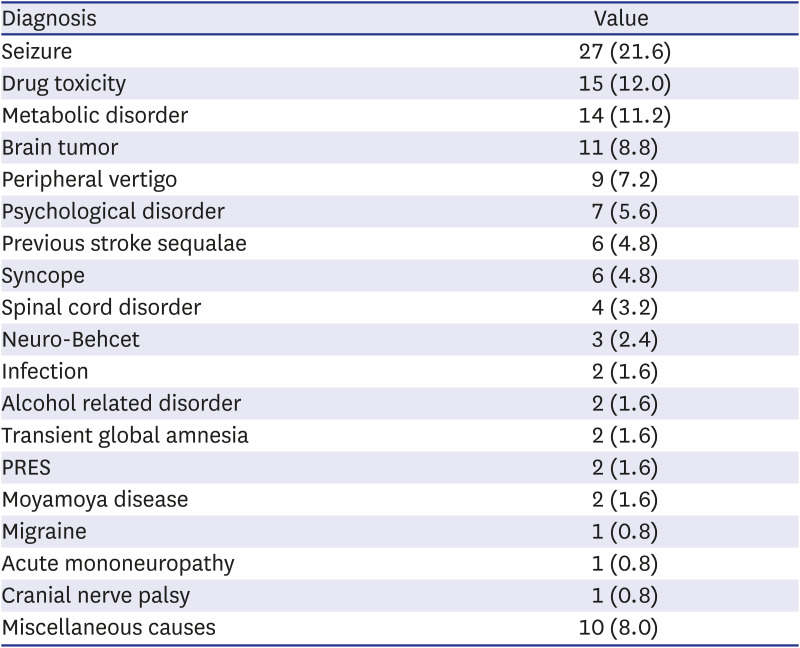
The most common cause of stroke mimics was seizure (21.6%), followed by drug toxicity (12.0%), metabolic disorders (11.2%), peripheral vertigo (7.2%), psychological disorders (5.6%), and stroke sequelae (4.8%) (Table 2).
Table 2
Final diagnosis of stroke mimics
Neurological symptoms and test features
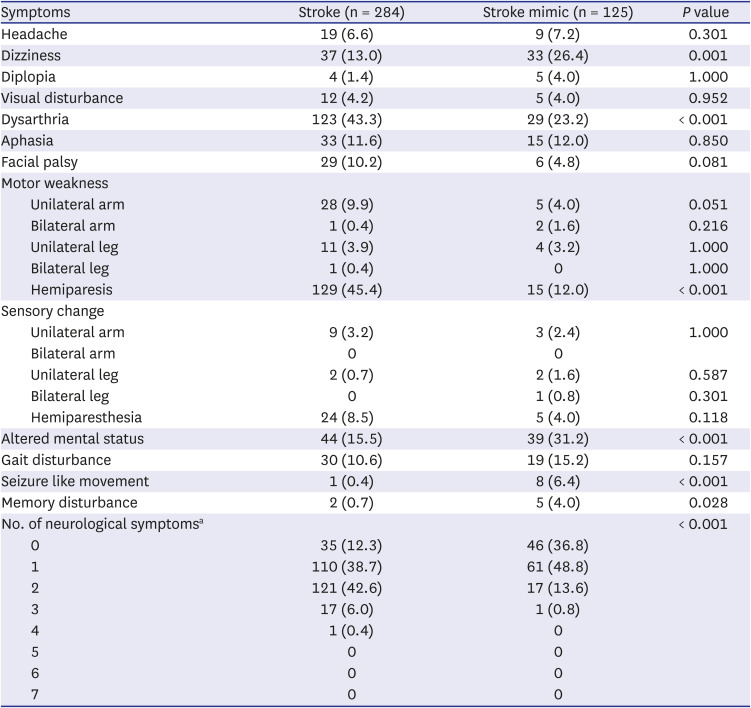
Table 3 presents a comparison of neurological symptoms between the two groups. Dizziness, altered mental status, seizure-like movements, and memory disturbance were significantly more common in the stroke mimic group than in the stroke group. On the other hand, dysarthria and hemiparesis were significantly more common in the stroke group. In addition, the number of neurological symptoms was associated with the likelihood of stroke. Among a set of seven focal neurological symptoms (unilateral limb weakness, unilateral limb sensory change, facial palsy, dysarthria, aphasia, diplopia, and visual disturbance), the code stroke patients showed an increased likelihood of stroke as the number of neurological symptoms increased (P < 0.001).
Table 3
Comparison of neurological symptoms between strokes and stroke mimics
The initial NIHSS score was significantly higher in the stroke group than in the stroke mimic group (3.0 vs. 2.0, P = 0.003) (Table 4). Analysis of NIHSS scores that were classified into five ranges based on stroke severity demonstrated an increased likelihood of stroke as the NIHSS score increased (P = 0.005). For individual items in the NIHSS, oculomotor disorder, visual disturbance, facial palsy, upper limb monoparesis, hemiparesis, sensory change, dysarthria, and neglect were observed more frequently in the stroke group than in the stroke mimic group (Table 4).
Table 4
Comparison of neurological assessments (NIHSS items) between strokes and stroke mimics
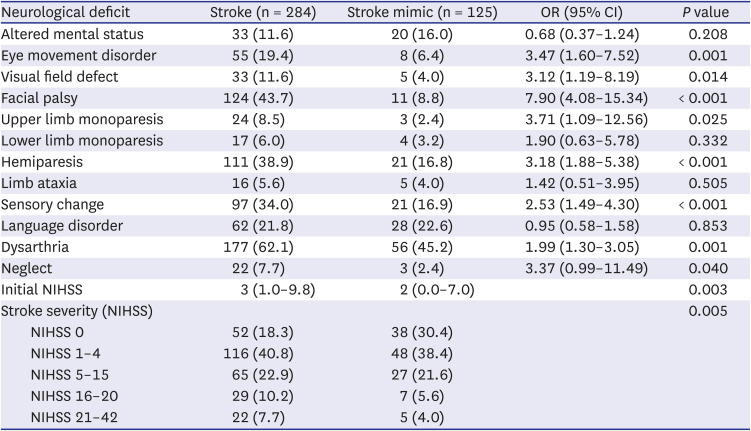
Table 5 shows the number of focal neurological deficits observed in patients and their association with stroke. As in neurological symptoms, code stroke patients tended to increase the likelihood of a stroke as the number of accompanying focal neurological deficits increased among the seven specific neurological deficits (unilateral limb weakness [hemiparesis or upper limb monoparesis], unilateral limb sensory change, facial palsy, dysarthria, aphasia [or neglect], visual field defect, and eye movement disorder) (P < 0.001).
Table 5
Comparison of focal neurological deficits between strokes and stroke mimics
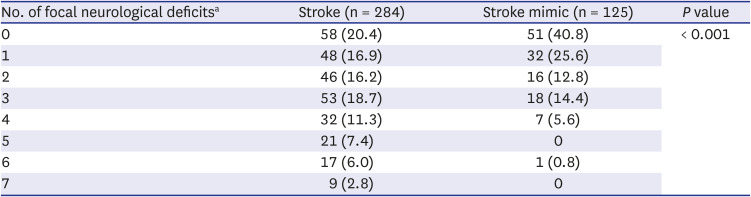
Values are expressed as counts (%).
aThe total number of focal neurological deficits observed in the patient among the following seven specific neurological deficits: hemiparesis (or upper limb monoparesis), unilateral limb sensory change, facial palsy, dysarthria, aphasia (or neglect), eye movement disorder, and visual field defect.
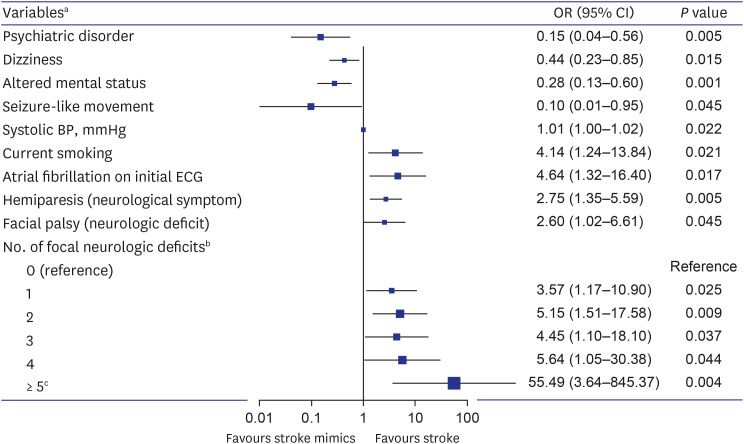
We performed multivariate logistic regression analyses to identify variables affecting stroke (Fig. 2). Consequently, psychiatric disorders, dizziness, altered mental status, and seizure-like movements were associated with stroke mimics. On the other hand, the stroke-related factors were current smoking, elevated systolic blood pressure, atrial fibrillation on the initial ECG, hemiplegia as a symptom, facial palsy as a sign, and an increased number of accompanying focal neurological deficits. On ROC curve analysis, the AUC for predicting stroke was 0.685 (95% CI, 0.637–0.730, P < 0.001) for the number of focal neurological deficits, 0.675 (95% CI, 0.627–0.720, P < 0.001) for facial palsy, and 0.651 (95% CI, 0.603–0.697, P < 0.001) for systolic blood pressure (Fig. 3). The cutoff value of the number of focal neurological deficits was 2 (sensitivity = 62.7%, specificity = 66.4%), and the cutoff value of systolic blood pressure was 153 mmHg (sensitivity = 61.6%, specificity = 63.2%).
Fig. 2
Multivariate logistic regression analysis for prediction of stroke in code stroke patients.
OR = odds ratio, CI = confidence interval, ECG = electrocardiogram, BP = blood pressure.
aVariables derived from predictive factors with a significant (P < 0.05) in the univariate analysis and multivariate analysis for stroke prediction.
bThe total number of neurological deficits observed in the patients among the following seven specific neurological deficits: hemiparesis (or upper limb monoparesis), unilateral limb sensory change, facial palsy, dysarthria, aphasia (or neglect), eye movement disorder, and visual field defect.
cDue to the number of patients was small when there were 5 to 7 focal neurological deficits, these categories were included as a single category with numbers of focal neurologica deficits ≥ 5.

Fig. 3
ROC curve of the multivariate logistic regression model. (A) ROC curve analysis and AUC calculation for prediction of stroke in code stroke patients. (B) ROC curve analysis and AUC calculation for prediction of stroke mimics in code stroke patients.
ROC = receiver operating characteristic, AUC = area under the curve.

DISCUSSION
This study showed that psychiatric disorders, dizziness, altered mental status, and seizure-like movements were associated with stroke mimics. On the other hand, current smoking, elevated systolic blood pressure, atrial fibrillation on the initial ECG, hemiplegia as a symptom, and facial palsy as a sign were stroke-related factors. In addition, the code stroke patients tended to increase the likelihood of a stroke as the number of accompanying focal neurological deficits increased from a particular set of seven.
The baseline characteristics of our study were generally similar to those of previous stroke mimic studies. The diagnosis rate of stroke mimics was similar to that of previous studies, showing a rate of approximately 30%.2317 The past medical history and risk factors associated with stroke and stroke mimics were also not significantly different from previous reports.101118192021 The incidence of stroke increases after the age of 50 years, which was confirmed in this study.18192223 The systolic blood pressure differences between the two groups are consistent with previous studies reporting that stroke mimics could be distinguished from stroke based on systolic blood pressure < 150 mmHg.20
The etiologies of stroke mimics were also not significantly different from previous research results.1921 However, compared with previous studies, there was a lower incidence of migraines and a higher incidence of brain tumors. This difference is presumably due to variations in patient characteristics according to the region and hospital type.
We focused on analyzing the NIHSS results in this study, as it is the only way to obtain the most objective information from the patient to differentiate between stroke and stroke mimics prior to code stroke activation. The NIHSS score was significantly higher in the stroke group, but the difference in NIHSS scores between the two groups was smaller than in previous studies.2425 Contrary to previous studies, the inclusion of TIAs in the stroke group appears to have contributed to these findings. Of the 48 TIA patients, 27 had an NIHSS score of 0, and 8 had an NIHSS score of 1. When TIA was excluded from the stroke group and compared with the stroke mimic group, the difference in NIHSS score between the two groups was much more significant (6.0 vs. 2.0, P < 0.001).
In the NIHSS, altered mental status, lower limb monoplegia, limb ataxia, and language disorder were identified as factors that could not differentiate between stroke and stroke mimics. Altered mental status and language disorder were not specific signs for a stroke because they can be commonly present in metabolic encephalopathy, sepsis, drug intoxication, seizure, and psychiatric disorders. Limb ataxia could also be present in alcohol misuse, drug toxicity, infection and other neurological disorders. Lower limb monoparesis did not suggest a stroke because it is a neurological deficit mainly seen in anterior cerebral arterial infarction, which has a very low incidence. In addition, lower limb monoparesis may be caused by lumbar myelopathy or musculoskeletal disorders of the lower limb. The other eight neurological deficits are considered to have shown significant results because seven of them (excluding oculomotor disorders) are signs of middle cerebral artery (MCA) infarction, and MCA infarction is the most common type of ischemic stroke.
Our study showed some discrepancies between neurological symptoms and deficits suggestive of stroke. These discrepancies are thought to be due to different degrees of self-recognition depending on the type of neurological deficit. For example, as can be seen by comparing Tables 3 and 4, most patients recognized hemiparesis and upper limb monoparesis well. On the other hand, many patients did not clinically recognize neurological deficits such as facial palsy, visual field defects, and oculomotor disorder; thus, there were many cases where they did not complain of these conditions but were observed to have them in the neurological examination. In addition, patients with altered consciousness identify neurological symptoms through witnesses or caregivers, which may also cause discrepancies between neurological symptoms and deficits.
Stroke causes focal neurological deficits related to lesion location; therefore, we expected that a combination of focal neurological deficits would help distinguish stroke from stroke mimics. Therefore, eight items that showed significant results on the NIHSS were selected as focal neurological deficits of interest whose combined presence signals a likely stroke (Table 4). Although aphasia was not statistically significant, we also added it as an item for the combination of neurological deficits because aphasia in dominant hemisphere stroke corresponds to neglect in nondominant hemisphere stroke. The combinations of focal neurological deficits may vary depending on the location and size of the stroke lesion, making it impossible to analyze these combinations one by one. Therefore, as an alternative, we evaluated whether the likelihood of stroke increases as the number of focal neurological deficits increases.
Hemiparesis as a sign was predicted to be a significant factor in regression analysis as objective information, but hemiparesis as a symptom, not hemiparesis as a sign, was confirmed as a significant factor. Eight TIA patients who complained of hemiparesis and four stroke mimics who had hemiparesis as a sequela of stroke were the cause of these results. Facial palsy was also a stroke-related factor, and the facial palsy observed in the stroke group could be distinguished from Bell’s palsy because all patients had other neurological deficits. The OR of the number of focal neurological deficits for stroke tended to increase as the number increased, but the OR was lower than expected when the number of neurological deficits was three (Fig. 2). Several stoke mimic patients had three focal neurological deficits due to stroke sequelae, which may have contributed to this outcome. All factors in multivariate analysis did not have high AUC values (Fig. 3). The inclusion of TIA may have influenced these results. In addition, the fact that symptoms and signs vary depending on the location and size of the stroke and the fact that stroke mimics also has various characteristics depending on the etiologies may also have affected these results.
This study is a retrospective study performed through a medical record survey. Therefore, there may be imperfections in controlling variables and bias in the collection process because of incomplete records and missing information. In addition, these results may not reflect differences in patient distribution and characteristics between regions and hospitals because we conducted the study at a single emergency medical institution. Therefore, there are limitations on generalizing the characteristics of stroke mimics as identified in this study. Moreover, clinical use will likely face limitations because we did not suggest a screening tool for discriminating or predicting stroke mimics. However, this study may help reduce code stroke activation by understanding stroke mimics. Patients with the characteristics of stroke mimics and no apparent focal neurological deficits may undergo only CT or diffusion-weighted imaging to rule out stroke without activating code stroke.
In conclusion, stroke mimics were often associated with psychiatric diseases, and symptoms such as dizziness, altered mental status, and seizure-like movements at ED presentation were more common with stroke mimics than with true strokes. Stroke was associated with current smoking, elevated systolic blood pressure, and atrial fibrillation on initial ECG, and the patients often complained of hemiparesis or had signs of facial palsy at the time of the ED visit. In addition, code stroke patients tended to increase the likelihood of stroke as the number of accompanying focal neurological deficits increased among the seven specific neurological deficits (hemiparesis or upper limb monoparesis, unilateral limb sensory change, facial palsy, dysarthria, aphasia or neglect, visual field defect, and oculomotor disorder).
 XML Download