

 PDF
PDF Citation
 Print
Print


INTRODUCTION
Tacrolimus is the most commonly used immunosuppressive drug in solid organ transplantation. Tacrolimus has a narrow therapeutic window and high interpatient variability in terms of bioavailability.1 Underdosing is associated with an increased risk of rejection, whereas overdosing is associated with drug toxicity.2 Therefore, therapeutic drug monitoring (TDM) is mandatory. The area under the 24-hour blood concentration-time curve (AUC0-24) can reflect exposure to the drug better than single-time measurement.3 However, it is difficult to measure the AUC0-24 in clinical practice. Instead, the trough level, which is known to correlate well with the AUC0-24, is used as a marker of drug exposure.4
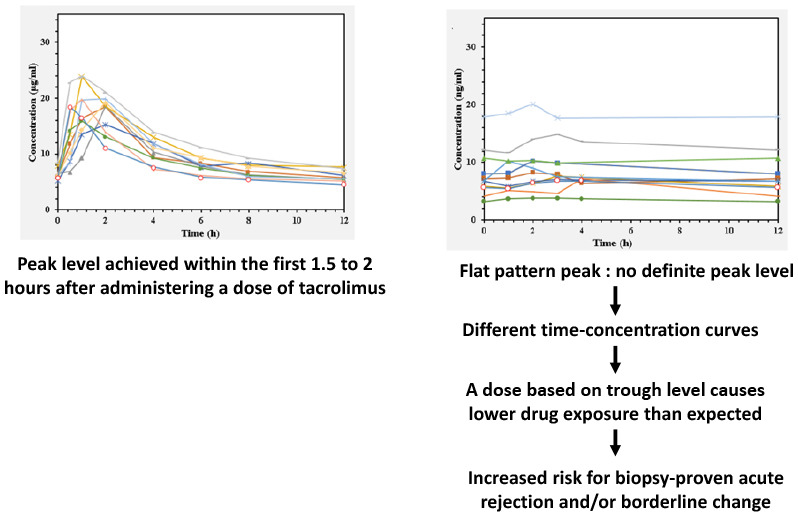
After administering a conventional twice-daily dose of tacrolimus, the initial absorption phase of tacrolimus was observed, and peak levels were achieved within the first 1.5 to 2 hours.25 However, some patients showed a different pattern of initial absorption. The tacrolimus level in these patients 1 to 4 hours after administration was similar to that observed immediately before the administration. The time-concentration curve would be different from what we expect. If a dose of tacrolimus is administered based on the trough level, the total tacrolimus exposure would be lower than predicted in these patients.
Several extensive studies have examined the pharmacogenomic biomarkers of tacrolimus to refine dose selection.6 Polymorphisms in genes encoding metabolizing enzymes and drug transporter are associated with the pharmacokinetics of tacrolimus.7 The cytochrome P450 (CYP) 3A gene, in particular CYP3A5 and CYP3A4, is the most well-known. Additionally, ATP-binding cassette sub-family B member 1 (ABCB 1), P450 oxidoreductase, and solute carrier organic anion have been associated with tacrolimus metabolism.6
In this study, we aimed to analyze the association between C1.5/C0 ratio and clinical outcomes, especially the incidence of biopsy-proven acute rejection (BPAR) and/or borderline change, and perform whole exome sequencing to investigate the genetic susceptibility in patients who showed a different pattern of tacrolimus absorption.
METHODS
Patients
Among the 1,268 patients who underwent kidney transplantation between 2009 and 2017, 95 of them were included retrospectively in this study. The inclusion criteria were patients who underwent kidney transplantation for the first time, were aged between 18 and 80 years, and were treated with tacrolimus, and for whom data regarding the trough level and tacrolimus concentration 1 to 4 hours after the initial administration were available. Patients who received desensitization therapy due to the presence of donor-specific antibodies or ABO blood-type incompatibility were excluded. Patients who showed a different pattern of initial absorption, as mentioned earlier, were firstly enrolled, and over twice as many patients who showed normal absorption were included.
Immunosuppression
All patients received basiliximab as induction therapy. Maintenance immunosuppressive therapy consisted of steroids, mycophenolate, and tacrolimus. Tacrolimus was administered at least 2 hours after and 1 hour before a meal. The initial dose of conventional twice-daily tacrolimus (Prograf®) was 0.075 mg/kg twice daily; the serum through level of tacrolimus was adjusted to 8–10 ng/mL until 3 months, 6–8 ng/mL until 1 year, and 4–6 ng/mL thereafter. Mycophenolate was administered at an oral dose of 500 mg twice a day, and the doses were adjusted in patients with hematologic conditions or adverse effects. Methylprednisolone (500 mg) was intravenously administered during surgery and the dose was gradually reduced to 5 mg of oral prednisolone daily.
Blood concentration of tacrolimus
Ethylenediaminetetraacetic acid-anticoagulated whole blood samples were collected just before administering the morning dose (C0), 1.5 hours after receiving a dose (C1.5), and if possible, hourly thereafter. The blood sampling for concentrations of tacrolimus was obtained mostly within a year after transplantation (median 1, range 1–180, mean 10.5 ± 19.3 months). Tacrolimus concentration in whole blood was analyzed by liquid chromatography tandem mass spectrometry using a Waters 2795 Alliance HT system (Waters Ltd., Watford, UK) and a Quattro micro API tandem mass spectrometer (MicroMass, Manchester, UK).8
Patients were classified into groups according to C1.5/C0 ratio. Patients with a C1.5/C0 < 1.5 were classified as subjects in the flat pattern peak group, while the remaining patients were included in the control group (Fig. 1). The flat pattern peak was determined based on the C1.5/C0 distribution which showed trimodal pattern. Blood concentration at 3 and 4 hours after a dose was measured to verify the C1.5 of tacrolimus was the highest.
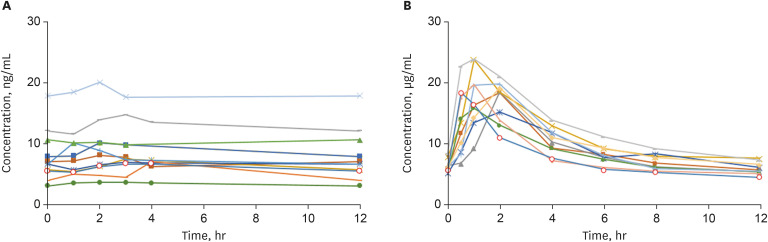
Fig. 1
A representative time-concentration curve of tacrolimus of each group. (A) Flat pattern peak group showed the similar tacrolimus level observed immediately before the administration and 1 to 4 hours after administration and (B) control group showed the peak levels achieved within the first 1.5 to 2 hours after administration of a conventional twice-daily dose of tacrolimus.
Clinical outcomes
The estimated glomerular filtration rate (eGFR) was calculated using the Modification of Diet in Renal Disease equation. Protocol biopsy was performed at 10 days and 1 year after transplantation. BPAR was included both protocol and for-cause biopsy. Borderline change and rejection were determined according to the criteria proposed at the Banff Conference.910 Delayed graft function was defined as the need for hemodialysis within 1 week after surgery. The primary end-point was the association between C1.5/C0 ratio and clinical outcomes, which were evaluated by incidence of BPAR and/or borderline change and eGFR.
Whole Exome sequencing
Exome sequencing was performed using the Ion AmpliSeq™ Exome panel. The size of amplicons amplified by these oligo primer pairs ranged from 125 to 275 bp. Polymerase chain reaction assays were performed to amplify 100 ng of genomic DNA extracted from the peripheral blood. After amplification, library construction was performed using the Ion AmpliSeq Library Kit Plus (Thermo Fisher Scientific, Waltham, MA, USA) in accordance with the manufacturer’s instructions. Libraries were quantified using an Agilent 2100 Bioanalyzer (Agilent, Santa Clara, CA, USA) and then diluted to approximately 10 pM. Subsequently, 33.3 μL of the barcoded libraries were pooled into sets of three barcodes. The combined libraries were sequenced using the Ion Proton platform with PI chip V3 (Thermo Fisher Scientific) following the manufacturer’s instructions.
Variants selection in the CYP3A4, CYP3A5, and ABCB1 genes
Reads were mapped to the human reference genome build (hg19) using a mapping alignment program from Thermo Fisher Scientific (Torrent Suite Software version 4.4) in germ-line and low stringency settings. Single nucleotide variants (SNVs) were called using the Genome Analysis Toolkit 3.8-1 Unified Genotyper.11 All SNVs were annotated using ANNOVAR.12 Twenty-eight SNVs in the CYP3A4, CYP3A5, and ABCB1 genes were selected from all called SNVs based on the RefGene annotation (Supplementary Table 1). We manually checked the sequence alignment and the quality of selected SNVs using IGV 2.8.9 to exclude false-positive variant calls.13
Statistical analysis
To evaluate the influence of C1.5/C0 ratio on post-transplant eGFR and the incidence of BPAR, t-tests and χ2 tests were used. A logistic regression analysis was performed to investigate the independent contributions of demographic and transplant-related variables to the likelihood of having BPAR. Variables from univariate analyses with P values of < 0.20 were considered for inclusion in the final multivariable model. Associations between the flat pattern peak group and SNV carriers were calculated using the logistic regression test for the following genetics models: additive, dominant, and recessive. To correct the effects of clinical variables, the impact of SNVs was further investigated by adjusting the clinical variables. Benjamini-Hochberg multiple testing correction was conducted to estimate the false discovery rate (FDR). FDR adjusted P value < 0.05 were considered statistically significant. All statistical analyses were performed using SPSS Statistics 26.0 software (SPSS Inc., Chicago, IL, USA) and R 3.6.3 software (The R Foundation for Statistical Computing, Vienna, Austria).
RESULTS
Baseline characteristics
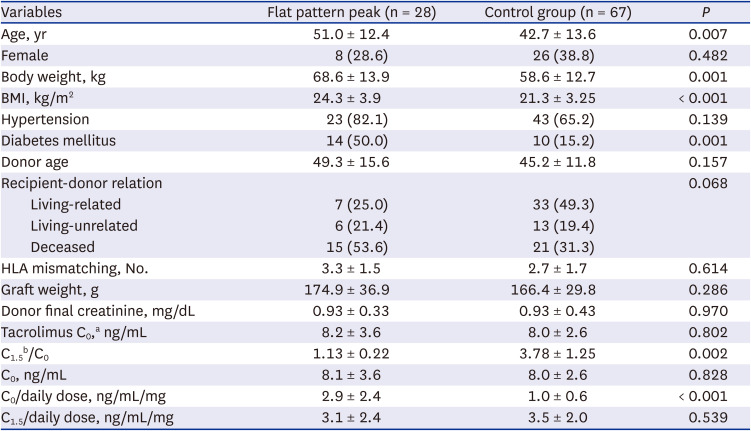
A total of 95 patients were enrolled in this study. Among them, 28 patients were included in the flat pattern peak group, and 67 patients were included in the control group. The mean C1.5/C0 value were 1.13 ± 0.22 and 3.78 ± 1.25 in the flat pattern peak and control groups, respectively (P = 0.002). The mean dose normalized trough concentration (C0/D) was significantly higher in the flat pattern peak group than in the control group (2.9 ± 2.4 vs. 1.0 ± 0.6 ng/mL/mg; P < 0.001). The patients in the flat pattern peak group were older and had a higher rate of deceased donor transplantation (Table 1). Patients did not take other medications known to interact with tacrolimus.1415
Table 1
Baseline characteristics of study population
Clinical outcomes
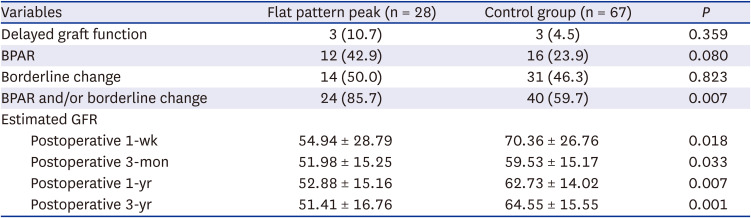
BPAR was higher in the flat pattern peak group than in the control group (42.9% vs. 23.9%) within 3 years after transplantation, however it did not reach statistical significance (P = 0.080). The mean time interval between transplantation and BPAR diagnosis were 3.9 ± 5.0 (median 1, range 1–12) and 5.2 ± 5.4 (median 3, range 1–12) months in the flat pattern peak and control groups, respectively. The overall incidence of BPAR and/or borderline change was significantly higher in patients with a flat pattern peak (85.7% vs. 59.7%; P = 0.007). Ten (35.7%) patients in the flat pattern peak group and 13 (19.4%) patients in the control group showed suggestive calcineurin inhibitor toxicity in pathologic examination (P = 0.111). The mean eGFRs were significantly higher in the normal group at 1-week, 3-months, 12-months, and 36-months after transplantation (Table 2).
Table 2
Outcomes of transplantation
Factors associated with BPAR
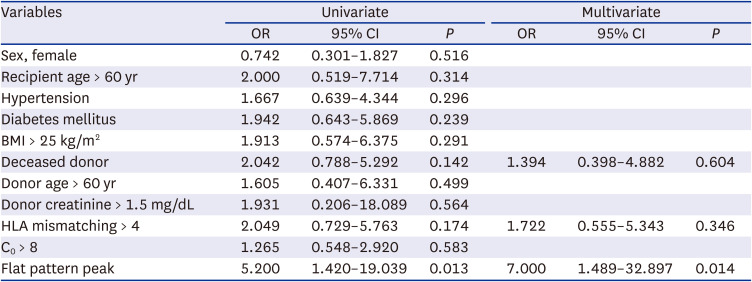
To evaluate the association between the flat pattern peak of tacrolimus and BPAR and/or borderline change, a logistic regression analysis was performed. In multivariate analysis, flat pattern peaks remained an independent risk factor for BPAR and/or a borderline change (odds ratio [OR], 7.000; 95% confidence interval [CI], 1.489–32.897; P = 0.014) (Table 3).
Table 3
Multivariate logistic regression analysis for predicting biopsy-proven acute rejection and/or borderline change
Factors associated with the 36-months eGFR
To investigate the association between the flat pattern peak of tacrolimus and post-transplant 36-month eGFR, univariate and multivariate linear regression analyses were performed. The flat pattern peak was associated with decreased post-transplant 36-month eGFR in univariate analysis. However, the association did not remain significant in multivariate analysis. Older donors and the higher body mass index of recipients showed significant associations with the post-transplant 36-month eGFR (Supplementary Table 2).
Variant association with flat pattern peak
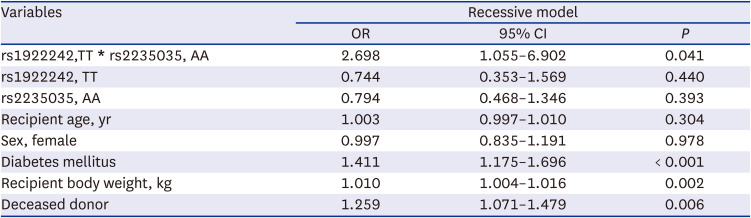
Among 28 SNVs in the CYP3A4, CYP3A5, and ABCB1 genes, 2 were significantly associated with flat pattern peaks. In the ABCB1 gene, rs1922242, and rs2235035 were significantly associated with flat pattern peaks (adjusted P = 0.019 and 0.027, respectively). The effect of SNVs was investigated following adjustments for the clinical variables. Among the 11 variables included in the univariate analysis, recipient`s age, sex, body weight, donor type, and diabetes were included in multivariate analysis. In multivariate logistic regression model, the association between flat pattern peaks and SNVs in ABCB1 remained significant. The ABCB1 rs1922242 TT genotype was significantly more common in the flat pattern peak group (OR, 1.508; 95% CI, 1.184–1.922; adjusted P = 0.001) (Table 4). In addition, the ABCB1 rs2235035 AA genotype was significantly more common in the flat pattern peak group (OR, 1.434; 95% CI, 1.132–1.817; adjusted P = 0.004) (Table 5). Logistic regression with 2 SNVs and clinical variables was conducted to investigate the interaction effects of 2 SNVs. Coefficient of interaction of 2 SNVs was statistically significant (OR, 2.698; 95% CI, 1.055–6.902; P = 0.041) (Table 6).
Table 4
Multivariate logistic regression analysis of the association between ABCB1 rs1922242 and flat pattern peak
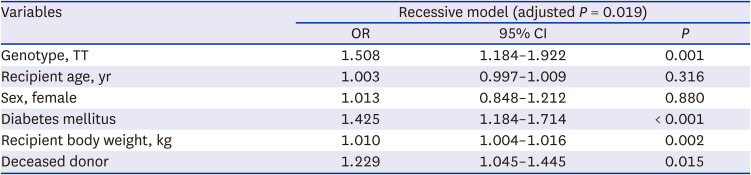
Table 5
Multivariate logistic regression analysis of the association between ABCB1 rs 2235035 and flat pattern peak
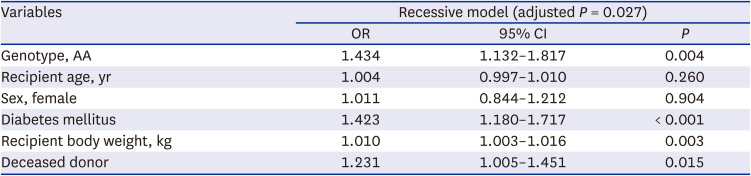
Table 6
Multivariate logistic regression analysis of the association between interaction of ABCB1 rs1922242-rs2235035 and flat pattern peak
DISCUSSION
This study is the first to report patients who showed a unique pattern of initial tacrolimus absorption. They did not exhibit a definite peak in the early absorption phase. In patients with flat pattern peaks, the time-concentration curve would be different from what we expect. If a dose of tacrolimus is administered based on the trough level, the total tacrolimus exposure would be lower than predicted, and which could increase the risk for acute rejection. Suboptimal immunosuppression can occur although the physicians carefully monitor the trough level and the patients have good medication adherence in flat pattern peak group.
Our data showed that patients with flat pattern peak had a higher risk of BPAR and/or borderline change within 3 years after transplantation. Acute rejection is well known risk factors for long term graft failure.16 Borderline change is also reported to be independently associated with poor long term graft outcomes.1718 Thus, flat pattern peak causes the increased risk of BPAR and/or borderline change and can be associated with poor long term graft outcomes.
Limited sampling strategy (LSS) is an abbreviated regression analysis using several time points has been proposed to predict AUC.1920 There is a controversy on the optimal collection time and frequency of blood sampling. Aouam et al.19 showed that 2-time point LSS using C0 and C2 is reliable, accurate, and practical to estimate the AUC of tacrolimus regardless of the posttransplantation time. The TDM of tacrolimus has been extensively performed by determining C0.5 However, measurement of both C1.5 and C0 is important to distinguish the patients with unique drug absorption patterns. After determining the group of patients with a flat pattern peak, both C1.5 and C0 were measured after kidney transplantation.
This study demonstrated the SNVs that were associated with this patient groups. Several extensive studies have been conducted to examine the pharmacogenomics of tacrolimus. Some genetic variants were associated with the pharmacokinetics of tacrolimus. However, genotyping to select the optimal dose is not recommended because of the lack of data regarding its effects on clinical outcomes.2122 Although the current study was conducted using only a small sample of patients, it could be considered meaningful as it illustrated the different pharmacokinetics of tacrolimus and associated genetic variants, also with the effects on patients’ clinical outcomes.
CYP genes, especially CYP3A4 and CYP3A5, are important for the disposition of tacrolimus.23 The most studied polymorphism is CYP3A5*3 (rs776746). Compared to CYP3A5*3/*3 carriers, CYP3A5*1 carriers show increased metabolism of tacrolimus.24 Tacrolimus is transported out of the cells via P-glycoprotein, which is encoded by the ABCB1 gene.25 The highly variable intestinal expression of ABCB1 is an important determinant of the tacrolimus absorption.26 The ABCB1 3435C>T (rs1045642), 1236C>T (rs1128503) and 2677G>T/A (rs2032582) SNVs have been extensively investigated; however, their functional significance remains unclear.27 Our data showed 2 SNVs in ABCB1 gene, rs1922242, rs2235035, were associated flat pattern peaks. They were not previously reported to be associated with tacrolimus concentration. They could be used as candidate SNVs in further studies and validation using larger patient cohorts is required.
Our study focused on the CYP3A4, CYP3A5, and ABCB1 genes because their role in the pharmacogenomics of tacrolimus have been largely investigated and reported. The flat pattern absorption might be due to the interplay between metabolism and drug transporter. Vanhove et al.28 showed that the effect of ABCB1 on the tacrolimus dose requirement was modulated by the CYP3A genotype. Highly active efflux pumps were required to maintain both a low intracellular concentration of tacrolimus and CYP3A capacity, when tacrolimus metabolism was slow.28 When the drug transporter function was activated, the proportion of drug pumped out of the intestinal enterocytes increased, leading to higher clearance and lower blood concentrations of tacrolimus. Thus, the combined effect of CYP3A and ABCB1 polymorphisms in patients with flat pattern peaks is also worth investigating.
When a flat pattern peak is suspected, one of the generic form can be used. Generic tacrolimus is associated with a higher dose-normalized peak concentration and shorter time to peak concentration both during the early period and under steady-state conditions compared to the reference tacrolimus product.29 Once-daily formula can be tried. Once-daily formula tacrolimus is absorbed in more distal intestine compared to the twice-daily formulas.3031
ABCB1 expression increases from stomach and duodenum to colon.32 Our data showed that flat pattern peaks were associated with SNVs in ABCB1 gene. The different expression of ABCB1 gene in gastrointestinal tract might influence the absorption of once-daily and twice-daily tacrolimus differently in patients with flat peaks. After conversion, analysis of blood samples for evaluating the pharmacokinetic profiles is mandatory. In 6 patients with flat peaks, the C1.5/C0 ratio ranged from 2.0 to 3.3 after switching to a once-daily formula. Conversion to other immunosuppressant or increasing the dose of antimetabolites can be considered.
This study has a number of limitations. First, this is a retrospective study including small number of selected patients during the study period, which can cause lower statistical power. We did not include the consecutive patients during the study period, which might cause selection bias. Second, most of the patients underwent blood sampling to access the tacrolimus level within a year after transplantation, but not all of them did. The pharmacokinetics of tacrolimus are affected by bowel motility, which changed according to the period after transplantation. Third, it is possible that patients who had early graft loss due to the flat pattern peak of tacrolimus were not included in this study. We found the group of patients with flat peaks, recently. Thus patients had repeated BPAR and graft loss due to flat peak could not be identified. Finally, long term follow-up is needed to show the subsequent results, such as graft failure or antibody-mediate rejection. However, it is limited to follow up the study population longer without changing the immunosuppressant. Ethical problem should be considered for a study with long term follow up, because flat peak can be associated with poor clinical outcome.
In conclusion, a group of patients showed a unique pattern of tacrolimus absorption after kidney transplantation. Measurement of C1.5 along with the trough level was performed to identify these patients. A C1.5/C0 ratio < 1.5 was associated with an increased risk of BPAR and/or borderline change. The SNVs, rs1922242 and rs2235035 in ABCB1 gene were associated with flat pattern peaks. Because this is a preliminary study with small number of patients, further study using a large cohort of patients is required to validate the importance of these candidate SNVs.
 XML Download