서 론
증 례
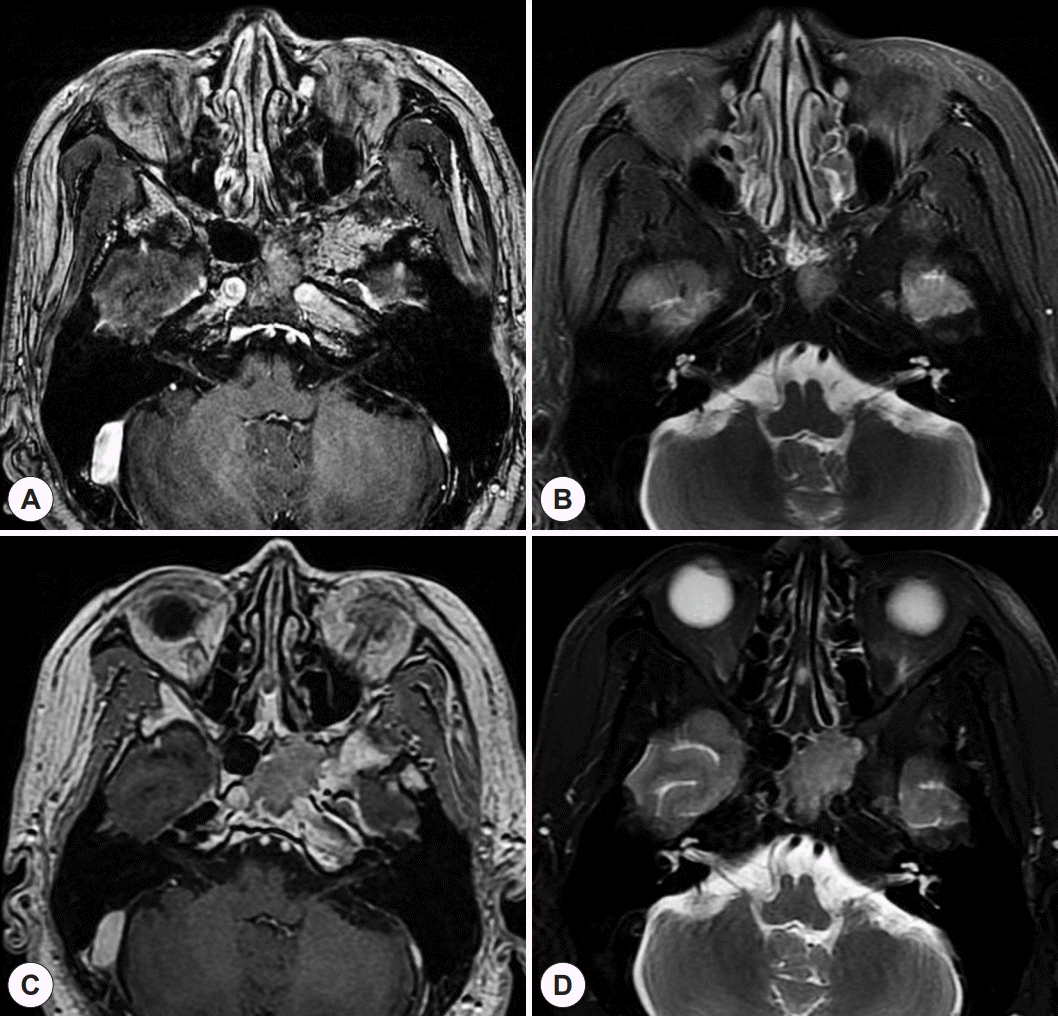
 | Fig. 1.Post-operative brain magnetic resonance images (MRI). A: Post-operative 5 years Axial view of T1 enhanced brain MRI shows that intermediate signal intensity in left sphenoid sinus with homogenous enhancement, after that, patient had received radiotherapy for recurrent pituitary adenoma. B: Axial T2-weighted imaged. C: Post-operative 11 years Axial view of T1 enhanced brain MRI shows that intermediate signal intensity in left sphenoid sinus and increasing in size compared to previous findings. D: Axial T2-weighted imaged. |
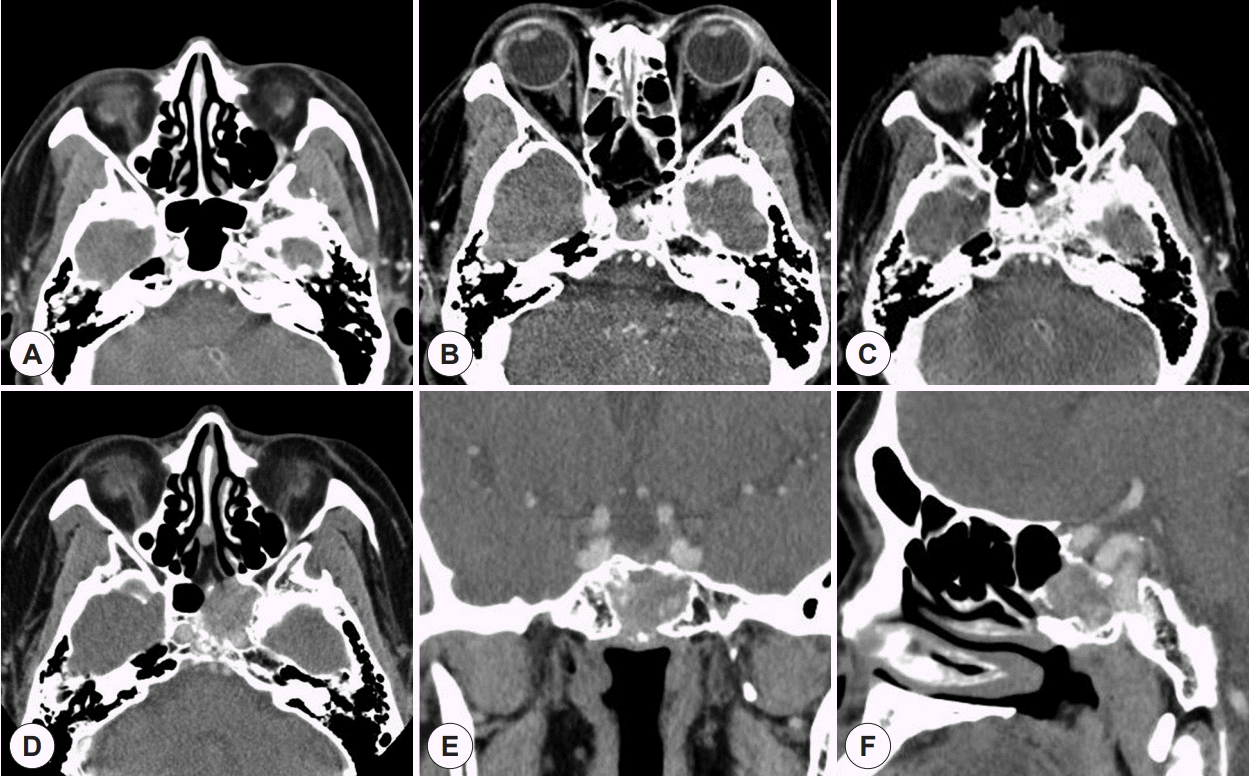
 | Fig. 3.Initial and follow-up paranasal sinus computed tomography (PNS CT) (A) there is no abnormal finding in initial view of PNS CT. (B) After trans-sphenoidal operation, PNS CT shows that soft tissue density in left sphenoid. (C) Post-operative 5 years PNS CT shows that an increase in size compared to the previous CT image without bony erosion. (D) Post-operative 11 years PNS CT shows that inhomogeneous density mass in left sphenoid sinus has found markedly size increase with internal carotid artery area infiltration and bony destruction was found to lateral sphenoid bone and partially bony erosion to sella turcica. (E) Coronal view of PNS CT (F) Sagittal view of PNS CT. |
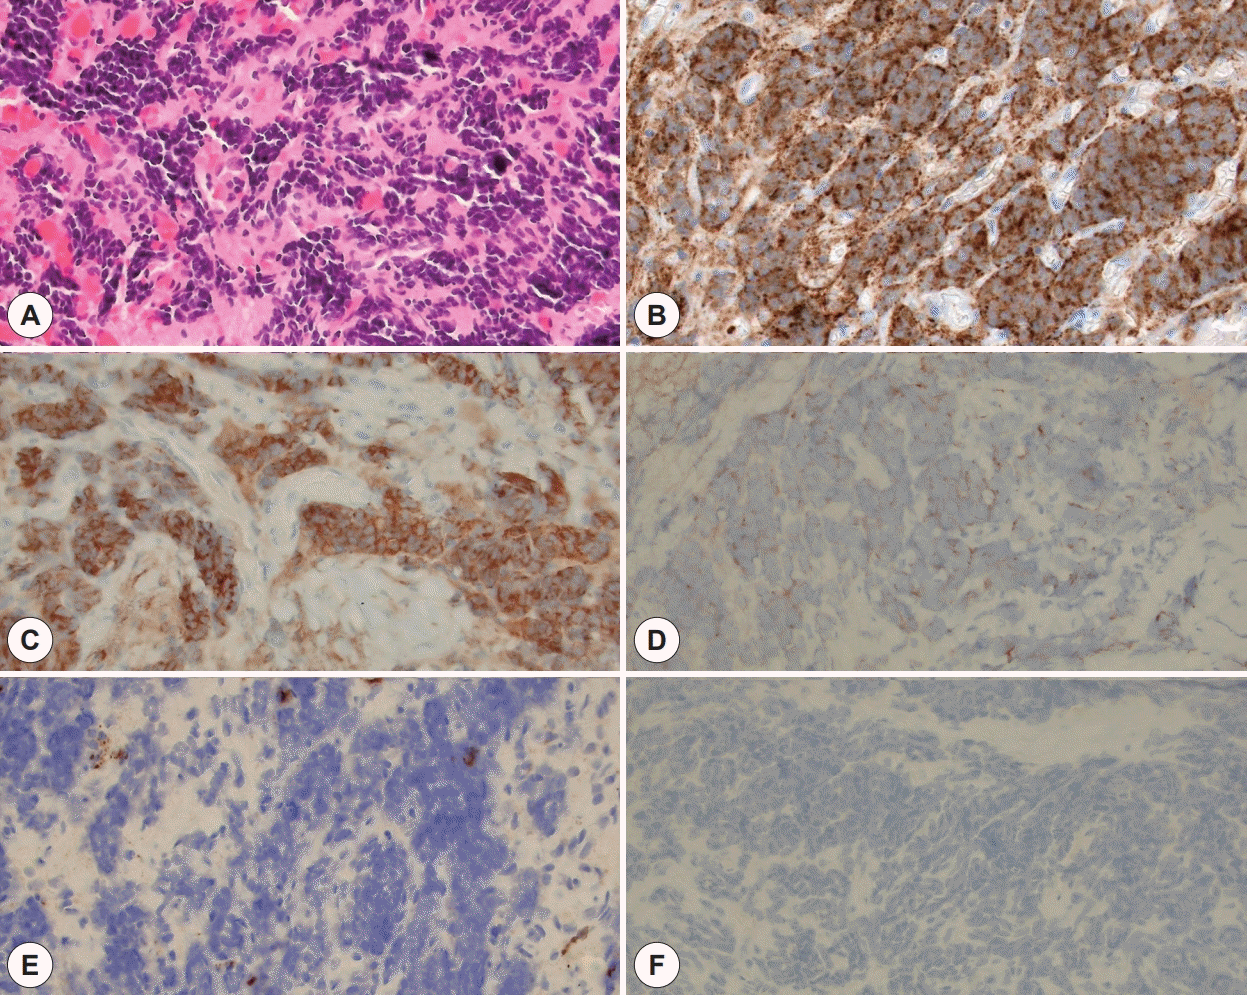
 | Fig. 4.Pathological findings. A: No pituitary gland tissue is observed. Round to oval cells with scant cytoplasm are arranged in a sheet-like pattern. These cells show finely dispersed chromatin and no distinct nucleoli (H&E, ×400 magnification). B-D: Tumor cells show diffuse membranous positive staining for CD56 and synaptophysin and paranuclear dot-like immunoreactivity for panCK (B: CD56, C: synaptophysin, D: panCK, ×400 magnification). E-F: Only tumor infiltrating lymphocytes demonstrate positive immunoreactivity for CD45 and tumor cells are negative for CD45 and GFAP (E: CD45, F: GFAP, ×400 magnification). |


 PDF
PDF Citation
 Print
Print


 XML Download