

 PDF
PDF Citation
 Print
Print


INTRODUCTION
Hepatocellular carcinoma (HCC), the most common primary malignant tumor of the liver, can be diagnosed based on typical imaging hallmarks in high-risk patients with chronic liver disease. The radiologic hallmarks for the diagnosis of HCC are arterial phase hyperenhancement and washout during the portal venous, delayed, or hepatobiliary phase on multiphase computed tomography (CT) or magnetic resonance imaging (MRI) with extracellular or hepatobiliary contrast agents.1 However, some hypervascular metastatic liver tumors may show a similar enhancement pattern and should be differentiated from HCC.2–4 Here, we describe a case of metastatic melanoma of the liver mimicking HCC in a patient with a history of malignant melanoma that had lasted for 11 years.
Go to : 
CASE REPORT
1. Clinical findings
A 65-year-old woman presented with a multinodular liver mass incidentally detected during screening ultrasonography. She had been diagnosed with stage IIA malignant melanoma of the left neck 11 years earlier. After wide excision and the administration of adjuvant interferon-alpha therapy, the patient maintained complete remission during the following 5 years. She did not smoke or drink alcohol. She had no associated symptoms, and there were no significant findings during physical examination. The laboratory data revealed a white blood cell (WBC) count of 8,000/μL, hemoglobin of 13.4 g/dL, platelet of 220,000/μL, total bilirubin of 0.97 mg/ dL, albumin of 4.8 g/dL, prothrombin time international normalized ratio (PT INR) of 0.94, aspartate aminotransferase (AST) of 28 IU/L, alanine aminotransferase (ALT) of 21 IU/L, and lactate dehydrogenase (LDH) of 688 IU/L. The results for the tumor markers were as follows: alpha-fetoprotein (AFP), 2.45 ng/mL; protein induced by vitamin K absence or antagonist-II (PIVKA-II), 18 mAU/mL; carcinoembryonic antigen (CEA), 4.27 ng/mL; carbohydrate antigen 19-9 (CA 19-9), 16.07 U/mL. The results of all blood tests were normal, except for a mild elevation of LDH. The viral serology test revealed hepatitis B surface antigen negativity, hepatitis B surface antibody positivity, hepatitis B core antibody negativity, and hepatitis C antibody negativity.
2. Image and pathologic findings
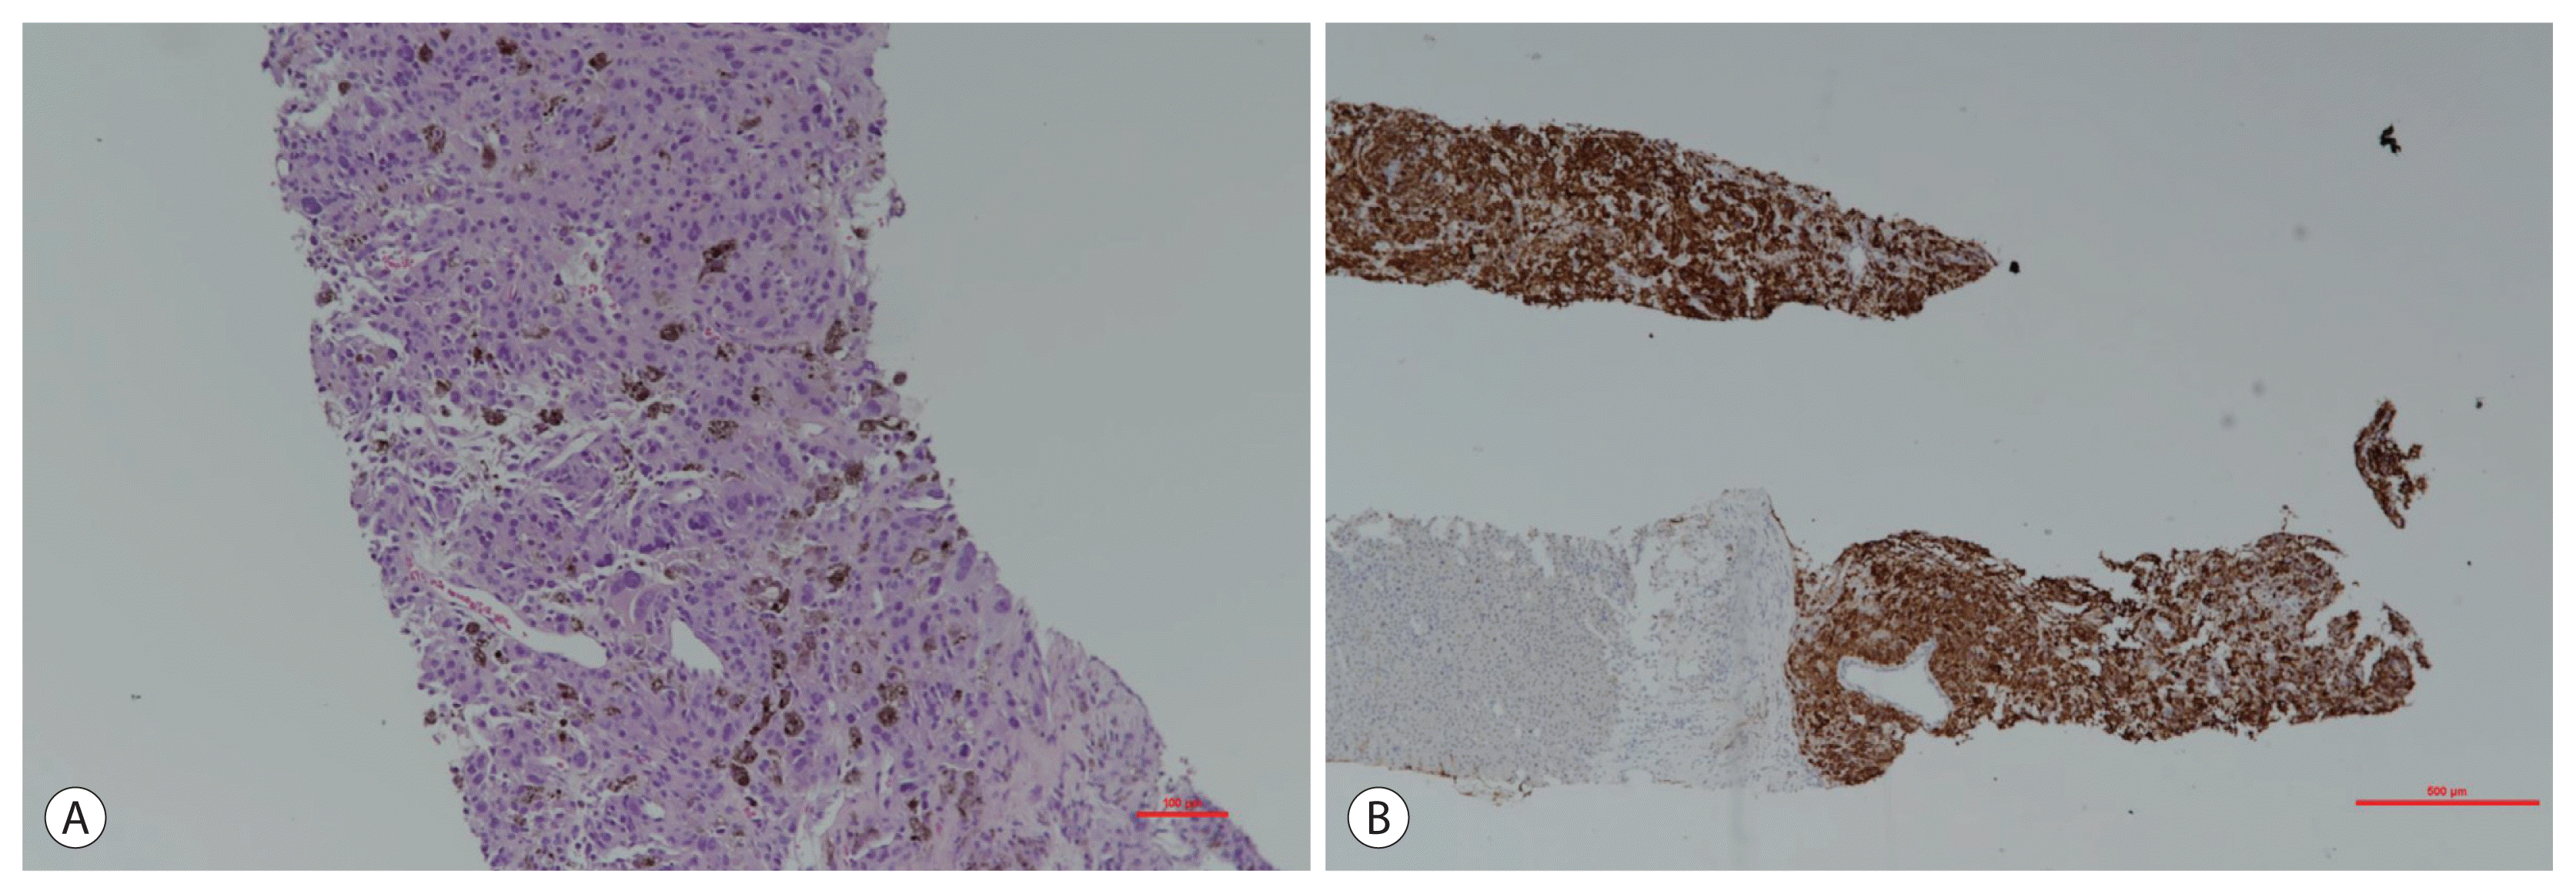
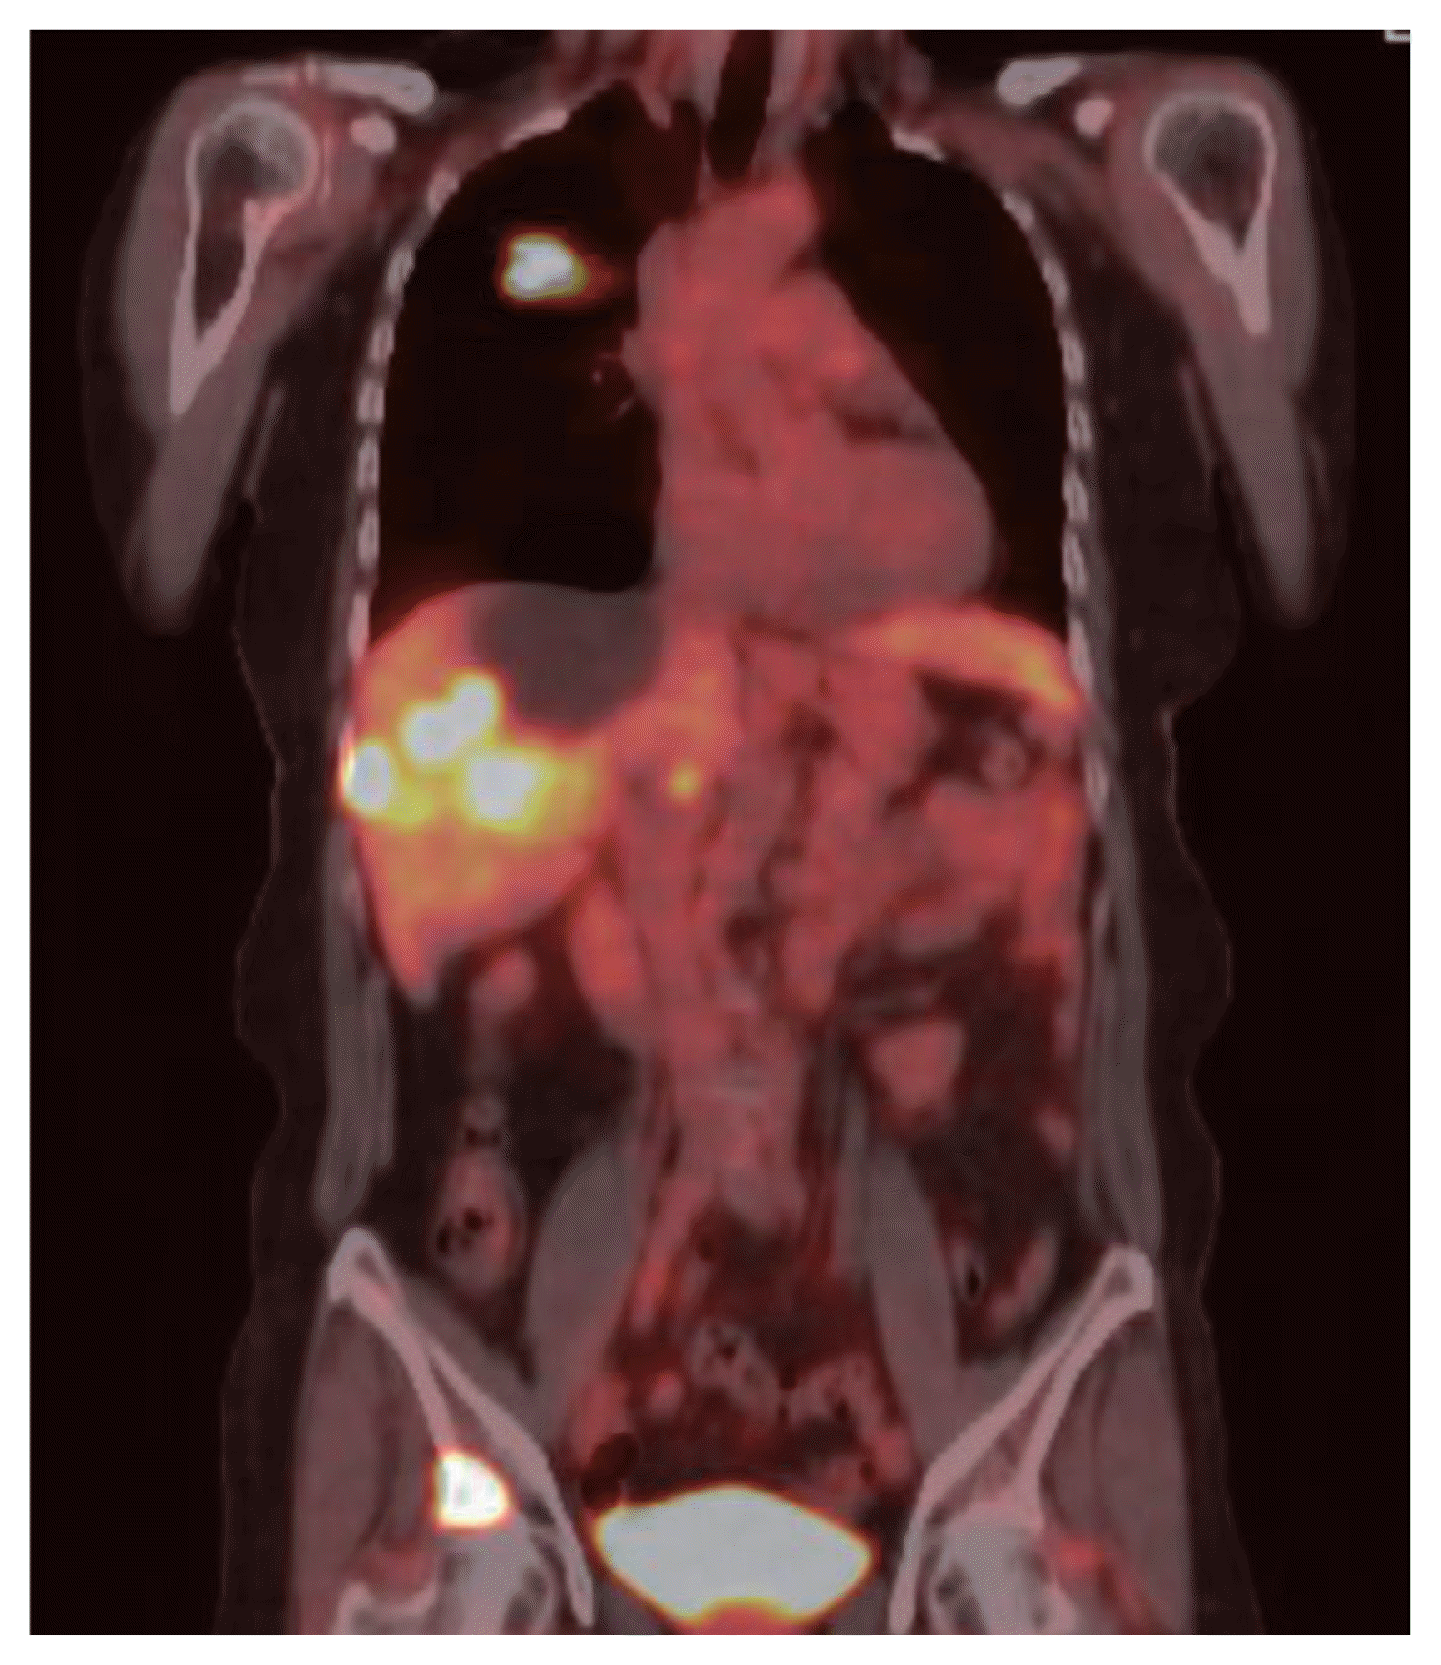
Multiphase contrast-enhanced CT of the abdomen revealed multinodular masses in both hepatic lobes measuring 6 cm in the greatest diameter and typical radiological features of HCC, arterial phase hyperenhancement, and washout during the portal venous and delayed phases. However, there was no evidence of cirrhosis (Fig. 1). Multiphase MRI of the liver, performed using a hepatobiliary contrast agent, revealed multiple lobulated masses in both hepatic lobes (Fig. 2). The tumor showed hyperenhancement during the arterial phase and washout during the portal venous, delayed, and hepatobiliary phases; these are consistent with the imaging hallmarks of HCC. However, the tumor demonstrated high signal intensity on fat-suppressed T1-weighted images, which was suggestive of hemorrhage or melanin. Ultrasonography (US)-guided percutaneous biopsy of the liver revealed malignant cells consistent with malignant melanoma (Fig. 3). 18F-fluorodeoxyglucose (FDG) positron emission tomography and CT (PET-CT) revealed hypermetabolic lesions in the liver, right upper lobe of the lung, and right pelvic bone (Fig. 4).
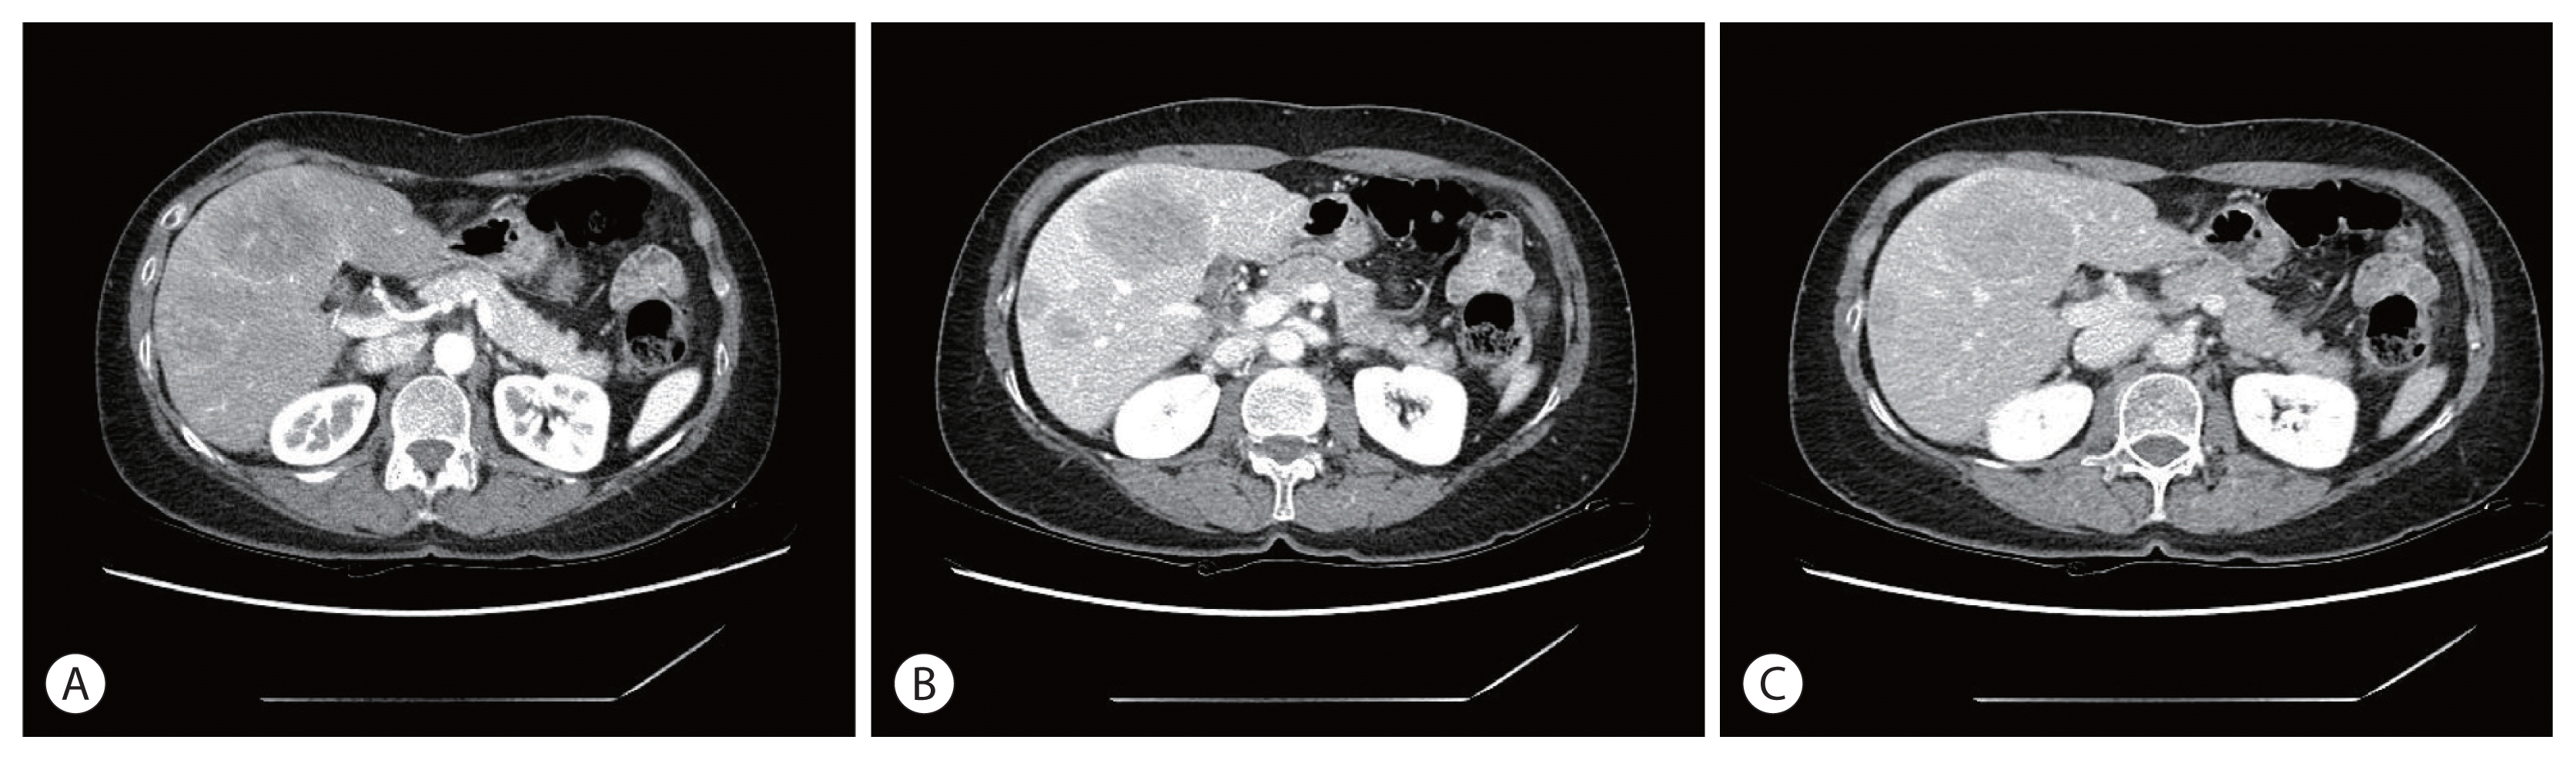 | Figure 1Liver dynamic computed tomography image findings. Multinodular liver masses measuring 6 cm in the greatest diameter in both hepatic lobes show heterogeneous enhancement during the arterial phase (A) and washout during the portal venous and delayed phases (B, C).
|
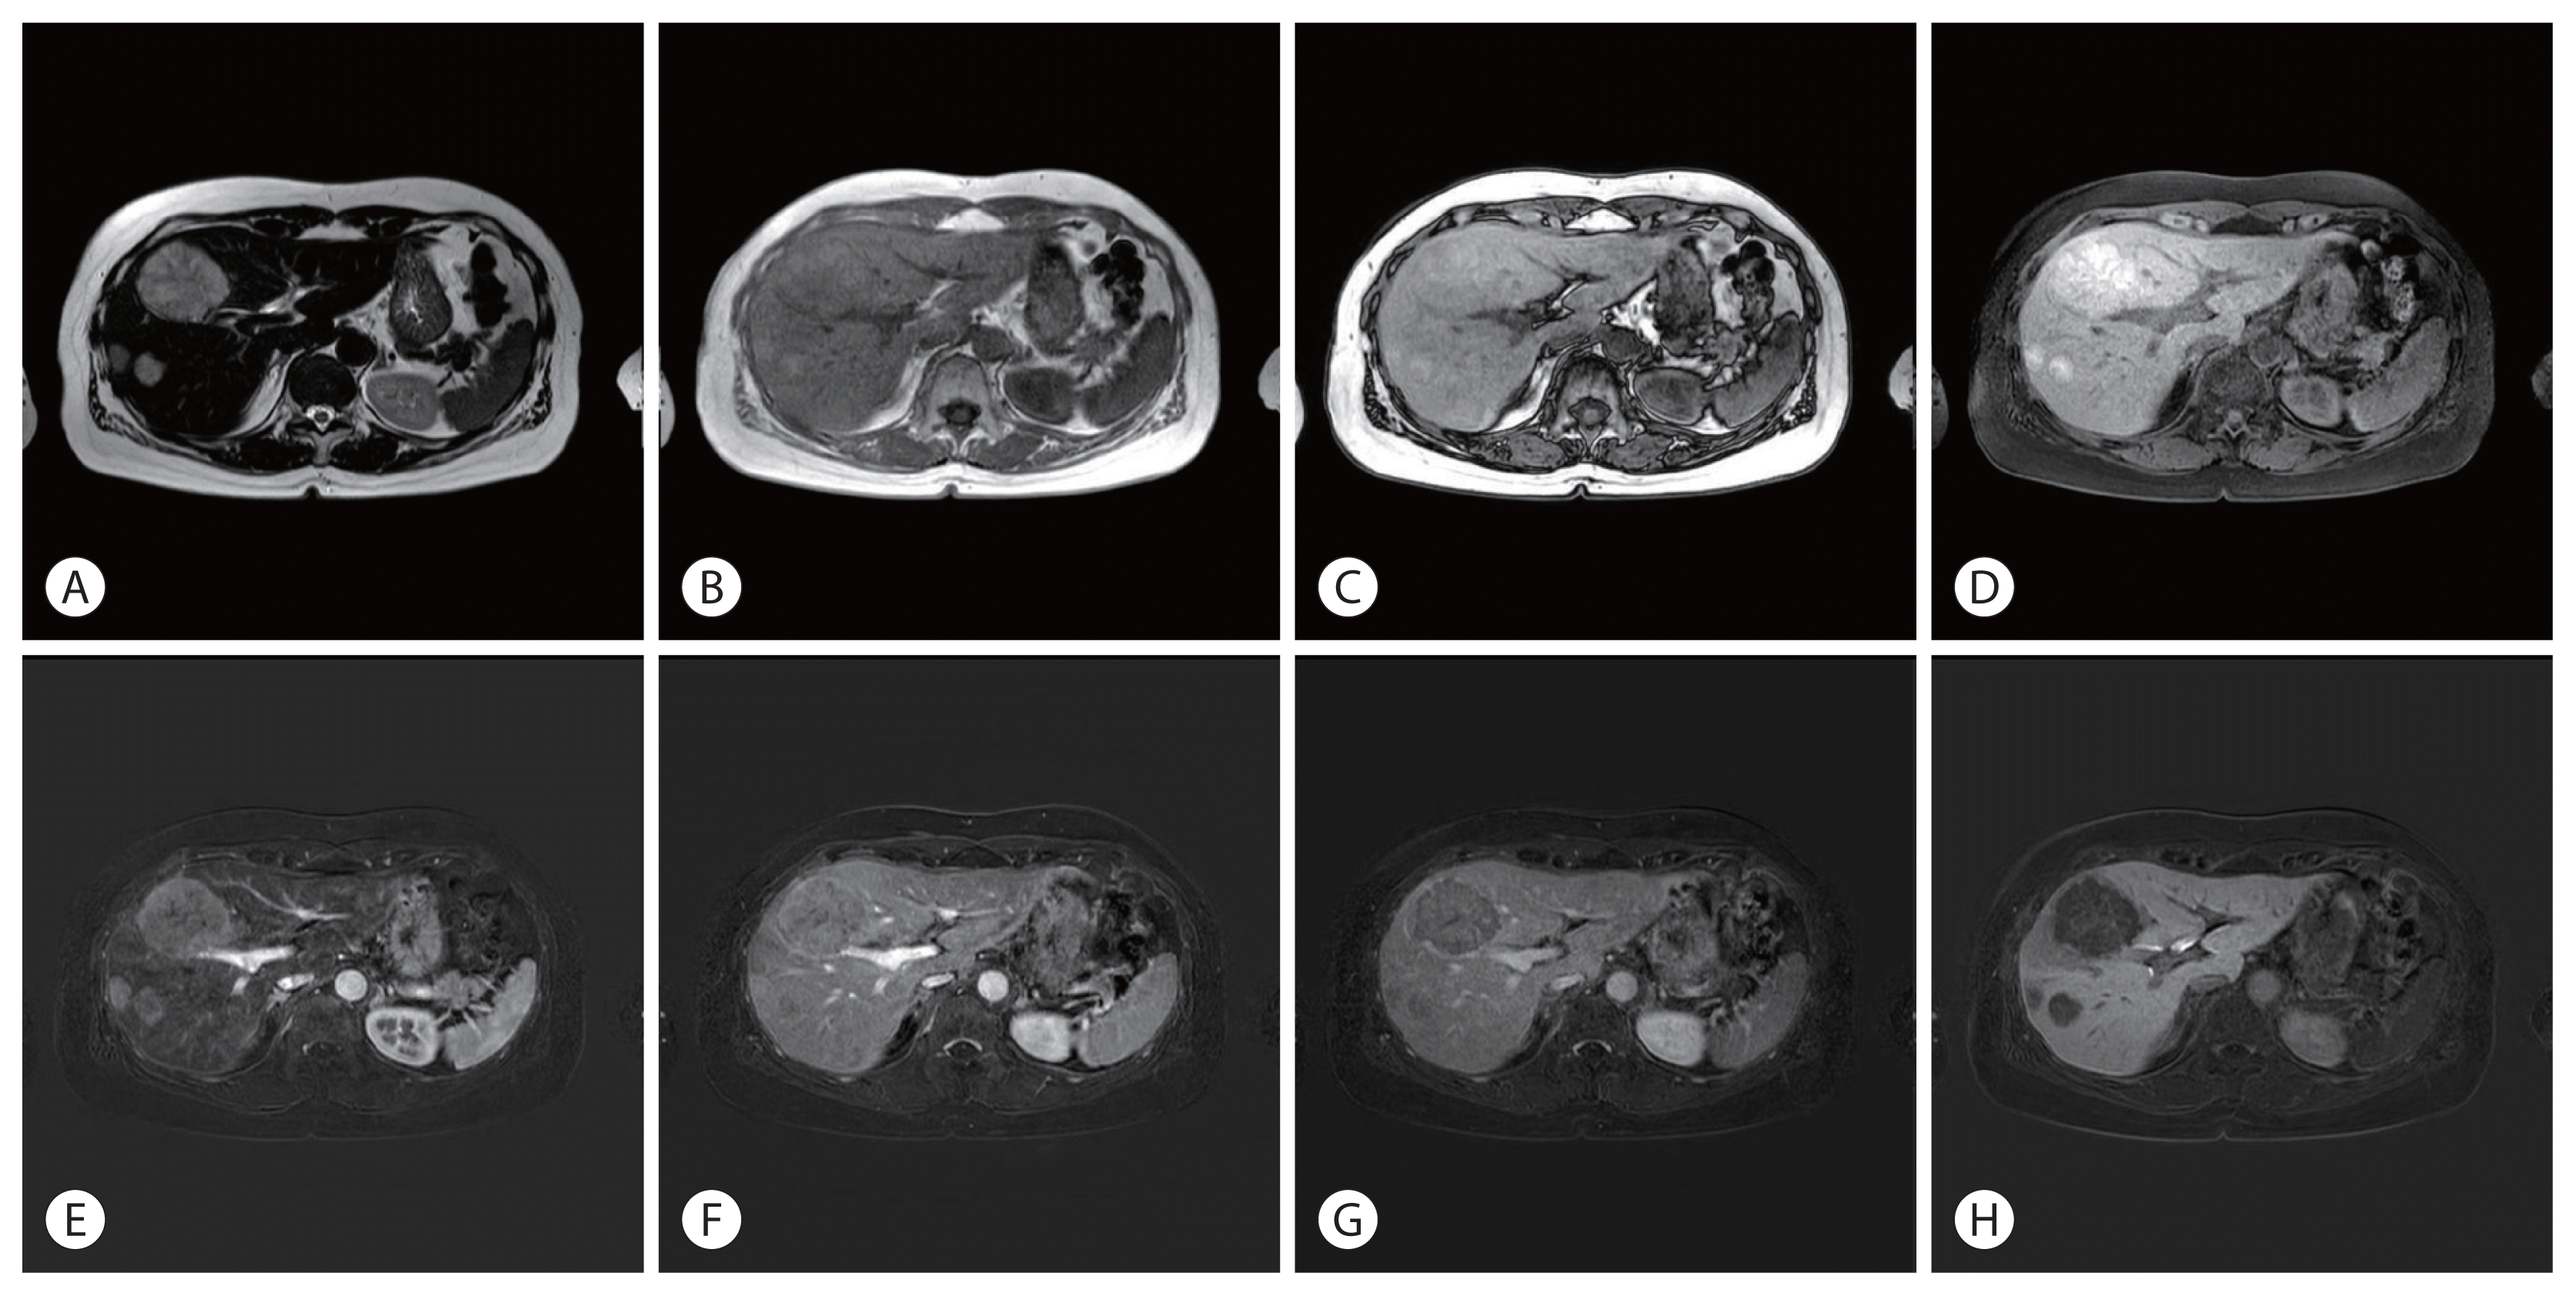 | Figure 2Liver dynamic magnetic resonance imaging image findings. Multiple liver masses show hyperintensity on T2-weighted images (A), isointensity on T1-weighted in-phase and out-of-phase images (B, C). Fat suppression increases the conspicuity of the lesion. A fat-suppressed T1-weighted image shows high signal intensity (D), a finding that suggests hemorrhage or melanin. Dynamic images after the administration of contrast agents show hyperintensity during the arterial phase (E), isointensity during the portal venous phase (F), and hypointensity during the delayed phase (G) and hepatobiliary phase (H).
|
3. Diagnosis and treatment progress
She was diagnosed with a recurrence of malignant melanoma involving the liver, lung, and bone. Molecular testing of BRAF mutations using polymerase chain reaction confirmed BRAF wild-type melanoma. Finally, treatment with pembrolizumab was initiated. PET-CT after 3 cycles of chemotherapy showed a partial response, and the patient is currently continuing the same treatment.
Go to :
DISCUSSION
HCC is the most common primary malignant tumor of the liver, and it usually occurs in patients with chronic liver diseases, such as chronic hepatitis B, chronic hepatitis C, and liver cirrhosis. HCC can be diagnosed either pathologically with biopsy or with noninvasive imaging in patients with risk factors. In clinical practice, HCC is often accompanied by underlying liver cirrhosis, and biopsy is often difficult to perform because of poor liver function (presence of ascites, risk of bleeding), concerns for needle track seeding, and challenges in tumor targeting. Thus, most patients with HCC are diagnosed based on noninvasive imaging findings. In at-risk patients (chronic hepatitis B, chronic hepatitis C, and liver cirrhosis) with nodules larger than or equal to 1 cm, HCC can be diagnosed based on typical imaging hallmarks, including hyperenhancement during the arterial phase and washout during the portal venous and delayed phases on multiphase contrast-enhanced CT or MRI.1 A recent meta-analysis of the diagnostic performance of CT and MRI showed sensitivities of 76% for CT and 83% for MRI, with specificities of 91% for CT and 89% for MRI.5 The diagnostic accuracies of CT and MRI vary with the size of HCC, and MRI provides better sensitivity than CT for small HCCs (sensitivity of 48% and 62% for CT and MRI in tumors smaller than 20 mm vs. 92% and 95% for CT and MRI in tumors larger than 20 mm).6 Therefore, if a patient without clinical risk factors of HCC has inconclusive imaging findings on CT and MRI, a biopsy of the liver mass for pathologic confirmation is necessary.
The liver is one of the most common sites of metastasis. The most frequent primary origins of liver metastases are the lung, colorectal, pancreas, stomach, and breast.7 Metastatic liver cancers are usually multiple, and their radiologic findings vary with their origin. Most metastatic liver cancers are hypovascular and show decreased enhancement during the arterial phase, becoming more prominent during the delayed phases. On the other hand, some hypervascular metastases arising from hypervascular primary tumors, such as melanoma, neuroendocrine tumor, renal cell carcinoma, and thyroid carcinoma, may show early enhancement during the arterial phase and washout during the delayed phases.
Signal intensity patterns on unenhanced images of most HCCs generally exhibit hypointensity on T1-weighted images and hyperintensity on T2-weighted images. Some HCCs with fat or hemorrhage may be hyperintense on T1-weighted images. Hypervascular metastases vary but generally exhibit hypointensity on T1-weighted images and hyperintensity on T2-weighted images. However, some metastases that contain hemorrhage, fat, mucin, or melanin may have hyperintensity on T1-weighted images.2–4
As mentioned above, the imaging features of hypervascular metastases overlap with those of HCCs. Therefore, clinical factors, such as the absence of chronic liver disease, normal tumor markers, and a history of primary extrahepatic malignancy, suggesting metastatic tumors are more important.
Malignant melanoma is a malignant tumor originating from melanocytes of the skin and other organs with a high potential for metastases and a high mortality rate. It is a rare disease in Asian countries, but its incidence has been increasing in Korea.8 Malignant melanoma may involve any organ, and it commonly metastasizes to the lymph nodes, lungs, liver, brain, or bone.9 The median overall survival for patients with distant metastases is reported to be 7–8 months.10 The current treatments for patients with metastatic or unresectable disease include immunotherapy (such as pembrolizumab, nivolumab, nivolumab, and ipilimumab) and combined targeted therapy (such as vemurafenib with cobimetinib) for BRAF V600-mutated melanoma.11
In this report, we present a case of liver metastasis of a malignant melanoma mimicking HCC with a similar enhancement pattern on dynamic contrast imaging. At the time of diagnosis, the patient had no underlying liver disease and was not drinking alcohol. The results of the tumor markers were also normal, so she had no clinical risk factors for HCC. On the other hand, she had a history of malignant melanoma, and the tumor showed high signal intensity on T1-weighted images, a characteristic feature of malignant melanoma due to the presence of melanin. We needed to differentiate between HCC and metastatic liver cancer. Therefore, we performed a histological examination using a percutaneous liver biopsy and confirmed the recurrence of malignant melanoma in the liver.
As in this case, recurrence after a long period is often reported even if the patient achieves complete remission of the primary cancer. Therefore, metastatic liver cancer should be considered as a differential diagnosis if the patient has a history of other primary malignancies. In particular, we need to be cautious of hypervascular cancers that may mimic HCC. Biopsy of the liver mass should be considered for the differential diagnoses of other hypervascular tumors in patients with a history of other primary malignancies without underlying chronic liver disease.
Go to :
 XML Download