Abstract
Background/Aims
Methods
Results
ACKNOWLEDGMENT
Notes
AUTHORSHIP STATEMENT
1) Jeong-Hoon Lee takes responsibility for the integrity of the work as a whole, from inception to published article.
-
2) Specific author contributions
Conception: Jun Sik Yoon, Han Ah Lee, and Jeong-Hoon Lee; study design: Jun Sik Yoon, Han Ah Lee, and Jeong- Hoon Lee; participation in patient management and data collection: Jun Sik Yoon, Han Ah Lee, Hwi Young Kim, Dong Hyun Sinn, Dong Ho Lee, Ju-Yeon Cho, Jonggi Choi, Young Chang, Suk Kyun Hong, Hyun-Joo Kong, Young-Joo Won, Eunyang Kim, and Jeong-Hoon Lee; contribution to the data acquisition, responsibility for writing the paper, and statistical analysis: Jun Sik Yoon, Han Ah Lee, and Jeong-Hoon Lee 3) All authors have reviewed the paper and approved the final version.
REFERENCES
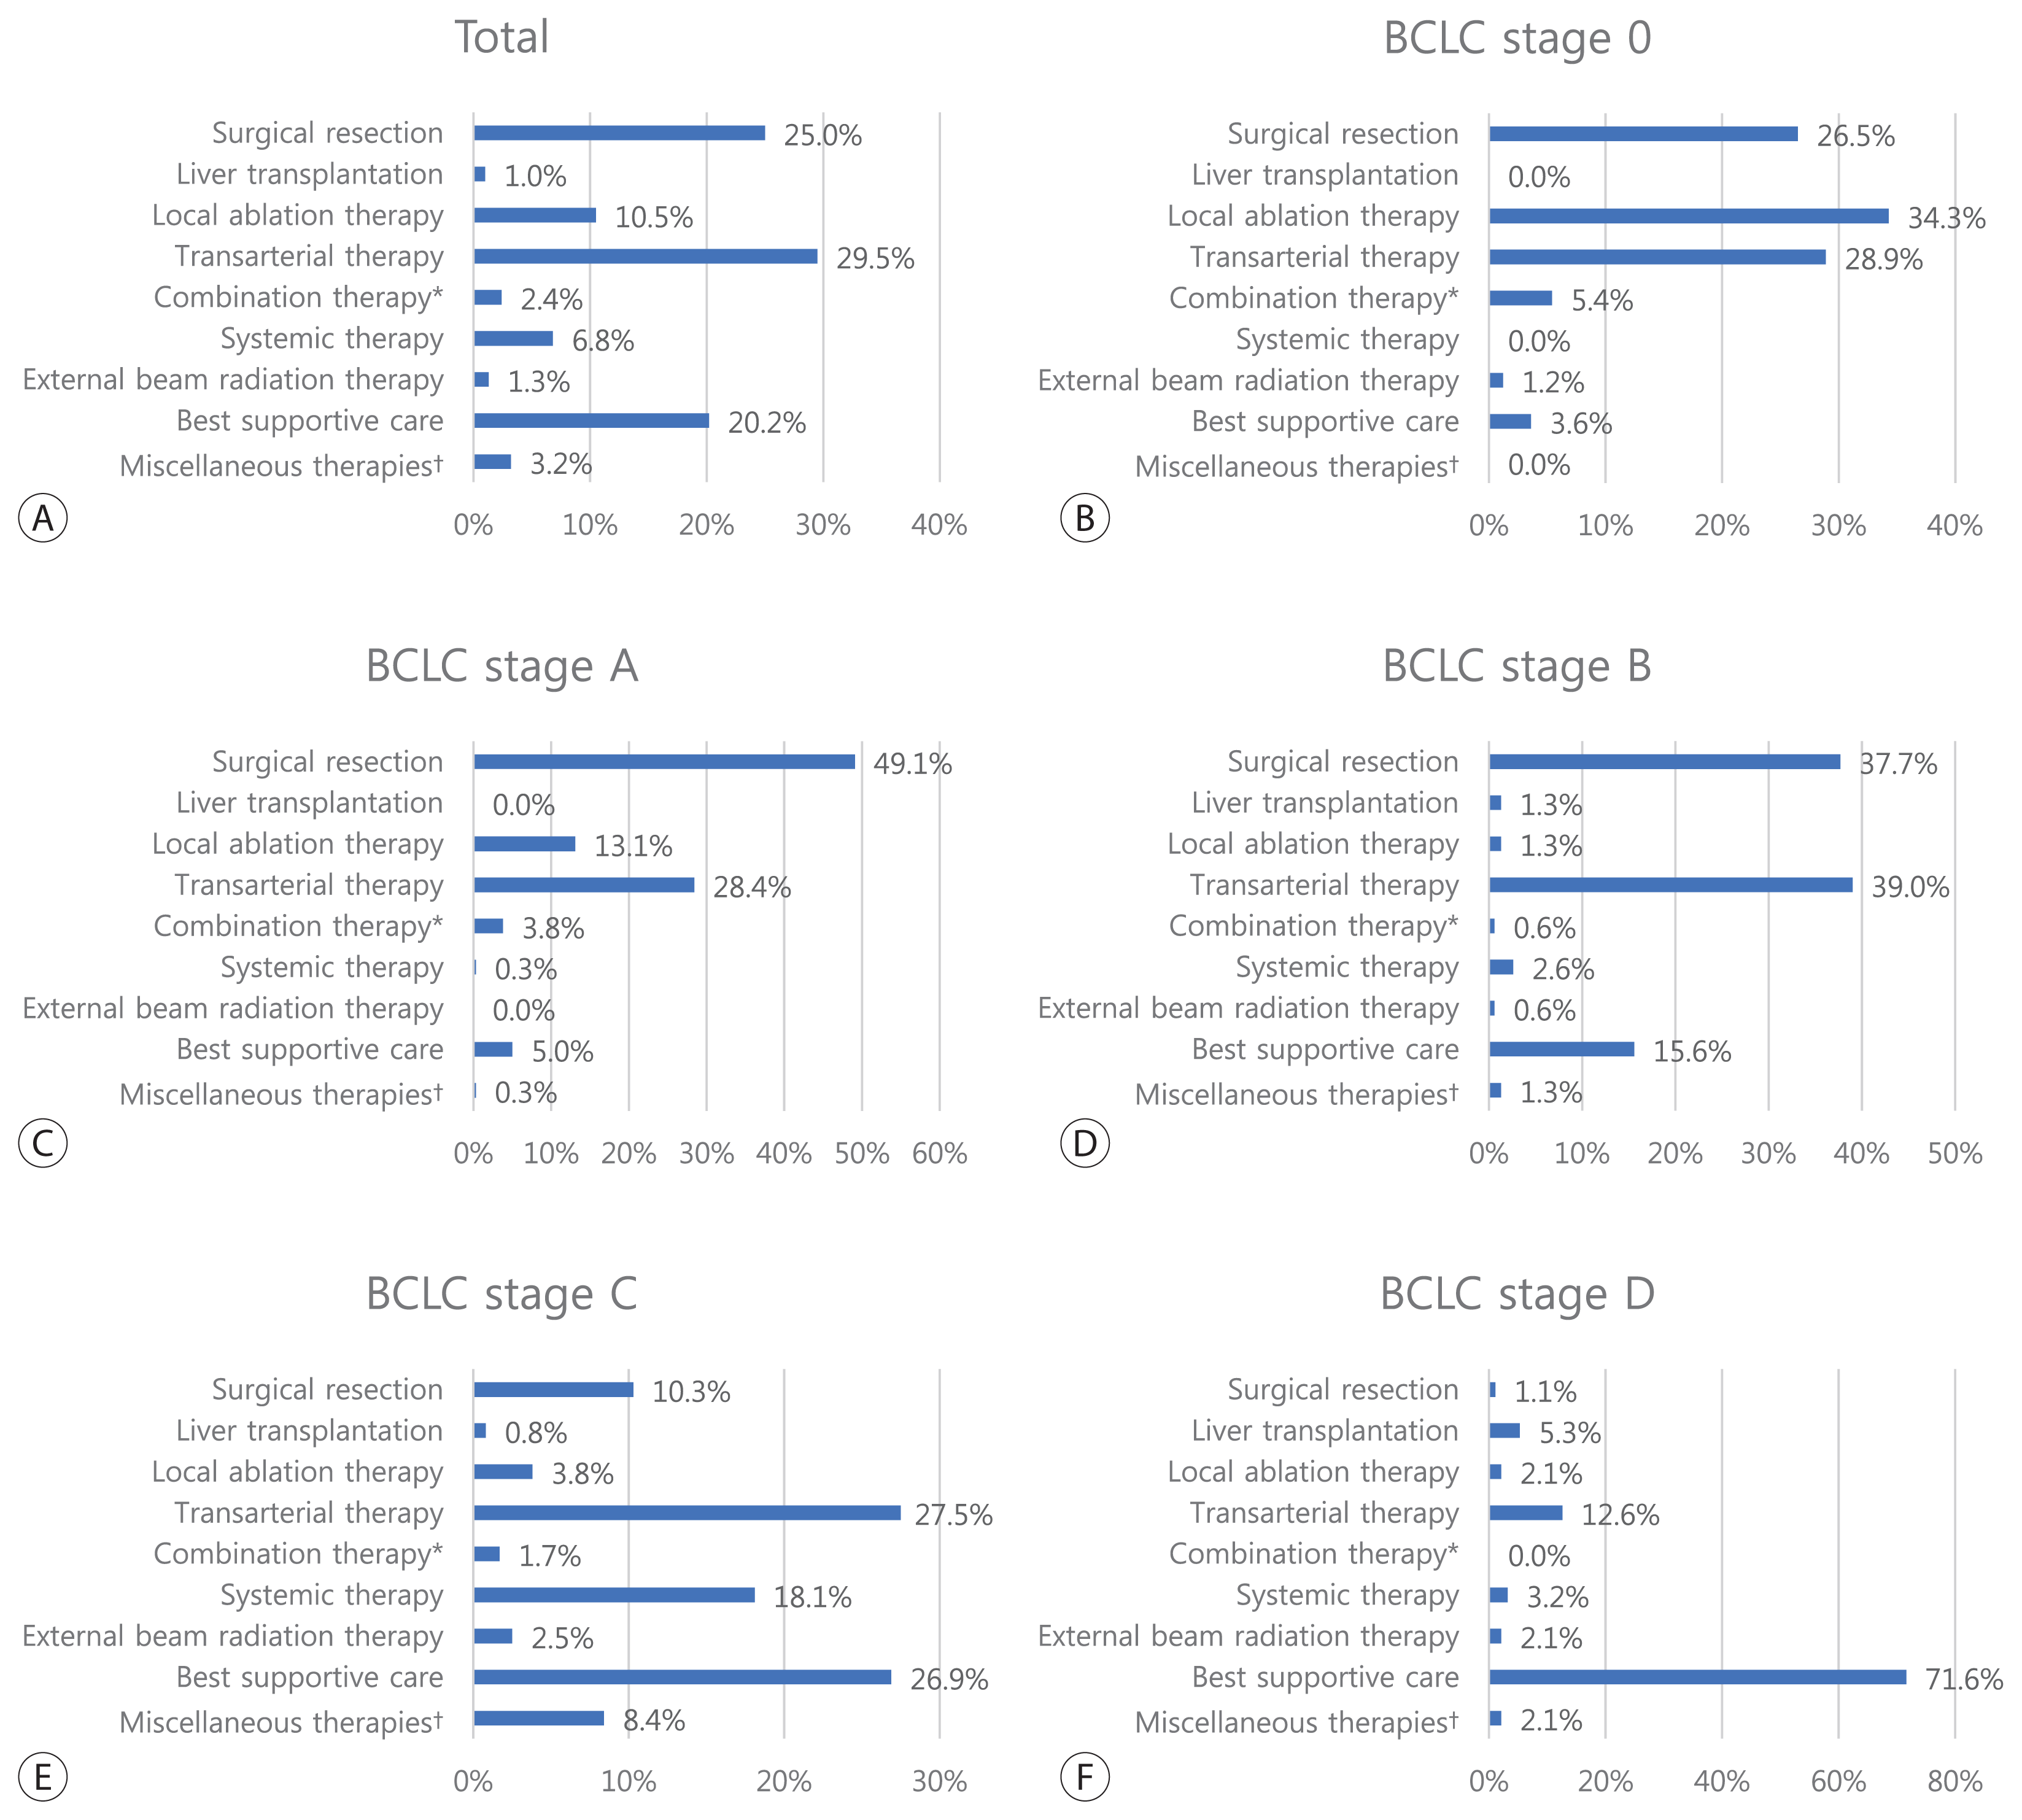
Figure 1

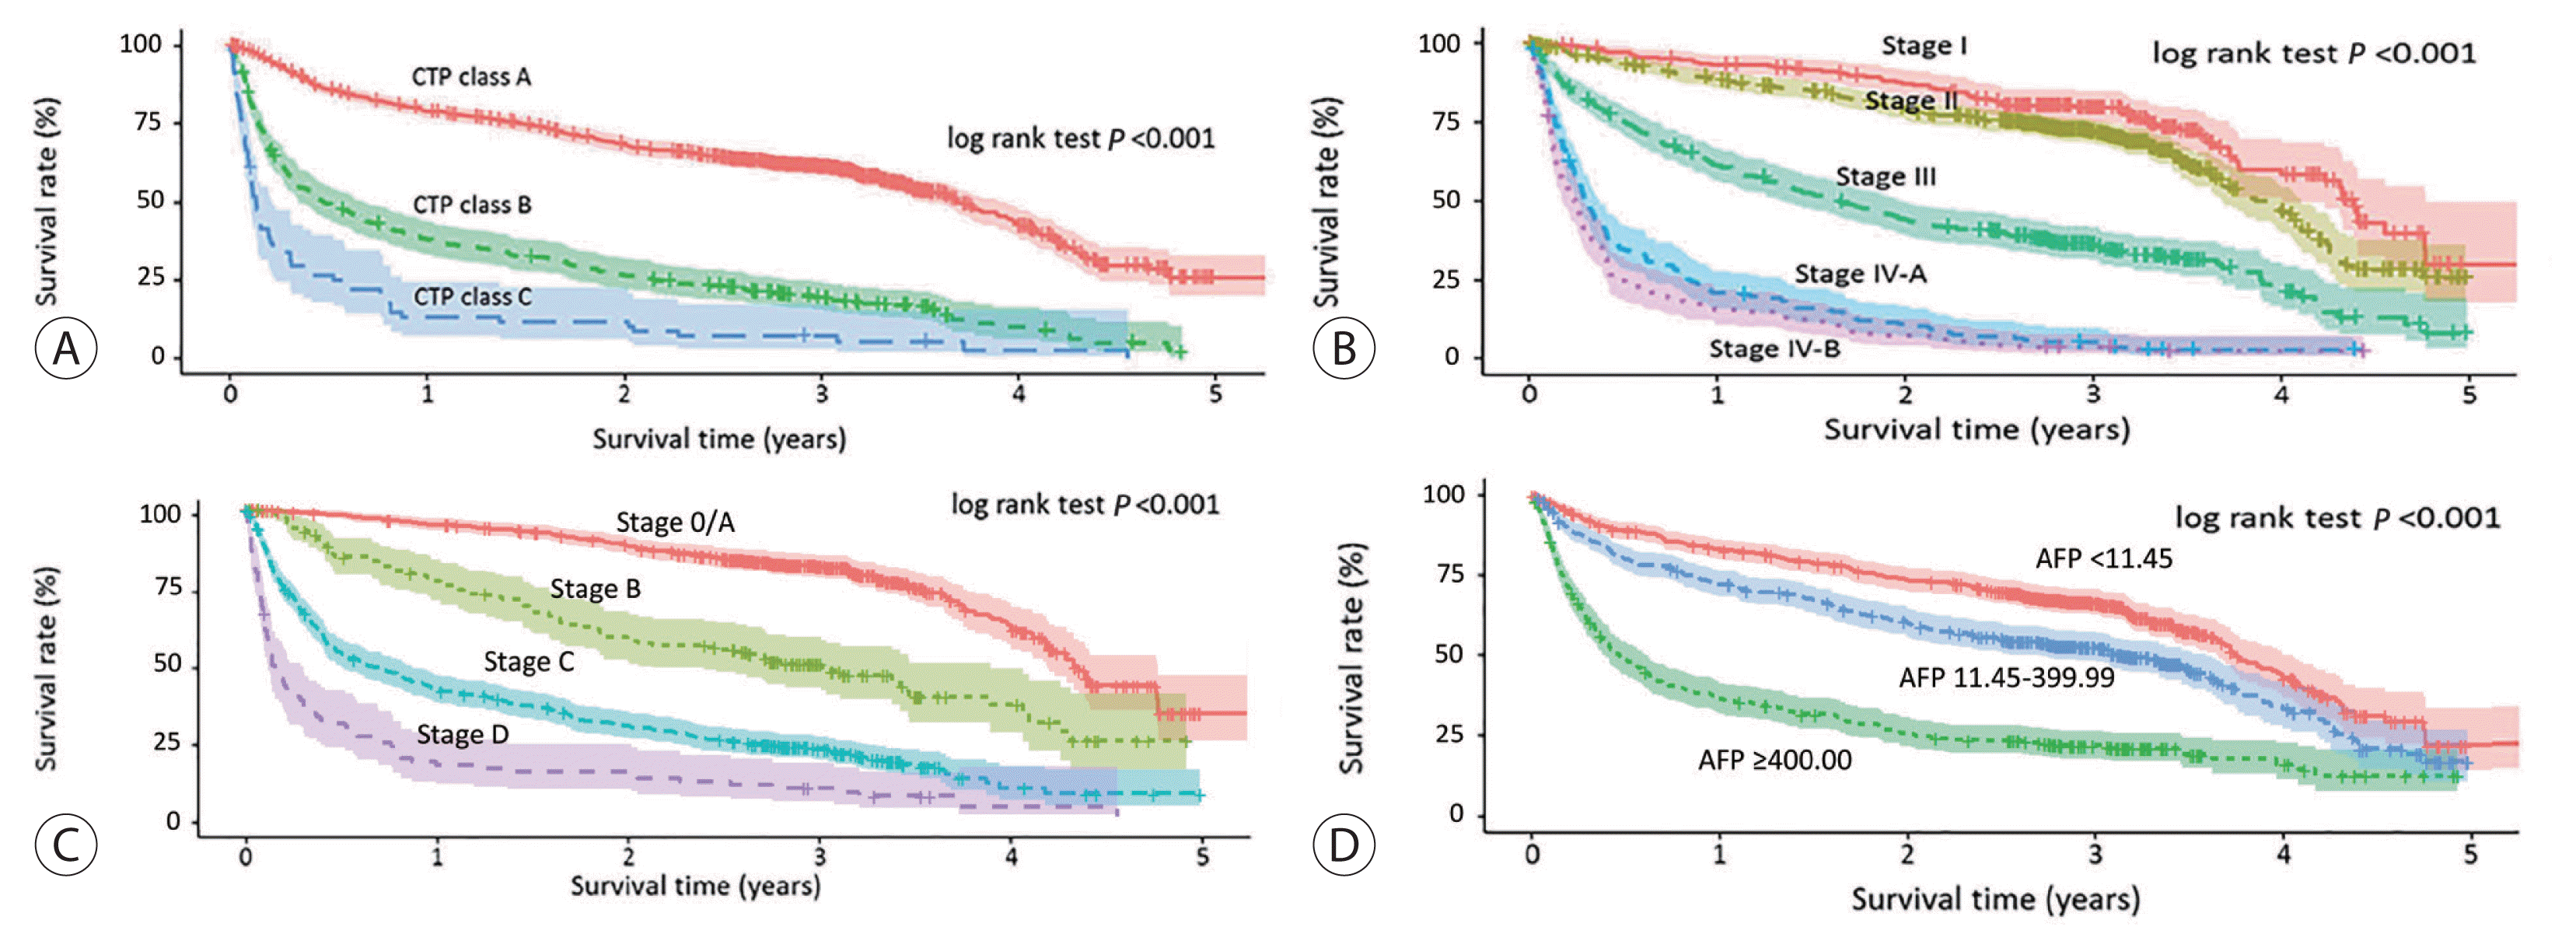
Figure 3

Table 1
| Variable | Value |
|---|---|
| Demographic variable | |
| Age (years) | 61.0 (54.0–70.0) |
| Sex (male) | 1,241 (79.7) |
| Diabetes | 443 (28.4) |
| Hypertension | 591 (37.9) |
| Body mass index (kg/m2) | 23.8 (21.6–26.0) |
| Smoking | 672 (43.1) |
| Etiology | |
| HBV* | 905 (58.1) |
| HCV | 127 (8.2) |
| Alcohol | 261 (16.8) |
| Others | 265 (17.0) |
|
|
|
| Performance status† | (n=1,150, missing=408) |
| 0 | 848 (73.7) |
| 1 | 204 (17.7) |
| 2 | 64 (5.6) |
| 3 | 21 (1.8) |
| 4 | 13 (1.1) |
|
|
|
| Ascites | |
|
|
|
| None | 1,211 (77.7) |
| Mild | 215 (13.8) |
| Moderate to severe | 132 (8.5) |
|
|
|
| Encephalopathy | (n=1,556, missing=2) |
| None | 1,518 (97.6) |
| Mild to moderate (grade 1 or 2) | 28 (1.8) |
| Severe (grade 3 or 4) | 10 (0.6) |
|
|
|
| Laboratory variable | |
| Total bilirubin (mg/dL) | 0.9 (0.6–1.4) |
| Serum albumin (g/dL) | 3.9 (3.4–4.3) |
| Alanine aminotransferase (IU/L) | 35.0 (23.0–57.0) |
| Platelet count (109/L) | 155.0 (107.0–208.5) |
| Prothrombin time (INR) | 1.09 (1.03–1.19) |
| Creatinine (mg/dL) | 0.86 (0.73–1.00) |
| Sodium (mmol/L) | 139 (137–141) |
| Glucose (mg/dL) | 100 (71–127) |
| Total cholesterol (mg/dL) | 154 (130–186) |
| Child-Turcotte-Pugh class | (n=1,499, missing=59) |
| A | 1,098 (73.2) |
| B | 332 (22.2) |
| C | 69 (4.6) |
Values are presented as median (interquartile range) or number (%). HBV, hepatitis B virus; HCV, hepatitis C virus; INR, international normalized ratio; MELD, Model for End stage Liver Disease; PIVKA-II, protein induced by vitamin K absence-II; UICC, Union for International Cancer Control; BCLC, Barcelona Clinic Liver Cancer.
Table 2
| Treatment modality | Value |
|---|---|
| Surgical resection | 379 (25.1) |
|
|
|
| Liver transplantation | 15 (1.0) |
|
|
|
| Local ablation therapy | 160 (10.5) |
| Radiofrequency ablation | 156 |
| Percutaneous ethanol injection | 1 |
| Other local ablation | 3 |
|
|
|
| Transarterial therapy | 448 (29.5) |
| Conventional TACE | 364 |
| TACE with drug-eluting beads | 14 |
| Radioembolization | 62 |
| Hepatic arterial infusion chemotherapy | 8 |
|
|
|
| Combination therapy* | 37 (2.4) |
|
|
|
| Systemic therapy | 103 (6.8) |
| Sorafenib | 100 |
| Other systemic agents | 3 |
|
|
|
| External beam radiation therapy | 20 (1.3) |
|
|
|
| Best supportive care | 307 (20.2) |
|
|
|
| Miscellaneous therapies† | 49 (3.2) |
Table 3
| Variable | n (%) | Median OS (95% CI, months) | Year | ||||
|---|---|---|---|---|---|---|---|
|
|
|||||||
| 1 | 2 | 3 | 4 | 5 | |||
| All patients | 1,558 (100) | 33.1 (29.4–37.0) | 66.5 | 56.0 | 49.0 | 33.0 | 17.0 |
|
|
|||||||
| Age (years; n=1,558, missing values=0) | |||||||
| <40 | 34 (2.2) | NR | 72.7 | 59.5 | 54.5 | NR | NR |
| 40–49 | 178 (11.4) | 32.5 (21.0–44.0) | 59.2 | 52.5 | 46.4 | 34.1 | 27.3 |
| 50–59 | 473 (30.4) | 43.8 (39.5–48.1) | 68.4 | 61.3 | 56.8 | 44.2 | 28.6 |
| 60–69 | 440 (28.2) | 41.2 (34.9–47.4) | 71.2 | 62.0 | 53.6 | 37.1 | 14.9 |
| ≥70 | 443 (27.8) | 20.5 (17.2–24.0) | 62.3 | 45.5 | 36.8 | 18.1 | 5.4 |
|
|
|||||||
| Sex (n=1,558, missing values=0) | |||||||
| Male | 1,241 (79.7) | 31.6 (27.4–35.9) | 65.7 | 54.8 | 48.3 | 32.0 | 17.1 |
| Female | 317 (20.3) | 39.5 (31.8–47.2) | 69.7 | 60.8 | 52.1 | 37.2 | 15.9 |
|
|
|||||||
| Etiology (n=1,558, missing values=0) | |||||||
| HBV* | 905 (58.1) | 41.0 (36.2–45.8) | 68.2 | 59.2 | 54.3 | 41.2 | 26.0 |
| HCV | 127 (8.2) | 24.0 (17.8–30.2) | 67.2 | 50.1 | 36.8 | 29.3 | 20.5 |
| Alcohol | 261 (16.8) | 21.8 (17.0–26.6) | 60.5 | 47.5 | 39.2 | 15.4 | 0.0 |
| Others | 265 (17.0) | 31.0 (23.6–38.3) | 66.6 | 56.7 | 47.0 | 26.8 | 6.4 |
|
|
|||||||
| Child-Turcotte-Pugh classification (n=1,499, missing values=59) | |||||||
| A | 1,098 (73.3) | 44.4 (41.4–46.8) | 79.2 | 68.7 | 61.4 | 43.3 | 25.9 |
| B | 332 (22.1) | 5.8 (4.1–7.4) | 38.5 | 26.9 | 19.8 | 10.2 | 1.7 |
| C | 69 (4.6) | 1.6 (1.2–1.9) | 13.4 | 11.9 | 7.4 | 2.8 | 0.0 |
|
|
|||||||
| Alpha-fetoprotein (ng/mL; n=1,459, missing values=99) | |||||||
| <11.45 | 581 (39.9) | 45.2 (43.0–47.5) | 83.0 | 73.8 | 66.7 | 44.1 | 22.7 |
| 11.45–19.99 | 107 (7.3) | 44.0 (32.9–55.2) | 72.0 | 65.3 | 60.0 | 47.2 | 26.5 |
| 20.00–99.99 | 229 (15.7) | 41.5 (33.8–49.2) | 76.8 | 64.4 | 54.0 | 35.4 | 20.9 |
| 100.00–199.99 | 71 (4.9) | 24.0 (17.9–30.1) | 63.0 | 50.1 | 41.1 | 18.7 | 0.0 |
| 200.00–399.99 | 78 (5.3) | 37.0 (22.3–51.6) | 70.2 | 57.0 | 52.9 | 29.9 | 0.0 |
| ≥400.00 | 393 (26.9) | 5.6 (4.3–7.0) | 37.3 | 26.5 | 22.5 | 16.9 | 13.3 |
|
|
|||||||
| Modified UICC stage (n=1,544, missing values=14) | |||||||
| Stage I | 249 (16.1) | 52.6 (50.8–54.4) | 93.0 | 87.1 | 79.6 | 59.8 | 29.9 |
| Stage II | 592 (38.3) | 47.4 (44.5–50.4) | 88.5 | 79.4 | 71.9 | 46.6 | 26.0 |
| Stage III | 352 (22.8) | 19.8 (16.1–23.5) | 61.6 | 44.6 | 36.3 | 22.7 | 8.3 |
| Stage IV-A | 188 (12.2) | 3.8 (3.2–4.4) | 21.0 | 11.1 | 5.5 | 3.0 | NR |
| Stage IV-B | 163 (10.6) | 3.0 (2.3–3.7) | 15.5 | 7.4 | 3.7 | 2.5 | NR |
|
|
|||||||
| BCLC stage (n=1,242, missing=316) | |||||||
| 0 | 176 (14.2) | 52.9 (49.7–56.2) | 94.3 | 88.3 | 80.9 | 64.8 | 37.0 |
| A | 327 (26.3) | 50.3 (48.6–52.1) | 95.0 | 87.9 | 81.4 | 60.4 | 30.0 |
| B | 158 (12.7) | 33.8 (25.0–42.7) | 76.5 | 58.4 | 49.7 | 36.5 | 24.7 |
| C | 484 (39.0) | 7.4 (5.4–9.5) | 41.4 | 29.9 | 22.2 | 9.5 | 7.6 |
| D | 97 (7.8) | 1.7 (1.0–2.4) | 17.8 | 14.7 | 9.4 | 3.4 | 0.0 |
|
|
|||||||
| Initial treatment modalities (n=1,518, missing values=40) | |||||||
| Surgical resection | 379 (25.0) | NR | 94.3 | 89.3 | 85.3 | 71.7 | 55.0 |
| Liver transplantation | 15 (1.0) | NR | 86.7 | 80.0 | 72.0 | NR | NR |
| Local ablation therapy | 160 (10.5) | 48.8 (45.2–52.4) | 92.5 | 89.3 | 82.1 | 56.8 | 21.2 |
| Transarterial therapy | 448 (29.6) | 30.5 (25.4–35.5) | 76.1 | 58.1 | 45.4 | 25.7 | 11.9 |
| Combination therapy† | 37 (2.4) | 43.8 (40.8–46.8) | 97.2 | 83.2 | 80.1 | 39.6 | 0.0 |
| Systemic therapy | 103 (6.8) | 3.8 (3.0–4.7) | 15.5 | 4.9 | 2.9 | 1.9 | NR |
| External beam radiation therapy | 20 (1.3) | 4.6 (2.5–6.7) | 30.0 | 25.0 | 7.5 | NR | NR |
| Best supportive care | 307 (20.2) | 2.4 (2.0–2.8) | 18.6 | 10.6 | 8.4 | 3.0 | 0.8 |
| Miscellaneous therapies‡ | 49 (3.2) | 13.2 (6.2–20.2) | 51.0 | 30.6 | 22.4 | 0.0 | NR |
OS, overall survival; CI, confidence interval; NR, not reached; HBV, hepatitis B virus; HCV, hepatitis C virus; UICC, Union for International Cancer Control; BCLC, Barcelona Clinic Liver Cancer.


