Abstract
Background/Aims
Phosphatase and tensin homolog (PTEN) is a known tumor suppressor gene that is downregulated in hepatocellular carcinoma (HCC). Here, we investigated the association between single nucleotide polymorphisms (SNPs) of PTEN and HCC development in patients with hepatitis B virus (HBV) infection.
Methods
Six SNPs of PTEN at positions rs1234221, rs1903860, rs1234220, rs1903858, rs2299941, and rs17431184 were analyzed in a development population (417 chronic HBV carriers without HCC and 281 chronic HBV carriers with HCC). PTEN rs1903858, rs1903860, and rs2299941 SNPs were further assessed for the development of HCC in a validation population of 200 patients with HBV-related liver cirrhosis.
Results
In the development population, PTEN rs1903860 C allele, rs1903858 G allele, and rs2299941 G allele were associated with a low risk of HCC. The haplotype A-T-A-A-A was associated with an increased risk of HCC (recessive model; odds ratio=2.277, 95% confidence interval [CI] =1.144-4.532, P=0.019). In the validation population, PTEN rs2299941 G allele was the only significant protective genetic polymorphism related to HCC development after adjustment for age and sex (hazard ratio=0.582, 95% CI =0.353-0.962, P=0.035).
Hepatocellular carcinoma (HCC) is one of the most predominant malignancies worldwide. HCC is the fifth most common cancer in men, seventh most common in women, and third most common cause of cancer-related deaths globally [1]. Hepatitis B virus (HBV) infection is one of the most significant causes of HCC, and genetic alterations in HBV virus were reported to be associated with HCC development and characteristics [2,3]. However, further research on host genetic determinants is warranted for the development of HCC in patients with chronic HBV infection.
Phosphatase and tensin homolog (PTEN ) deleted on chromosome 10 is a well-known tumor suppressor in several cancer types. PTEN can dephosphorylate phosphoinositide 3-kinase, which in turn regulates protein kinase B Akt expression. This regulatory mechanism has downstream effects on transcription, proliferation, cell survival, invasiveness, and angiogenesis [4]. PTEN is also linked with several mechanisms related to the p53 tumor suppressor. Through p53 and other mechanisms, PTEN loss leads to genomic instability [5]. Any decrease in PTEN expression was shown to be correlated with increased tumor grade, advanced disease stage, and poor prognosis [6]. PTEN expression is reduced in nearly half of HCC cases either via mutation or methylation, which may further reduce its expression [6]. At the cellular level, PTEN is a target in the pathogenic pathway of hepatitis C virus core protein and HBV X protein [7,8].
Single nucleotide polymorphisms (SNPs) are one of the most commonly occurring forms of genetic variations in the human genome. Several SNPs in genes such as p53 and tumor necrosis factor-alpha as well as those related to Wnt/β-catenin pathway have been associated with the risk of HCC development [9-11]. However, the effects of PTEN polymorphism on HCC risk in patients with chronic HBV infection have been rarely reported [12]. In the present study, we evaluated the relationship between PTEN polymorphism and HCC risk in two independent chronic HBV infection population.
This study was conducted with two separate populations comprising chronic HBV carriers. To investigate the association between PTEN polymorphism and HCC, a total of 698 patients (development population, 417 chronic HBV carriers without HCC and 281 chronic HBV carriers with HCC) were enrolled in an observational case-control study. These patients had visited the outpatient clinics of the Gastroenterology Department of Ajou University Hospital between March 2002 and December 2008. Chronic HBV carriers were diagnosed as per the positive results for HBsAg and HBV DNA for more than 6 months. The multiphase computed tomography or magnetic resonance imaging of patients diagnosed with HCC showed key imaging features, including size ≥1 cm, arterial phase hyperenhancement, and depending on exact size, a combination of washout, threshold growth, and capsule appearance. Liver biopsy was performed for diagnosis in cases wherein these criteria were absent but HCC or other malignancy was considered probable [13]. In addition, to validate the association between PTEN SNPs and HCC development, we enrolled a retrospective population comprising 200 patients (validation population) with HBV-associated liver cirrhosis. Liver cirrhosis was defined with histological information or ultrasonographic findings associated with cirrhosis (spleen size, >12 cm; portal vein, >16 mm; nodules within the hepatic parenchyma) [14]. These patients had started 0.5 mg entecavir between September 2006 and November 2012 and received entecavir treatment for at least 6 months. Patients were monitored every 3 to 6 months for the development of HCC until February 2015. Patients that developed HCC within 6 months were excluded from the study. All investigations performed in the present study were conducted in accordance with the guidelines of the 1975 Declaration of Helsinki. Informed consent was obtained from all participants, and the study protocol was approved by the Institutional Review Board of Human Research of Ajou University Hospital (GN3-08-030).
Blood samples were stored at -80℃ until analysis. Genomic DNA was purified with G-DEXTM blood genomic DNA purification kit (Intron Biotechnology Inc., Seongnam, South Korea) and quantified using PicoGreen double-stranded DNA quantification reagent as per the standard protocol (Molecular Probes, Eugene, OR, USA). PicoGreen working solution was prepared (1:200 dilution) in Tris-EDTA buffer (pH 8.0). The λ DNA standard and samples were mixed with PicoGreen working solution and incubated at 25℃ for 5 minutes. Plates were read using Victor™ 3 multi-label counter (excitation 480 nm and emission 520 nm; PerkinElmer Inc., Waltham, MA, USA). A standard DNA concentration curve was generated using known λ DNA concentrations.
The validated SNPs in PTEN were identified using a public SNP database (http://www.ncbi.nlm.nih.gov/projects/SNP/). For the development population, we chose six SNPs with minor allele frequency ≥5% and r2≥0.8, as per the literature review. Thus, we analyzed the SNPs at six polymorphic sites, namely, positions rs1234221 (A to C substitution), rs1903860 (T to C substitution), rs1234220 (A to G substitution), rs1903858 (A to G substitution), rs2299941 (A to G substitution), and rs17431184 (T to C substitution) (Table 1). Genotyping was performed using GoldenGate genotyping assay kit according to standard protocols (Illumina Inc., San Diego, CA, USA) as previously described [15]. Signal intensities were extracted and analyzed using BEADSTUDIO software ver. 3.0.22 (Illumina Inc.). For the validation population, we selected three SNPs (rs1903860, rs1903858, and rs2299941) based on the results from the development population.
Statistical analysis was performed using IBM SPSS ver. 22.0 (IBM Corp., Armonk, NY, USA). Maintenance of Hardy–Weinberg equilibrium for each SNP was investigated to determine any deviation in genotype frequency using χ2 tests. Genetic models used in association testing were the co-dominant, dominant, and recessive models.
We analyzed the association between genotype and HCC presence using a multiple logistic regression model by controlling for covariates such as age and gender. In this analysis, chronic HBV carriers without HCC were regarded as the control group, while their analysis results were compared with those of HBV-associated patients with HCC. For the validation population, the association between HCC development and genotype was analyzed using multivariate Cox regression analysis.
The presence of a linkage disequilibrium (LD) block of SNPs was confirmed using HAPLOVIEW software (version 4.0; http://www.broad.mit.edu/mpg/haploview). Individual haplotypes were inferred using the EM algorithm with the SAS haplotype procedure. Haplotype analysis was performed using multiple logistic regression. All statistical tests were two-tailed and statistical significance was set at P <0.05. For more precise estimates, statistical computation was used to determine P values of Fisher’s exact test with Monte Carlo simulation (number of iteration=100,000).
Baseline demographic and clinical parameters of development population were shown as chronic HBV carriers without HCC and patients with HBV-associated HCC (Table 2). Patients with HCC were older than chronic HBV carriers without HCC, and men predominated both groups. Clinicopathologic characteristics that estimated the severity of cancer among the enrolled patients with HCC are depicted in Table 2. Serum levels of alpha-fetoprotein greater than 400 ng/mL were detected in approximately one-third of patients. In total, 108 patients (44.5%) had HCC larger than 5 cm in diameter, and 77 patients (31.8%) exhibited vascular invasion. About half of patients (54.2%) presented advanced tumor stage (modified Union for International Cancer Control stage III + IV).
Baseline characteristics of validation population are shown in Table 3. About one-third of the validation population was detected positive for hepatitis B e-antigen, and 20% patients had decompensated cirrhosis. In total, 41 patients from the validation population developed HCC during the course of entecavir therapy. The mean HCC size was 2.8±2.4 cm, while the mean number of HCC was 1.3±0.5.
The observed genotype frequencies of all six SNPs of PTEN in patients with HCC as well as chronic HBV carriers without HCC were in agreement with the Hardy–Weinberg equilibrium (P >0.05). These SNPs were analyzed for LD, and their haplotypes were constructed. From EM algorithm, four common haplotypes, namely, ht1 (A-C-A-G-G), ht2 (A-TA-A-A), ht3 (C-T-A-A-A), ht4 (A-T-G-G-A), and another rare haplotype (ht5) at rs1234221, rs1903860, rs1234220, rs1903858, and rs2299941 positions of PTEN were estimated. The values of LD coefficient (D') ranged from 0.859 to 1.000, and those of r2 ranged from 0.046 to 0.811. The most common haplotype was ht1 (A-C-A-G-G) (Fig. 1A). For the validation population, four common haplotypes T-A-A, C-G-G, T-G-A, and G-G-A at rs1903860, rs1903858, and rs2299941 positions were estimated. The values of (D') ranged from 0.986 to 1.000, while those of r2 ranged from 0.553 to 0.833 (Fig. 1B).
The relationship between development of HCC and genotype/haplotype frequencies of the six SNPs in PTEN was investigated among chronic HBV carriers (Table 4). PTEN rs1903860 C allele was associated with decreased risk of HCC development (odds ratio [OR]=0.829, 95% confidence interval [CI]=0.428-0.980, P =0.040) in the co-dominant model. PTEN rs1903858 G allele was associated with decreased risk of HCC development in the co-dominant and recessive model (OR=0.534, 95% CI=0.342-0.833, P =0.006 and OR=0.613, 95% CI=0.406-0.927, P =0.020, respectively). An association was also reported between PTEN rs2299941 G allele and decreased risk of HCC development in the co-dominant model (OR=0.658, 95% CI=0.436-0.992, P =0.045). Ht2 (A-T-A-A-A) was associated with increased risk of HCC (OR=2.277, 95% CI=1.144-4.532, P =0.019).
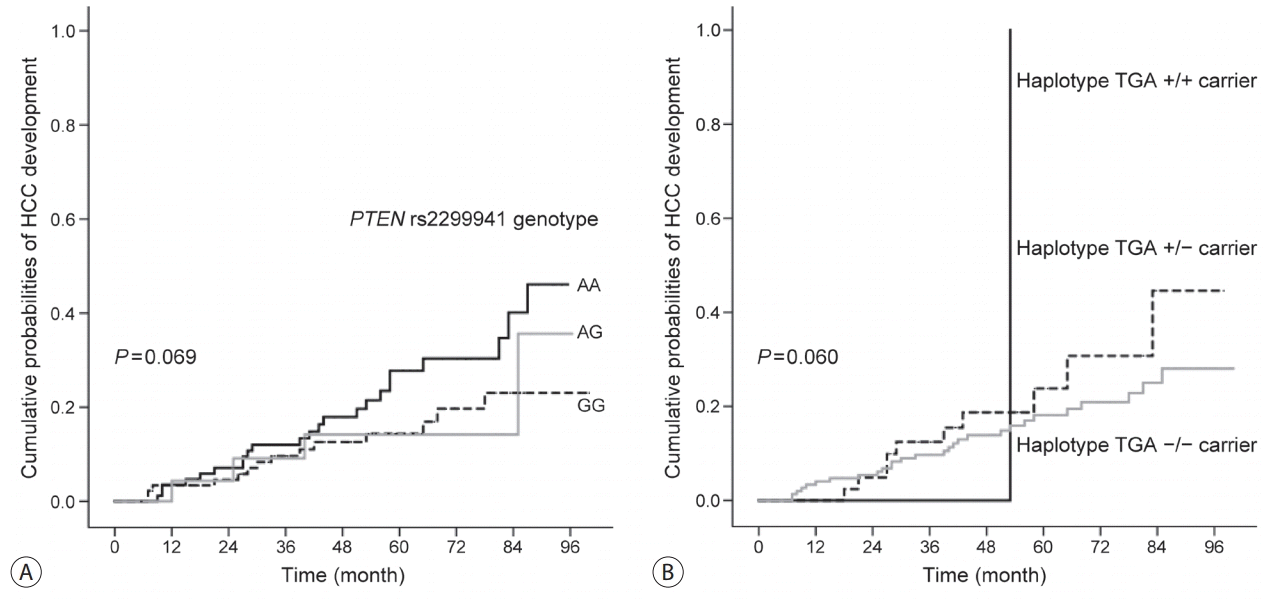
We evaluated the relationship between PTEN rs1903860, rs1903858, and rs2299941 genotypes/haplotypes and HCC development using the validation population including patients with HBV-related liver cirrhosis. Among 200 patients, 41 (20.5%) developed HCC during the follow-up period (median, 58.8 months; range, 6-100 months). One SNP and one haplotype were associated with low risk of HCC development (Table 5). Kaplan-Meier survival estimates revealed the association between patients with PTEN rs2299941 G allele and low risk of HCC development (P =0.069, Fig. 2). Furthermore, multivariate analysis showed that patients with rs2299941 AG or GG genotype exhibited a lower risk of HCC development than those with AA genotype (hazard ratio [HR]=0.582, 95% CI=0.353-0.962, P =0.035). The haplotype containing rs2299941 A allele (haplotype TGA) was also associated with increased risk of HCC development in the multivariate recessive model (HR=8.969, 95% CI=1.146-70.188, P =0.037). However, the number TGA homozygote carriers was too small (only one).
In the present study, we evaluated the germline polymorphism of PTEN for the prediction of HCC development in patients with chronic HBV infection. In the development population, PTEN rs1903860, rs1903858, and rs2299941 SNPs were associated with the low risk of HCC development. Further validation of these three SNPs in the HBV-associated LC population revealed PTEN rs2299941 G allele as the only protective genetic polymorphism for HCC development in Cox regression analysis after adjustment for age and sex. Previous studies carried out in the Chinese population had not described PTEN rs2299941 SNP as a genetic locus associated with cancer, especially HCC [12,16].
PTEN encodes phosphatidylinositol-3,4,5-trisphosphate 3-phosphatase, which contains a tensin-like domain and a catalytic domain similar to that of dual-specificity protein tyrosine phosphatases. Unlike most protein tyrosine phosphatases, PTEN preferentially dephosphorylates phosphoinositide substrates. Furthermore, it negatively regulates intracellular phosphatidylinositol-3,4,5-trisphosphate levels and functions as a tumor suppressor by negatively regulating the Akt signaling pathway [5,17-19]. Previous studies have reported the lower expression of PTEN mRNA and protein in HCC tissues than in the adjacent non-tumor tissues [20-22]. Furthermore, PTEN expression has been related to tumor aggressiveness characteristics such as pathologic grading, presence of cancer thrombus, lymph node metastasis, and prognosis in patients with HCC [20,21]. However, only a few studies have been conducted on PTEN polymorphism and HCC. In the present study, we evaluated the novel SNPs of PTEN gene in HCC for the first time. PTEN rs2299941 SNP was the only significant genetic polymorphism associated with HCC development in both development and validation groups and was previously assessed in patients with prostate or endometrial cancer by other researchers. However, these studies failed to reveal any association between PTEN polymorphism and cancer [23,24]. Therefore, the present study is the first report to demonstrate the relationship between PTEN rs2299941 polymorphism and cancer.
Our study has some limitations. We failed to demonstrate the direct function of PTEN rs2299941 SNP in HCC carcinogenesis. In fact, rs2299941 SNP is located within an intron and does not directly alter the protein-coding sequence of PTEN . However, the majority of reports on disease-associated mutations describing the variants that directly alter the protein-coding sequence of a gene failed to consider other mechanisms involved in gene function alterations. In cases where mutations are not found, polymorphism that resides outside of the coding region may be often overlooked. Such mechanisms include alteration in gene regulation via disruption of trans -acting factor(s) and cis-acting sequence-element interactions and may result in a pathologic state. A previous study with haplotype-based approaches reported a significant association between PTEN SNPs, including rs2299941, and Cowden and Bannayan-Riley-Ruvalcaba syndromes [25]. Here, we validated the predictive ability of PTEN SNPs in a population of HBV-related liver cirrhosis. The majority of previous studies on disease-associated mutations are based on case-control study design. The present study initially evaluated six candidate PTEN SNPs in a case-control study design and then validated three PTEN SNPs in a retrospective cohort population. This is an important feature of the current study as compared to previous studies on gene polymorphism and cancer.
In conclusion, our findings demonstrate the association between genetic polymorphism in PTEN and HCC development in patients with chronic HBV infection. These results suggest the role of host genetic factors in influencing the occurrence of HBV-associated HCC.
ACKNOWLEDGMENTS
This study was supported in part by the Scientific Research Fund of the Korean Liver Cancer Study Group (2017). This research was supported by a grant of the Korea Health Technology R&D Project through the Korea Health Industry Development Institute (KHIDI), funded by the Ministry of Health & Welfare, Republic of Korea (grant number: HI16C2011 & HI18C0531). The biospecimens and data used for this study were provided by the Biobank of Ajou University Hospital, a member of Korea Biobank Network.
REFERENCES
1. Bosetti C, Turati F, La Vecchia C. Hepatocellular carcinoma epidemiology. Best Pract Res Clin Gastroenterol. 2014; 28:753–770.
2. Lyu H, Lee D, Chung YH, Kim JA, Lee JH, Jin YJ, et al. Synergistic effects of A1896, T1653 and T1762/A1764 mutations in genotype c2 hepatitis B virus on development of hepatocellular carcinoma. J Viral Hepat. 2013; 20:219–224.
3. Mathews P, Lee D, Chung YH, Kim JA, Lee JH, Jin YJ, et al. Effects of genomic changes in hepatitis B virus on postoperative recurrence and survival in patients with hepatocellular carcinoma. Ann Surg Oncol. 2013; 20:1216–1222.
4. Jiang BH, Liu LZ. PI3K/PTEN signaling in tumorigenesis and angiogenesis. Biochim Biophys Acta. 2008; 1784:150–158.
5. Li L, Ross AH. Why is PTEN an important tumor suppressor? J Cell Biochem. 2007; 102:1368–1374.
6. Wang L, Wang WL, Zhang Y, Guo SP, Zhang J, Li QL. Epigenetic and genetic alterations of PTEN in hepatocellular carcinoma. Hepatol Res. 2007; 37:389–396.
7. Khalid A, Hussain T, Manzoor S, Saalim M, Khaliq S. PTEN: a potential prognostic marker in virus-induced hepatocellular carcinoma. Tumour Biol. 2017; 39:1010428317705754.
8. Kang-Park S, Im JH, Lee JH, Lee YI. PTEN modulates hepatitis B virus-X protein induced survival signaling in Chang liver cells. Virus Res. 2006; 122:53–60.
9. Jin YJ, Lee D, Chung YH, Kim JA, Kim SE, Lee YS, et al. Tumor necrosis factor-alpha gene polymorphism associated with development of hepatitis B virus-associated hepatocellular carcinoma. J Clin Gastroenterol. 2015; 49:e76–e81.
10. Kim SS, Cho HJ, Lee HY, Park JH, Noh CK, Shin SJ, et al. Genetic polymorphisms in the Wnt/beta-catenin pathway genes as predictors of tumor development and survival in patients with hepatitis B virus-associated hepatocellular carcinoma. Clin Biochem. 2016; 49:792–801.
11. Liao X, Yu L, Liu X, Han C, Yu T, Qin W, et al. Genome-wide association pathway analysis to identify candidate single nucleotide polymorphisms and molecular pathways associated with TP53 expression status in HBV-related hepatocellular carcinoma. Cancer Manag Res. 2018; 10:953–967.
12. Du Y, Zhang YW, Pu R, Han X, Hu JP, Zhang HW, et al. Phosphatase and tensin homologue genetic polymorphisms and their interactions with viral mutations on the risk of hepatocellular carcinoma. Chin Med J (Engl). 2015; 128:1005–1013.
13. Marrero JA, Kulik LM, Sirlin CB, Zhu AX, Finn RS, Abecassis MM, et al. Diagnosis, staging, and management of hepatocellular carcinoma: 2018 practice guidance by the American Association for the Study of Liver Diseases. Hepatology. 2018; 68:723–750.
14. Kim SS, Hwang JC, Lim SG, Ahn SJ, Cheong JY, Cho SW. Effect of virological response to entecavir on the development of hepatocellular carcinoma in hepatitis B viral cirrhotic patients: comparison between compensated and decompensated cirrhosis. Am J Gastroenterol. 2014; 109:1223–1233.
15. Lee SK, Kim MH, Cheong JY, Cho SW, Yang SJ, Kwack K. Integrin alpha V polymorphisms and haplotypes in a Korean population are associated with susceptibility to chronic hepatitis and hepatocellular carcinoma. Liver Int. 2009; 29:187–195.
16. Ding J, Gao Y, Liu R, Xu F, Liu H. Association of PTEN polymorphisms with susceptibility to hepatocellular carcinoma in a Han Chinese population. DNA Cell Biol. 2011; 30:229–234.
17. Cully M, You H, Levine AJ, Mak TW. Beyond PTEN mutations: the PI3K pathway as an integrator of multiple inputs during tumorigenesis. Nat Rev Cancer. 2006; 6:184–192.
18. Rossi DJ, Weissman IL. PTEN, tumorigenesis, and stem cell selfrenewal. Cell. 2006; 125:229–231.
19. Sansal I, Sellers WR. The biology and clinical relevance of the PTEN tumor suppressor pathway. J Clin Oncol. 2004; 22:2954–2963.
20. Wan XW, Jiang M, Cao HF, He YQ, Liu SQ, Qiu XH, et al. The alteration of PTEN tumor suppressor expression and its association with the histopathological features of human primary hepatocellular carcinoma. J Cancer Res Clin Oncol. 2003; 129:100–106.
21. Dong-Dong L, Xi-Ran Z, Xiang-Rong C. Expression and significance of new tumor suppressor gene PTEN in primary liver cancer. J Cell Mol Med. 2003; 7:67–71.
22. Wu SK, Wang BJ, Yang Y, Feng XH, Zhao XP, Yang DL. Expression of PTEN, PPM1A and P-Smad2 in hepatocellular carcinomas and adjacent liver tissues. World J Gastroenterol. 2007; 13:4554–4559.
23. Xie CC, Lu L, Sun J, Zheng SL, Isaacs WB, Gronberg H, et al. Germline sequence variants of PTEN do not have an important role in hereditary and non-hereditary prostate cancer susceptibility. J Hum Genet. 2011; 56:496–502.
24. Lacey JV Jr, Yang H, Gaudet MM, Dunning A, Lissowska J, Sherman ME, et al. Endometrial cancer and genetic variation in PTEN, PIK3CA, AKT1, MLH1, and MSH2 within a population-based casecontrol study. Gynecol Oncol. 2011; 120:167–173.
25. Pezzolesi MG, Li Y, Zhou XP, Pilarski R, Shen L, Eng C. Mutationpositive and mutation-negative patients with Cowden and Bannayan-Riley-Ruvalcaba syndromes associated with distinct 10q haplotypes. Am J Hum Genet. 2006; 79:923–934.
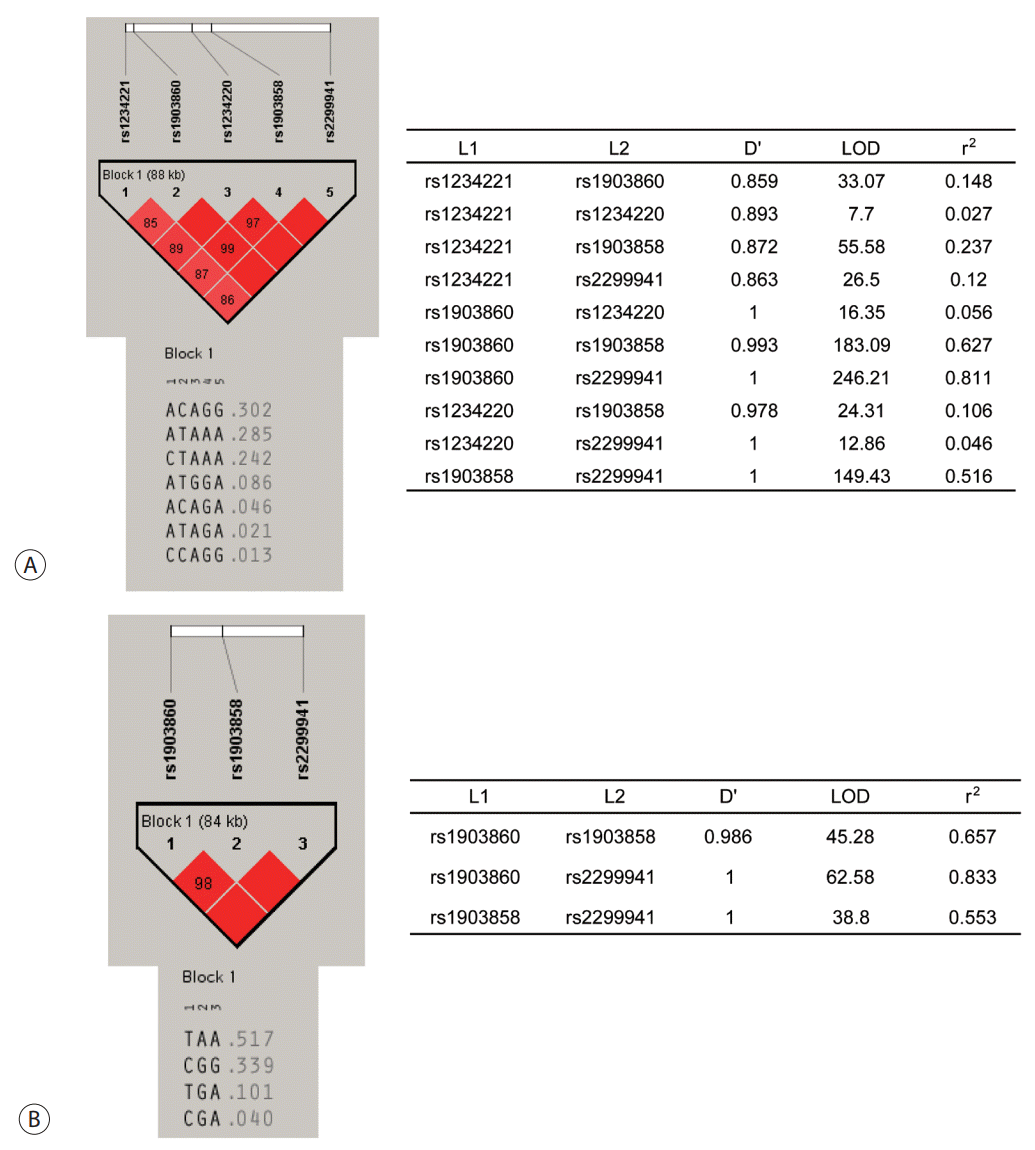
Table 1.
Table 2.
Table 3.
Table 4.
rs# or haplotype | Allele |
Co-dominant* |
Co-dominant† |
Dominant‡ |
Recessive§ |
||||
---|---|---|---|---|---|---|---|---|---|
OR (95% CI) | P-value | OR (95% CI) | P-value | OR (95% CI) | P-value | OR (95% CI) | P-value | ||
rs1234221 | A>C | 0.878 (0.583-1.322) | 0.533 | 1.198 (0.618-2.321) | 0.593 | 1.258 (0.661-2.395) | 0.484 | 0.939 (0.642-1.373) | 0.745 |
rs1903860 | T>C | 0.648 (0.428-0.980) | 0.040∏ | 0.880 (0.506-1.530) | 0.651 | 1.087 (0.649-1.820) | 0.751 | 0.706 (0.482-1.034) | 0.074 |
rs1234220 | A>G | 0.829 (0.481-1.431) | 0.501 | 1.296 (0.258-6.514) | 0.753 | 1.332 (0.266-6.680) | 0.727 | 0.862 (0.510-1.456) | 0.862 |
rs1903858 | A>G | 0.534 (0.342-0.833) | 0.006∏ | 0.804 (0.479-1.349) | 0.804 | 1.179 (0.758-1.834) | 0.464 | 0.613 (0.406-0.927) | 0.020∏ |
rs2299941 | A>G | 0.658 (0.436-0.992) | 0.045∏ | 0.925 (0.503-1.699) | 0.801 | 1.108 (0.619-1.982) | 0.731 | 0.714 (0.488-1.044) | 0.082 |
rs17431184 | T>C | 1.105 (0.671-1.535) | 0.944 | 1.085 (0.537-2.192) | 0.821 | 1.079 (0.542-2.150) | 0.828 | 1.029 (0.700-1.511) | 0.885 |
Ht1 | ACAGG | 0.933 (0.4921.771) | 0.833 | 0.693 (0.459-1.046) | 0.081 | 0.740 (0.504-1.087) | 0.124 | 1.094 (0.592-2.024) | 0.773 |
Ht2 | ATAAA | 1.798 (0.862-3.750) | 0.118 | 0.688 (0.453-1.045) | 0.080 | 0.778 (0.519-1.168) | 0.227 | 2.277 (1.144-4.532) | 0.019∏ |
Ht3 | CTAAA | 1.298 (0.666-2.528) | 0.443 | 0.925 (0.563-1.519) | 0.758 | 1.034 (0.676-1.581) | 0.878 | 1.319 (0.682-2.549) | 0.411 |
Ht4 | ATGGA | 1.360 (0.273-6.789) | 0.708 | 1.132 (0.620-2.065) | 0.687 | 1.155 (0.652-2.045) | 0.622 | 1.341 (0.269-6.679) | 0.721 |
Ht5 | Other | 5.244 (0.349-78.806) | 0.231 | 0.944 (0.518-1.721) | 0.851 | 1.012 (0.561-1.823) | 0.970 | 5.275 (0.351-79.201) | 0.229 |
Table 5.
rs# or haplotype | Genotype | No HCC | HCC |
Univariate P-value |
Multivariate P-value | ||
---|---|---|---|---|---|---|---|
Co-dominant | Dominant | Recessive | |||||
rs1903860 | TT | 54 (34.2) | 16 (41.0) | 0.678 | 1.000 | 0.046* | 0.459 |
CT | 82 (51.9) | 19 (48.7) | |||||
CC | 22 (13.9) | 4 (10.3) | |||||
rs1903858 | AA | 38 (23.9) | 12 (29.3) | 0.941 | 0.459 | 0.496 | 0.681 |
AG | 88 (55.3) | 20 (48.8) | |||||
GG | 33 (20.8) | 9 (22.0) | |||||
rs2299941 | AA | 62 (39.5) | 23 (56.1) | 0.192 | 0.603 | 0.069 | 0.035* |
AG | 76 (48.4) | 14 (34.1) | |||||
GG | 19 (12.1) | 4 (9.8) | |||||
TAA | +/+ | 37 (23.6) | 11 (28.2) | 0.955 | 0.835 | 0.784 | 0.628 |
+/− | 87 (55.4) | 20 (51.3) | |||||
−/− | 33 (21.0) | 8 (20.5) | |||||
CGG | +/+ | 19 (12.1) | 4 (10.3) | 0.293 | 0.118 | 0.661 | 0.675 |
+/− | 76 (48.4) | 14 (35.9) | |||||
−/− | 62 (39.5) | 21 (53.8) | |||||
TGA | +/+ | 0 (0.0) | 1 (2.6) | 0.108 | 0.229 | 0.060 | 0.037* |
+/− | 35 (22.3) | 10 (25.6) | |||||
−/− | 122 (77.7) | 28 (71.8) | |||||
CGA | +/+ | 0 (0.0) | 0 (0.0) | 0.534 | 0.534 | NA | NA |
+/− | 3 (1.9) | 2 (5.1) | |||||
−/− | 154 (98.1) | 37 (94.9) |