INTRODUCTION
MATERIALS AND METHODS
Study design and population
Infraclavicular approach to the subclavian vein
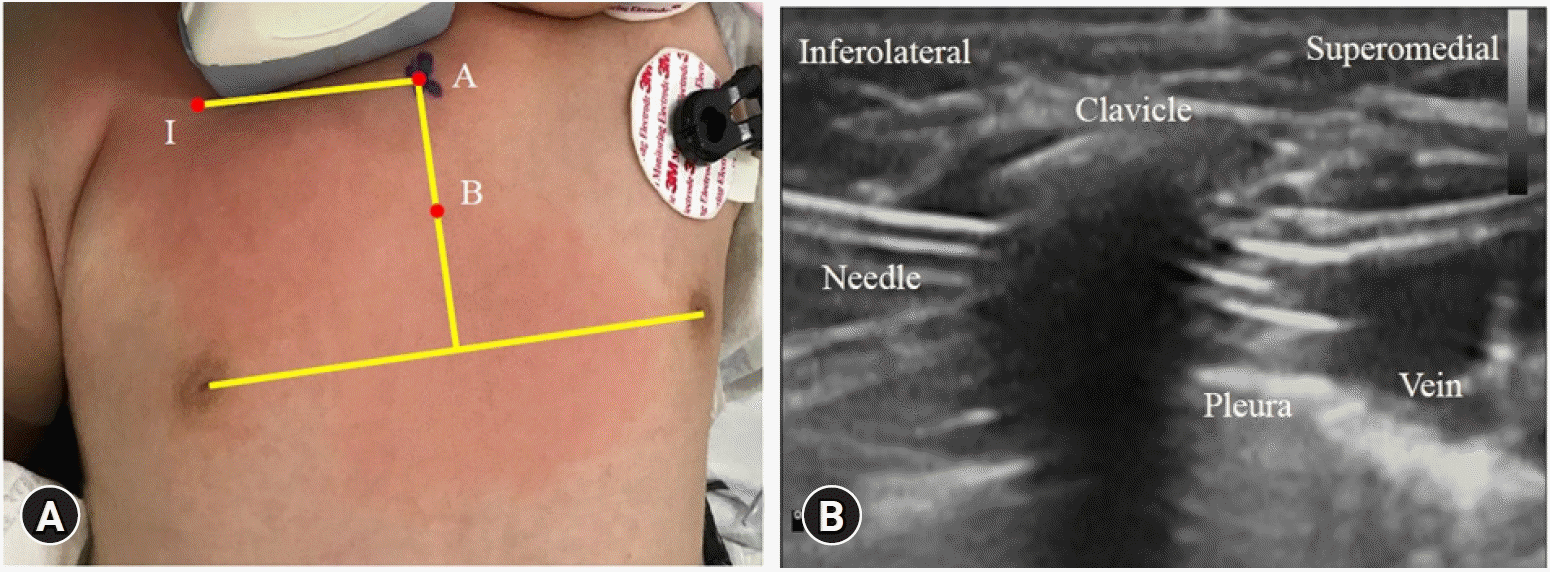 | Fig. 1.Landmark points used in landmark-based models (A) and ultrasound image taken during introducer needle insertion via the infraclavicular approach using an in-plane technique (B). (A) I: insertion point of the needle, A: tip of the sternal head of the right clavicle, B: midpoint of the perpendicular line drawn from the sternal head of the right clavicle to the line connecting the nipples. (B) A linear ultrasound probe was placed at the supraclavicular level with the clavicle at the center of the view. The probe was directed slightly inferolateral to superomedial direction. The vein indicated in the figure represents subclavian vein joining with the internal jugular vein. |
Data acquisition
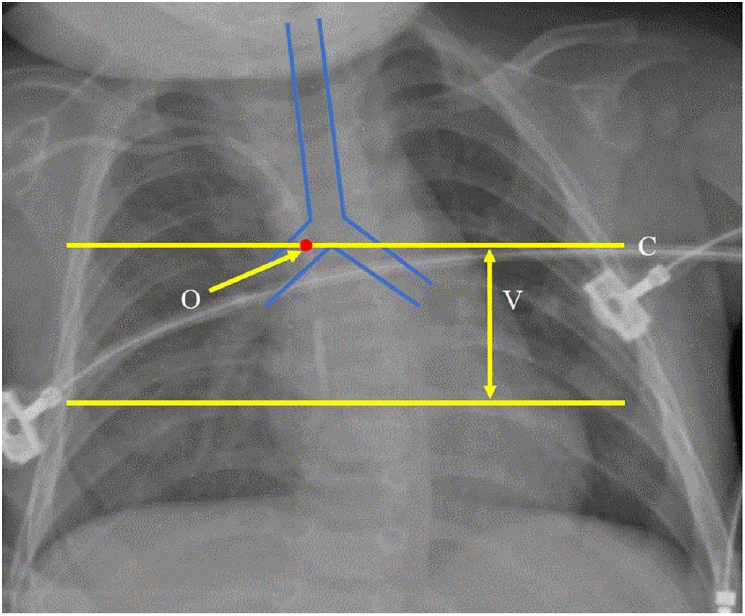 | Fig. 2.Determination of the optimal insertion length on chest radiograph. The trachea and main bronchus are outlined by a blue solid line. The optimal insertion length was determined by subtracting the vertical distance (V) between the tip and the carina (C) from the actual inserted length. C: level of the carina, V: vertical distance between the catheter tip and the carina, O: optimal position of the catheter tip. |
Derivation of the estimation method
Statistical analysis
RESULTS
Table 1.
| Variable | Value |
|---|---|
| Total catheterizations (n) | 50 |
| Gestational age (wk) | 37.0 (32.0, 38.0) |
| Chronological age (wk) | 13.5 (4.0, 25.0) |
| Postmenstrual age (wk) | 47.0 (41.0, 56.0) |
| Birth weight (g) | 2,550.0 (1,870.0, 3,100.0) |
| Weight (kg) | 4.1 (3.0, 5.3) |
| Height (cm) | 53.5 (48.5, 59.6) |
| Sex (M/F) | 25/25 |
| IA (mm) | 40.0 (30.0, 40.0) |
| AB (mm) | 25.0 (20.0, 30.0) |
| IA + AB (mm) | 59.9 ± 10.5 |
| Vertical distance* (mm) | 11.3 ± 12.5 |
| Optimal length† (determined, mm) | 53.9 ± 11.4 |
All catheterizations were considered independent events. Values are expressed as number only, median (1Q, 3Q), or mean ± SD. IA: distance from the insertion point (I) to the tip of the sternal head of the right clavicle (A), AB: distance from point A to the midpoint (B) of the perpendicular line drawn from the sternal head of the right clavicle to the line connecting the nipples.
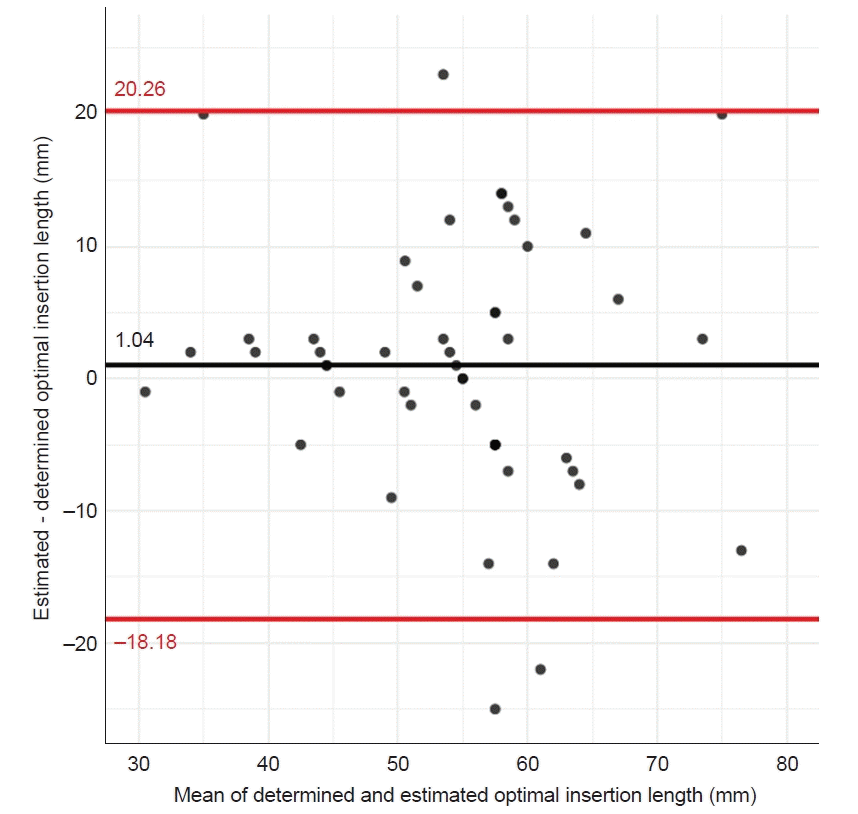 | Fig. 4.Bland-Altman plot of determined and estimated optimal insertion lengths (IA + AB – 5). IA: distance from the insertion point (I) to the tip of the sternal head of the right clavicle (A), AB: distance from point A to the midpoint (B) of the perpendicular line drawn from the sternal head of the right clavicle to the line connecting the nipples. |
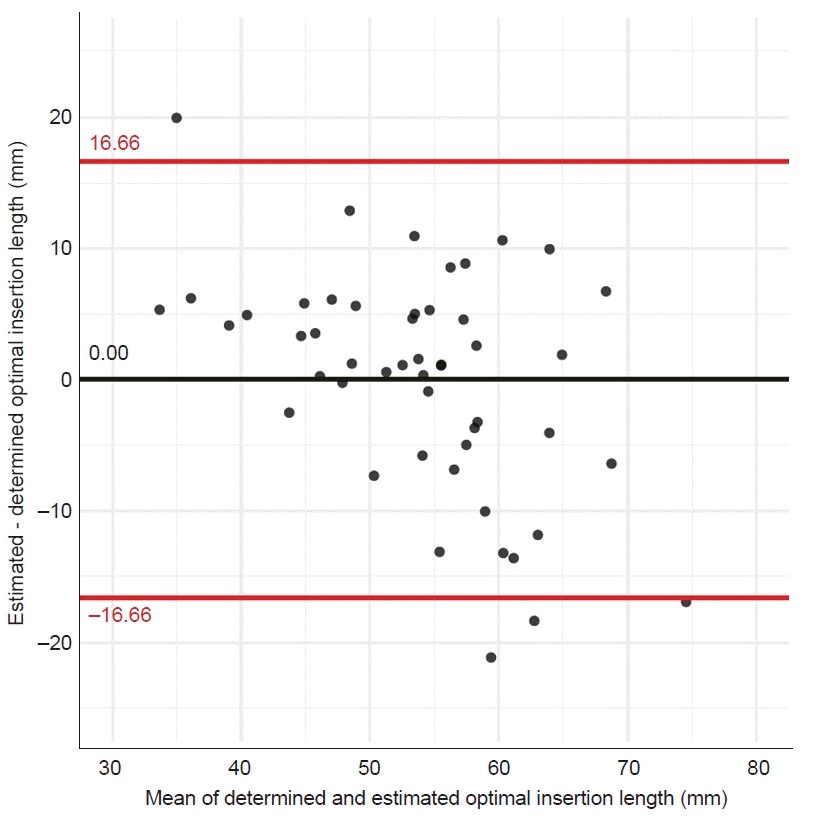 | Fig. 5.Bland-Altman plot of determined and estimated optimal insertion lengths (linear regression model). |
Table 2.
| Variable | Univariate | Multivariate | Importance (%) | ||||
|---|---|---|---|---|---|---|---|
| Estimate | 95% CI | P value | Estimate | 95% CI | P value | ||
| Gestational age (wk) | 0.506 | –0.197 to 1.208 | 0.154 | NA | NA | NA | NA |
| Chronological age (wk)* | 0.269 | 0.027 to 0.511 | 0.030 | NA | NA | NA | NA |
| Postmenstrual age (wk)* | 0.370 | 0.125 to 0.616 | 0.004 | –0.531 | –1.162 to 0.100 | 0.097 | 9.57 |
| Birth weight (g) | 0.004 | 0.001 to 0.007 | 0.022 | 0.001 | –0.003 to 0.004 | 0.701 | 9.33 |
| Weight (kg) | 2.928 | 1.459 to 4.398 | < 0.001 | 2.814 | –1.079 to 6.707 | 0.152 | 16.54 |
| Height (cm) | 0.663 | 0.346 to 0.980 | < 0.001 | 0.366 | –0.440 to 1.171 | 0.365 | 16.08 |
| Sex, male | 2.044 | –4.484 to 8.572 | 0.532 | NA | NA | NA | NA |
| IA (mm) | 0.733 | 0.388 to 1.078 | < 0.001 | 0.534 | 0.167 to 0.901 | 0.005 | 33.89 |
| AB (mm) | 0.752 | 0.193 to 1.311 | 0.009 | 0.486 | –0.034 to 1.006 | 0.066 | 14.59 |
IA: distance from the insertion point (I) to the tip of the sternal head of the right clavicle (A), AB: distance from point A to the midpoint (B) of the perpendicular line drawn from the sternal head of the right clavicle to the line connecting the nipples, CI: confidence interval, NA: not available.


 PDF
PDF Citation
 Print
Print


 XML Download