INTRODUCTION
MATERIALS AND METHODS
Subjects
Anesthetic management
Group allocation
Measurement of ONSD
Statistical analysis
RESULTS
Table 1.
Table 2.
Values are presented as mean ± SD. Adjusted P value indicates the Bonferroni-corrected P value. T0, supine position before anesthesia induction (baseline); T1, 1 h after 30-degree Trendelenburg position with CO2 pneumoperitoneum; T2, 2 h after 30-degree Trendelenburg position with CO2 pneumoperitoneum; T3, 10 min after returning to supine position without CO2 pneumoperitoneum at the end of surgery.
Table 3.
Values are presented as mean ± SD. Adjusted P value indicates the Bonferroni-corrected P value. T0, supine position before anesthesia induction (baseline); T1, 1 h after 30-degree Trendelenburg position with CO2 pneumoperitoneum; T2, 2 h after 30-degree Trendelenburg position with CO2 pneumoperitoneum; T3, 10 min after returning to supine position without CO2 pneumoperitoneum at the end of surgery.
Table 4.
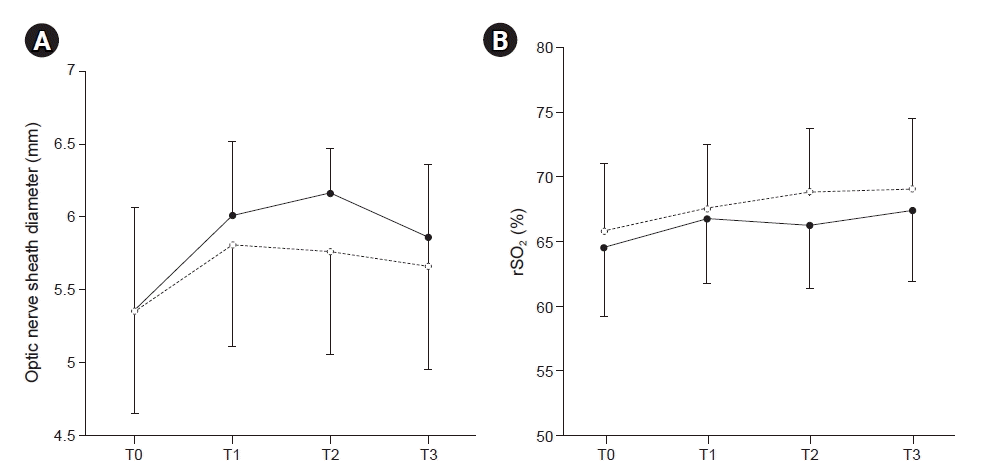
| Optic nerve sheath diameter and changes in diameter | Normal blood pressure group (n = 27) | Low blood pressure group (n = 24) | Adjusted P value |
|---|---|---|---|
| Optic nerve sheath diameter (mm) | |||
| T0 | 5.31 ± 0.48 | 5.33 ± 0.46 | 0.891 |
| T1 | 6.0 ± 0.47* | 5.82 ± 0.5† | 0.631 |
| T2 | 6.1 ± 0.59‡ | 5.77 ± 0.47† | 0.121 |
| T3 | 5.87 ± 0.45 | 5.71 ± 0.57 | 0.772 |
| Changes in optic nerve sheath diameter (mm) | |||
| T1-T0 | 0.69 ± 0.37 | 0.49 ± 0.50 | 0.213 |
| T2-T0 | 0.79 ± 0.50 | 0.44 ± 0.50 | 0.142 |
| T3-T0 | 0.56 ± 0.43 | 0.38 ± 0.61 | 0.681 |
Values are presented as mean ± SD. Adjusted P value indicates the Bonferroni-corrected P value. T0, supine position before anesthesia induction (baseline); T1, 1 h after 30-degree Trendelenburg position with CO2 pneumoperitoneum; T2, 2 h after 30-degree Trendelenburg position with CO2 pneumoperitoneum; T3, 10 min after returning to supine position without CO2 pneumoperitoneum at the end of surgery.
 | Fig. 3.Changes in optic nerve sheath diameter (A) and regional cerebral oxygen saturation (B) (rSO2) in normal (filled circle) and low blood pressure groups (open circle). Data are mean with SD. T0, supine position before anesthesia induction (baseline); T1, 1 h after 30-degree Trendelenburg position with CO2 pneumoperitoneum; T2, 2 h after 30-degree Trendelenburg position with CO2 pneumoperitoneum; T3, 10 min after returning to supine position without CO2 pneumoperitoneum at the end of surgery. |
Table 5.
Values are presented as mean ± SD. Adjusted P value indicates the Bonferroni-corrected P value. T0, supine position before anesthesia induction (baseline); T1, 1 h after 30-degree Trendelenburg position with CO2 pneumoperitoneum; T2, 2 h after 30-degree Trendelenburg position with CO2 pneumoperitoneum; T3, 10 min after returning to supine position without CO2 pneumoperitoneum at the end of surgery.


 PDF
PDF Citation
 Print
Print


 XML Download