INTRODUCTION
MATERIALS AND METHODS
Data sources and subjects
Medical utilization and resource of big data
Statistical analysis
RESULTS
Table 1.
Changes in the anesthetic methods by time and region
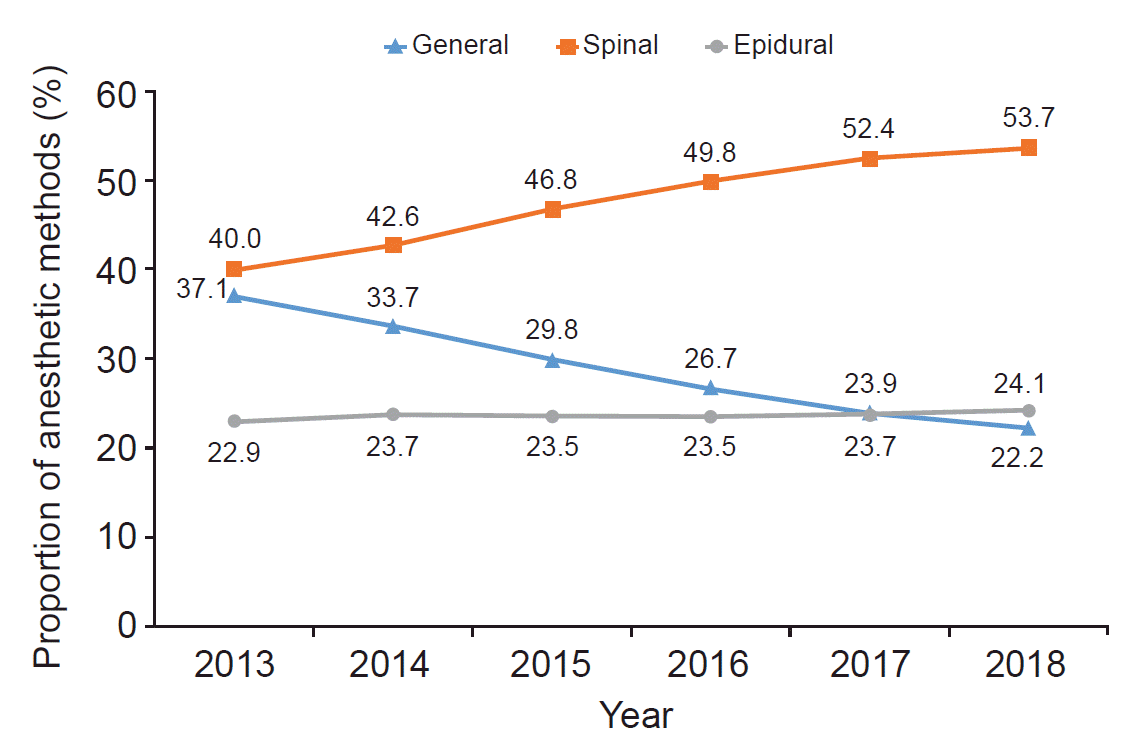
 | Fig. 2.Trends in anesthetic methods of cesarean sections in the Korean Health Insurance Review and Assessment Service, 2013–2018. Values are expressed as percentages for each year. It shows a pattern of decrease in general anesthesia and an increase in spinal and epidural anesthesia over time (P < 0.001). Linear-by-linear association test was used for trend analysis. |
Table 2.
Values are expressed as a percentage of the anesthetic methods by region and year. General anesthesia decreased in all areas (P < 0.001). Spinal anesthesia increased in all regions, except Jeju (P < 0.001). Epidural anesthesia use increased in Gyeongsang and Jeju (P < 0.001). Epidural anesthesia use in Seoul capital area decreased over time (P < 0.001). Linear-by-linear association test was used for trend analysis. Data are obtained from the Korean Health Insurance Review and Assessment Service, 2013–2018.
Hospital sizes
Table 3.
| Variable | General anesthesia (n = 216,685) |
Regional anesthesia |
Odds ratio (95% CI)* | P value* | |
|---|---|---|---|---|---|
| Spinal anesthesia (n = 359,106) | Epidural anesthesia (n = 177,494) | ||||
| Region | |||||
| Seoul capital area | 83,817 (22.4) | 180,923 (48.4) | 109,016 (29.2) | Reference | Reference |
| Gyeongsang | 88,053 (42.5) | 78,549 (37.9) | 40,767 (19.7) | 2.553 (2.523–2.583) | < 0.001 |
| Jeolla | 18,282 (29.8) | 27,406 (44.7) | 15,651 (25.5) | 1.469 (1.441–1.497) | < 0.001 |
| Chungcheoung | 13,975 (16.6) | 62,381 (74.2) | 7,674 (9.1) | 0.690 (0.677–0.704) | < 0.001 |
| Gangwon | 6,453 (37.1) | 8,486 (48.8) | 2,461 (20.5) | 2.039 (1.975–2.105) | < 0.001 |
| Jeju | 6,105 (65.0) | 1,361 (14.5) | 1,925 (20.5) | 6.427 (6.156–6.710) | < 0.001 |
| Hospital size† | |||||
| Tertiary care hospital | 27,246 (44.2) | 32,681 (53.0) | 1,765 (2.9) | 2.300 (2.259–2.342) | < 0.001 |
| General hospital | 25,833 (34.0) | 41,627 (54.8) | 8,490 (11.2) | 1.499 (1.473–1.525) | < 0.001 |
| Hospital | 94,840 (27.3) | 140,742 (40.6) | 111,310 (32.1) | 1.094 (1.082–1.107) | < 0.001 |
| Clinic | 68,766 (25.6) | 144,056 (53.6) | 55,929 (20.8) | Reference | Reference |
| Age (yr) | |||||
| < 20 | 807 (40.4) | 776 (38.8) | 417 (20.9) | 1.745 (1.595–1.909) | < 0.001 |
| 20–29 | 51,367 (29.9) | 78,089 (45.5) | 42,202 (24.6) | 1.102 (1.088–1.116) | < 0.001 |
| 30–34 | 98,819 (27.9) | 168,275 (47.6) | 86,635 (24.5) | Reference | Reference |
| 35–39 | 55,281 (28.7) | 95,353 (49.5) | 41,943 (21.8) | 1.039 (1.026–1.051) | < 0.001 |
| > 40 | 10,411 (31.2) | 16,613 (49.9) | 6,297 (18.9) | 1.172 (1.144–1.201) | < 0.001 |
| Parity | |||||
| Primipara | 124,079 (29.6) | 184,912 (44.1) | 110,613 (26.4) | 1.068 (1.057–1.079) | < 0.001 |
| Multipara | 89,836 (28.2) | 166,194 (52.2) | 62,363 (19.6) | Reference | Reference |
| Multiple gestation | |||||
| Singleton | 203,809 (28.8) | 334,692 (47.3) | 169,049 (23.9) | 0.814 (0.795–0.834) | < 0.001 |
| Multiple gestation | 10,106 (33.2) | 16,414 (53.9) | 3,927 (12.9) | Reference | Reference |
| Emergency state | |||||
| Emergency | 69,167 (30.2) | 101,587 (44.4) | 58,063 (25.4) | 1.147 (1.133–1.161) | < 0.001 |
| Elective | 79,547 (27.4) | 139,858 (48.2) | 70,786 (24.4) | Reference | Reference |
| Gestational age (wk) | |||||
| ≤ 22 | 787 (49.2) | 419 (26.2) | 393 (24.6) | 2.623 (2.377–2.893) | < 0.001 |
| 23–33 | 11,623 (54.9) | 8,611 (40.7) | 937 (4.4) | 3.294 (3.204–3.386) | < 0.001 |
| 34–36 | 13,339 (34.0) | 19,834 (50.6) | 6,039 (15.4) | 1.395 (1.365–1.426) | < 0.001 |
| ≥ 37 | 175,556 (27.0) | 313,111 (48.1) | 161,957 (24.9) | Reference | Reference |
| Fetal weight (g)† | |||||
| < 1,500 | 5,099 (57.4) | 3,538 (39.8) | 254 (2.9) | 3.497 (3.352–3.648) | < 0.001 |
| 1,500–2,499 | 17,778 (38.9) | 22,414 (49.0) | 5,542 (12.1) | 1.654 (1.622–1.686) | < 0.001 |
| ≥ 2,500 | 191,086 (27.8) | 328,042 (47.7) | 168,867 (24.5) | Reference | Reference |
| Hospital stay (d) | |||||
| ≤ 6 | 99,539 (23.6) | 215,235 (51.0) | 107,500 (25.5) | 0.563 (0.557–0.569) | < 0.001 |
| ≥ 7 | 117,146 (35.4) | 143,871 (43.5) | 69,994 (21.1) | Reference | Reference |


 PDF
PDF Citation
 Print
Print


 XML Download