INTRODUCTION
MATERIALS AND METHODS
Table 1.
RESULTS
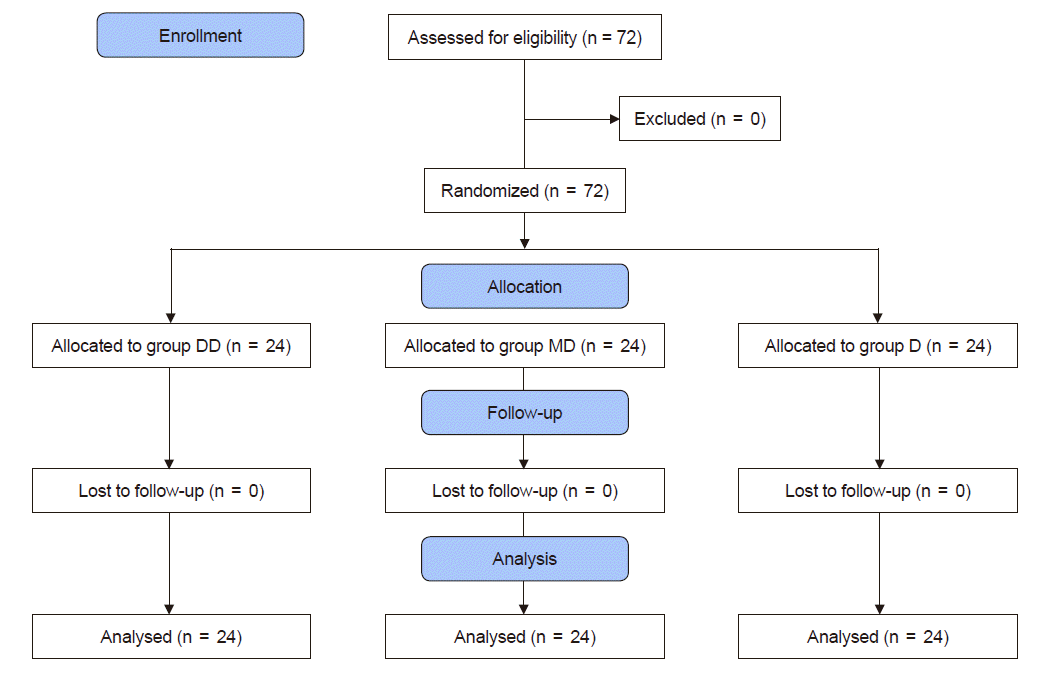
 | Fig. 1.Consolidated standards of reporting trials (CONSORT) flow chart of the study. A total of 72 patients (American Society of Anesthesiologists physical status classification I–II, aged over 65 years) were randomly allocated into three groups. Group DD: initial dose of 0.5 μg/kg dexmedetomidine + continuous infusion of 0.5 μg/kg/h dexmedetomidine. Group MD: initial dose of 0.02 mg/kg midazolam + continuous infusion of 0.5 μg/kg/h dexmedetomidine. Group D: continuous infusion of 0.5 μg/kg/h dexmedetomidine without initial dose. |
Table 2.
Values are presented as mean ± SD or the number of patients. Levels of spinal anesthesia are presented as T8 = 8, L2 = 12 + 2, L4 = 12 + 4. ASA: American Society of Anesthesiologists, TURP: transurethral resection of prostate, TURB: transurethral resection of bladder. Group DD: initial dose of 0.5 μg/kg dexmedetomidine + continuous infusion of 0.5 μg/kg/h dexmedetomidine. Group MD: initial dose of 0.02 mg/kg midazolam + continuous infusion of 0.5 μg/kg/h dexmedetomidine. Group D: continuous infusion of 0.5 μg/kg/h dexmedetomidine without initial dose. There were no significant differences among the groups.
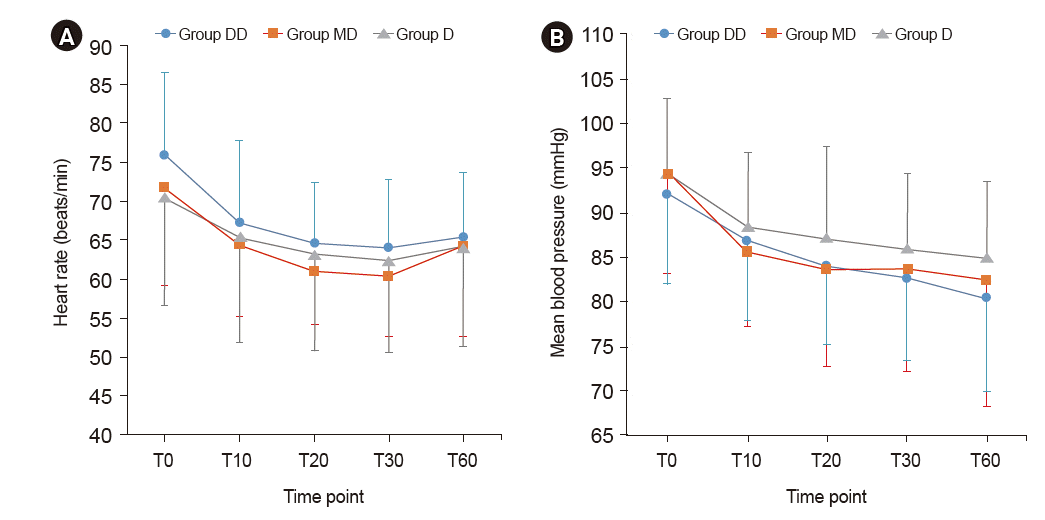
 | Fig. 2.Trends of heart rate (A) and mean blood pressure (B). Graphs’ values are presented as mean ± SD. Group DD: initial dose of 0.5 μg/kg dexmedetomidine + continuous infusion of 0.5 μg/kg/h dexmedetomidine. Group MD: initial dose of 0.02 mg/kg midazolam + continuous infusion of 0.5 μg/kg/h dexmedetomidine. Group D: continuous infusion of 0.5 μg/kg/h dexmedetomidine without initial dose. T0: start sedation, T10, 20, 30, 60: 10, 20, 30, 60 min after sedation. There were no significant differences among the groups at any time point. |
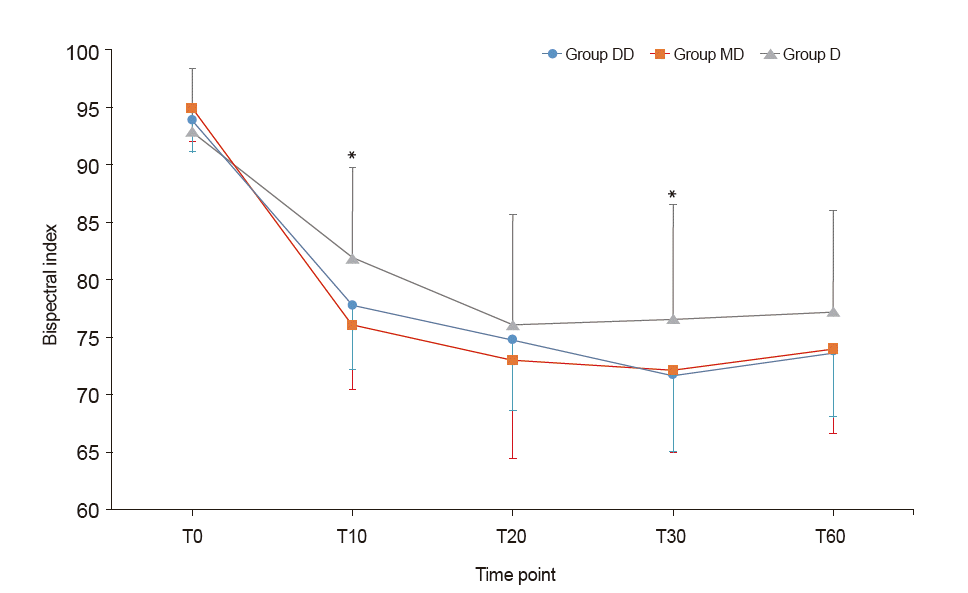
 | Fig. 3.Trends of Bispectral index. Graphs’ values are presented as mean ± SD. Group DD: initial dose of 0.5 μg/kg dexmedetomidine + continuous infusion of 0.5 μg/kg/h dexmedetomidine. Group MD: initial dose of 0.02 mg/kg midazolam + continuous infusion of 0.5 μg/kg/h dexmedetomidine. Group D: continuous infusion of 0.5 μg/kg/h dexmedetomidine without initial dose. T0: start sedation, T10, 20, 30, 60: 10, 20, 30, and 60 min after sedation. Bispectral index in Group D was significantly higher than in the other two groups at T10 and T30. *P < 0.05. |
Table 3.
Values are presented as median (1Q, 3Q). Group DD: initial dose of 0.5 μg/kg dexmedetomidine + continuous infusion of 0.5 μg/kg/h dexmedetomidine. Group MD: initial dose of 0.02 mg/kg midazolam + continuous infusion of 0.5 μg/kg/h dexmedetomidine. Group D: continuous infusion of 0.5 μg/kg/h dexmedetomidine without initial dose. T0: start sedation, T10, 20, 30, 60: 10, 20, 30, 60 min after sedation. There were no significant differences among the groups.
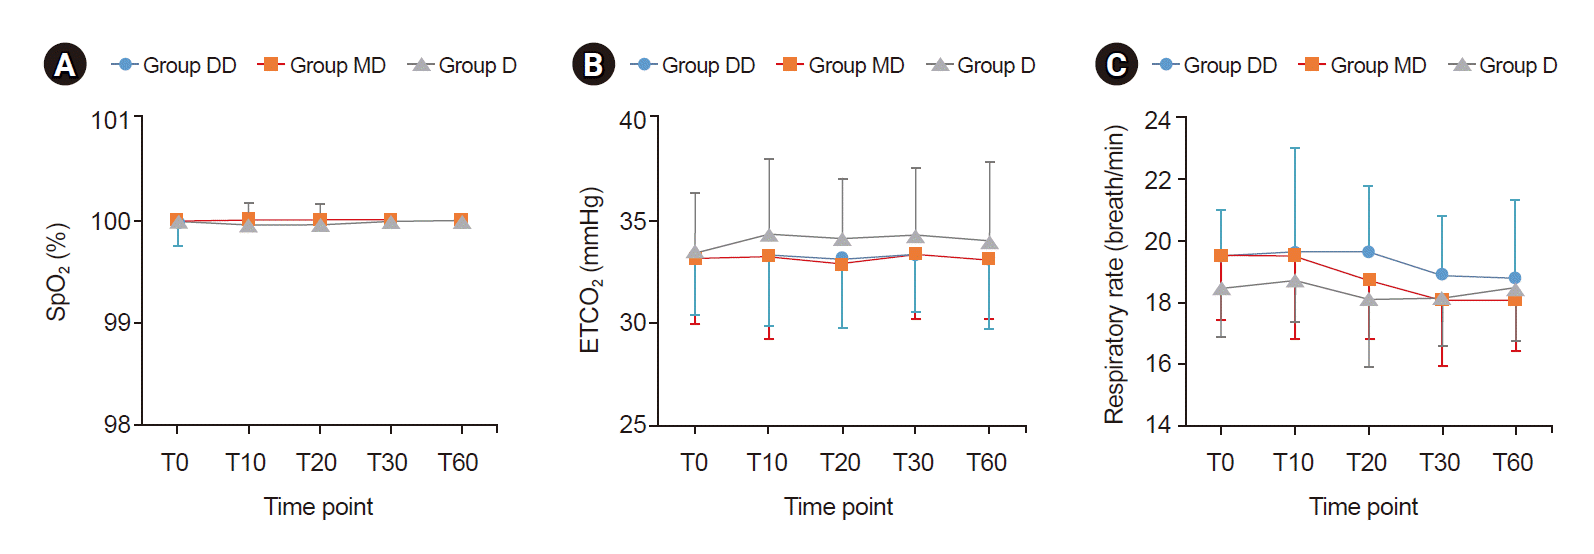
 | Fig. 4.Trends of oxygen saturation (SpO2) (A), end-tidal carbon dioxide (ETCO2) (B), and respiratory rate (C). Graphs’ values are presented as mean ± SD. Group DD: initial dose of 0.5 μg/kg dexmedetomidine + continuous infusion of 0.5 μg/kg/h dexmedetomidine. Group MD: initial dose of 0.02 mg/kg midazolam + continuous infusion of 0.5 μg/kg/h dexmedetomidine. Group D: continuous infusion of 0.5 μg/kg/h dexmedetomidine without initial dose. T0: start sedation, T10, 20, 30, 60: 10, 20, 30, and 60 min after sedation. There were no significant differences among the groups at any time point. |


 PDF
PDF Citation
 Print
Print


 XML Download