INTRODUCTION
MATERIALS AND METHODS
Study subjects
Preparations and measurements
Data analysis
RESULTS
Table 1
Values are presented as mean ± SD or median (interquartile range). PCA: patient controlled analgesia, Group K: 180 mg of ketorolac mixed with fentanyl and ramosetron in IV PCA, Group P: 10 g of propacetamol mixed with fentanyl and ramosetron in IV PCA. There was no significant difference between the groups.
Table 2
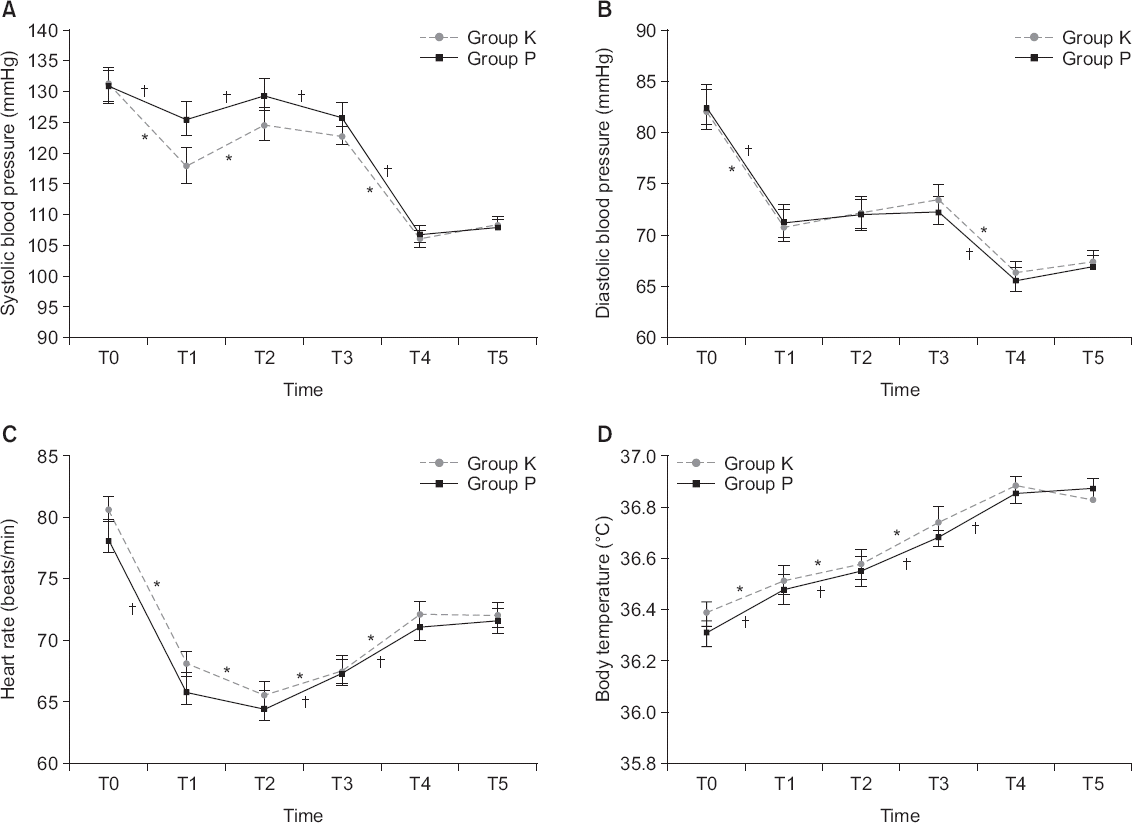
 | Fig. 1Values are presented as the mean ± SE. Repeated measures ANOVA were performed. In addition, paired t-tests were performed repetitively for each time segment to compare changes in SBP, DBP, HR, and BT within a group. Group K: 180 mg of ketorolac mixed with fentanyl and ramosetron in the IV PCA, Group P: 10 g of propacetamol mixed with fentanyl and ramosetron in IV PCA. T0, T1, T2, T3, T4, T5: 0 min, 15 min, 30 min, 60 min, 12 h, and 24 h after PCA application. There was significant effect of time (P values are all < 0.001), but no significant difference between the groups (P = 0.325, 0.835, 0.346, and 0.524, respectively). *Indicates significant differences for the time intervals within the group K (P values for SBP changes: T0–T1 < 0.001, T1–T2 < 0.001, T2–T3 = 0.189, T3–T4 < 0.001, T4–T5 = 0.200. P values for DBP changes: T0–T1 < 0.001, T1–T2 = 0.301, T2–T3 = 0.211, T3–T4 < 0.001, T4–T5 = 0.472. P values for HR changes: T0–T1 < 0.001, T1–T2 = 0.008, T2–T3 = 0.045, T3–T4 < 0.001, T4–T5 = 0.952. P values for BT changes: T0–T1 = 0.022, T1–T2 = 0.031, T2–T3 < 0.001, T3–T4 = 0.061, T4–T5 = 0.244). †Indicates significant differences for the time intervals within the group P (P values for SBP changes: T0–T1 = 0.039, T1–T2 = 0.006, T2–T3 = 0.043, T3–T4 < 0.001, T4–T5 = 0.457. P values for DBP changes: T0–T1 < 0.001, T1–T2 = 0.468, T2–T3 = 0.863, T3–T4 < 0.001, T4–T5 = 0.333. P values for HR changes: T0–T1 < 0.001, T1–T2 = 0.152, T2–T3 = 0.005, T3–T4 = 0.013, T4–T5 = 0.615. P values for BT changes: T0–T1 = 0.001, T1–T2 = 0.013, T2–T3 < 0.001, T3–T4 = 0.015, T4–T5 = 0.756). |
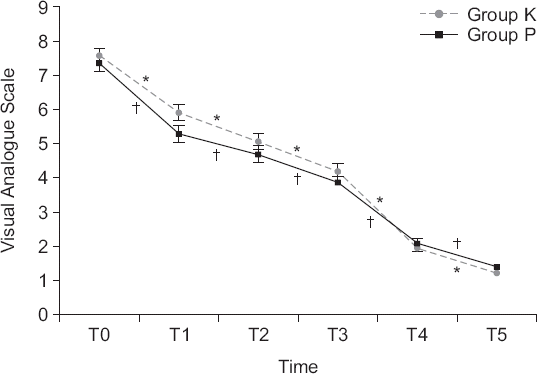
 | Fig. 2Values are presented as the mean ± SE. Repeated measures ANOVA was performed. Group K: 180 mg of ketorolac mixed with fentanyl and ramosetron in IV PCA, Group P: 10 g of propacetamol mixed with fentanyl and ramosetron in IV PCA. T0, T1, T2, T3, T4, T5: 0 min, 15 min, 30 min, 60 min, 12 h, and 48 h after PCA application. There was significant effect of time (P < 0.001) but no significant difference between the groups (P = 0.382). *Indicates significant differences for the time intervals within the group K (P values for VAS changes: T0–T1 < 0.001, T1–T2 < 0.001, T2–T3 < 0.001, T3–T4 < 0.001, T4–T5 < 0.001). †Indicates significant differences for the time intervals within the group P (P values for VAS changes: T0–T1 < 0.001, T1–T2 = 0.002, T2–T3 < 0.001, T3–T4 < 0.001, T4–T5 < 0.001). |
Table 3
Values are presented as mean ± SD. Analysis of covariance was performed with pre-assessment as a covariate. Postoperative levels of Hb, Hct, BUN, and INR were significantly different between the groups (P = 0.026, 0.027, 0.005, 0.017). Hb: hemoglobin, Hct: hematocrit, plt: platelet, BUN: blood urea nitrogen, Cr: creatinine, AST: aminotransferase, ALT: aminotransaminase, PT: prothrombin time, aPTT: activated partial thromboplastin, INR: international normalized ratio.
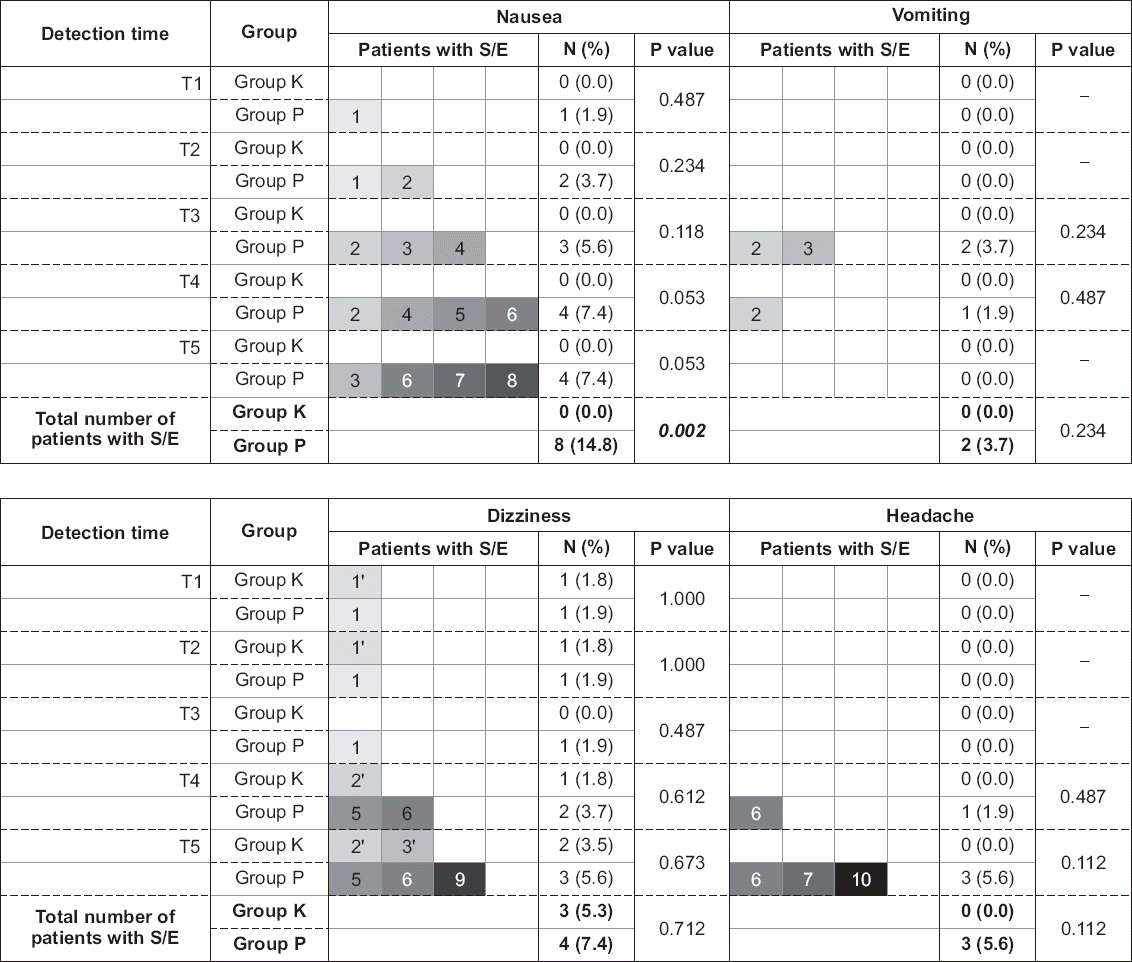
 | Fig. 3Values are presented as number (%). Each colored-square represents a study subject and a square with the same color and number represents an identical individual. Fisher’s exact chi-square tests were performed. Group K: 180 mg of ketorolac mixed with fentanyl and ramosetron in IV PCA, Group P: 10 g of propacetamol mixed with fentanyl and ramosetron in IV PCA. T1, T2, T3, T4, T5: 15 min, 30 min, 60 min, 12 h, and 24 h after surgery. S/E: side effect. A total of 13 patients experienced side effects, three from group K and 10 from group P (five patients experienced more than one type of side effects). There were no significant differences in the development of nausea, vomiting, dizziness, and headache between the groups at each time segments. However, the overall development of nausea for 24 hours was significantly different between the groups (P = 0.002). |


 PDF
PDF Citation
 Print
Print


 XML Download