Journal List > Anesth Pain Med > v.12(1) > 1158272

Hong, Lee, Lee, Shin, Chon, and Kim: Does acute normovolemic hemodilution affect intraoperative value of serum–creatinine concentration in patients undergoing cardiac surgery

Abstract

Background:

The possible impact of hemodilution during acute normovolemic hemodilution (ANH) using hydroxyethyl starch (HES) on intraoperative serum concentration of creatinine (s-Cr) has not been well investigated.

Methods:

Patients undergoing cardiac surgery were randomly allocated into Group-ANH (n = 15) or Group-C (control; n = 17). In Group-ANH, 5 ml/kg whole blood was collected, and they were administered 5 ml/kg of HES 130/0.4 after anesthesia induction and before initiating cardiopulmonary bypass (CPB). In both groups, moderate hypothermic CPB was initiated using 1,600–1,800 ml of bloodless priming solution. The changes of s-Cr, blood urea nitrogen, hematocrit (Hct), electrolytes, and osmolality were determined before ANH administration (T1), after administering ANH 5 ml/kg (T2), 30 and 60 s after the initiation of CPB (T3, T4), and at the end of surgery (T5).

Results:

In Group-ANH, the s-Cr values at T2 (median [IQR25–75%], 0.83 [0.71–1.00] mg/dl) were not significantly different compared to those at T1 (0.84 [0.64–1.00] mg/dl), while those at T3 and T4 (0.68 [0.61–0.80] and 0.76 [0.59–0.92] mg/dl, respectively) were significantly lower than those at T2 (0.83 [0.71–1.00] mg/dl, P < 0.001). Hct at T3, T4 and T5 were significantly lower than those of T1 in both groups, and those at T2 and T4 of Group-ANH were significantly lower than those of Group-C (P < 0.001). There was no significant inter-group difference in all other parameters.

Conclusions:

Intraoperative s-Cr was not affected by the administration of ANH 5 ml/kg, although it reduced transiently at the beginning of CPB. Further study is needed to determine the clinical relevancy of our results.

INTRODUCTION

Acute normovolemic hemodilution (ANH) has been used for reducing the allogeneic blood transfusion by preserving and re-infusing collected platelets and coagulation factors during cardiac surgery [1,2]. For this procedure, a certain amount of whole blood is withdrawn and stored in a bag with Citrate Phosphate Dextrose (CPD) solution, and the same amount of intravenous fluid is generally administered to maintain stable hemodynamics by compensating the withdrawn blood volume. Of the various fluids, balanced hydroxyl ethylstarch (HES) 130/0.4 is the preferred sole replacement fluid for ANH, since it has greater volume-expansion effect and low risk of fluid extravasation compared to crystalloid solutions. Needless to say, dilution of whole blood components is inevitable during the entire ANH procedure.
Glomerular filtration is one of the main physiological functions of kidneys, and its rate can be indirectly measured by using various reference substances, including creatinine. The values of serum creatinine (s-Cr) concentration or magnitude of their change have been used to evaluate kidney function and to determine the risk of acute kidney injury (AKI), after open heart surgery employing cardiopulmonary bypass (CPB) [3]. Single measured values of s-Cr concentration and serial changes in s-Cr values enable to predict the risk of CPB-induced AKI and perioperative morbidity and mortality [4-9].
The application of CPB with colloid and crystalloid 1,800–2,000 ml as a priming solution produces abrupt hemodilution. Previous studies speculated that this essential procedure for cardiac surgery usually increases the incidence of AKI, which is determined by an increased s-Cr value [10,11]. Furthermore, considering that application of ANH also produces considerable hemodilution, the combined application of these blood-diluting procedures (ANH and CPB), may reduce the relative amount of creatine concentration, and have the potential to underestimate the read of s-Cr.
However, the possible impact of ANH on s-Cr concentration has not been well investigated. To determine this, we analyzed the changes of s-Cr concentration before and after the application of ANH with HES 130/0.4 before the initiation of CPB in patients undergoing elective cardiac surgery.

MATERIALS AND METHODS

Patients

Male patients undergoing elective cardiac surgery, who had agreed and provided written informed consents, were randomly allocated into one of the two groups.
Preoperative exclusion criteria included the followings: female; Hb < 12 g/dl; atrial fibrillation; intracardial spontaneous echo contrast in preoperative transthoracic echocardiography; LV ejection fraction < 50%; cardiac output < 1.5 L/min/m2 or mixed venous O2 saturation (SvO2) < 65%; anti-platelet medication; anticoagulants; allergy to HES; prolongation of PT/INR, aPTT; s-Cr > 1.5 mg/dl; thrombocytopemia; and hypofibrinogenemia. This trial was registered in Clinicaltrials.gov (NCT02831270).

Randomization and group allocation

All recruited patients without preoperative exclusion criteria for the present study were given patient identification number (PIN) of 01–36 in the order of interview and recruitment. For blinded group allocation, 36 color-coded cards, 18 yellow and 18 green, were inserted into 36 thick-paper envelopes. After sealing and mixing the envelopes, they were randomly allocated the numbers from 01 to 36 (Envelope number). The patients were given the sealed envelopes according to their order of recruitment. Patients were instructed to carry the sealed envelopes to the operating room during surgery, and give it to the attending anesthesiologists.

Anesthesia

Under routine patient monitoring, including electrocardiogram (lead II and V5), pulse oximetry, near-infrared regional cerebral oximetry (NIR-CbO2), bispectral index (BIS) and invasive arterial pressure (BP), anesthesia was induced and maintained by propofol, remifentanil, and rocuronium. After giving intravenous midazolam (1.0–1.5 mg) and palonosetron, an arterial catheter was placed in the right radial artery. Anesthesia was induced and tracheal intubation was performed using target-controlled infusion (TCI) of propofol (target effect site 2.0 μg/ml, flash mode) and remifentanil (target plasma 15–20 ng/ml, 7 min for reaching the target concentration) as well as bolus rocuronium 0.9 mg/kg. For maintaining the anesthesia, TCI-propofol (effect site concentration of 1.0–1.2 μg/ml to maintain BIS value 40–60) and rocuronium infusion (2–3 μg/kg/min) were administered. After anesthetic induction, O2/air mixture (FIO2 0.4–0.7) was ventilated with a tidal volume of 6 ml/kg and positive end-expiratory pressure 5–8 mmHg. Respiratory rate was adjusted for maintaining normocapnea.
Under ultrasound-guidance, the pulmonary artery catheter was placed in the right internal jugular vein. After placement of a 3D-transesophageal echocardiography (TEE) probe, an intraoperative TEE was performed. To maintain pre-induction values of BP and heart rate (HR) (80–120%), SvO2 (> 60%) and NIR-CbO2 changes (> 25% of their pre-induction values or > 45% in their measured values), the following factors were changed and adjusted before and after CPB period: position of patients, minute ventilation, intravascular volume resuscitation, and administration of vasoactive drugs.

Acute normovolemic hemodilution

After the completing anesthesia induction and achieving stable hemodynamics, the sealed envelope was opened and the color of cards was checked by the attending anesthesiologist, none of whom were involved in the present study. If the color of card was yellow, 2.5 ml/kg whole blood was withdrawn from the CVP catheter and collected into a CPD bag, and 2.5 ml/kg HES 130/0.4 (Volulyte™) was infused to compensate (Group-ANH). This procedure was repeated till 5 ml/kg whole blood was collected. The collected blood was weighed on a digital balance, and one gram (g) of blood was assumed to be equivalent to one milliliter (ml). The collected blood was stored in the operating room, after labeling with patient name, identification number, time of collection and volume (temperature approximately 20–22°C); it was re-infused after giving protamine at the weaning from CPB, no later than 6 hours after the collection. If the color of card inside the envelope was green, ANH was not performed (Group-C).

Surgical procedures and CPB

A single surgeon, who was blinded and not associated with the present study, conducted all surgical procedures according to the same institutional operative protocol. After reaching an activated coagulation time (ACT) longer than 450 seconds by administering intravenous heparin (300–400 U/kg), the surgical procedure was performed under CPB with moderate hypothermia (28–29°C) and bloodless cardioplegia: CPB was primed with 1,300 ml of acetate-buffered crystalloid solution (Plasmasolution A™, CJ Healthcare, Korea), 3 ml/kg of 20% mannitol, and 100 ml of albumin. CPB was conducted with non-pulsatile pump and a membrane oxygenator, and the pump flow rate was adjusted as 2.0–2.5 L/min/m2 to maintain mean BP of 50–70 mmHg and NIR-CbO2 of changes > 25% of their pre-induction values or > 45% in their measured values. Cardioplegic solution containing K+ 100 mEq/L (Cardioplegic 1 solution™, JW pharmaceutical, Korea) was regularly administered for cardiac standstill. Acid-base was managed with the α-stat method, and the target range of PaO2 was 200–300 mmHg. After completion of the surgical procedure and systemic re-warming, patients were weaned from CPB. The threshold for transfusion of packed red blood cells was reaching hematocrit (Hct) < 21% during CPB and 28% after CPB weaning. Intraoperative bleeding from surgical site was salvaged and re-infused using cell saver till the closure of chest wall. Arterial blood gas analysis was performed every 2 hours before and after CPB periods. Transfusion of allogenic blood products was guided by the whole blood viscoelastic coagulation profile, determined using the point-of-care (POC) device (ROTEM™, Tem International GmbH, Germany). All patients were transferred to the intensive care unit after surgery, where they received management according to the institutional protocols.

Data collection and analyses

For the primary objective of the present study, s-Cr concentrations were determined before ANH (T1), after the first ANH of 5 ml/kg or before the initiation of CPB (T2), 30 and 60 seconds after the initiation of CPB (T3, T4), and at the end of surgery (T5); their intra-group and inter-group differences were analyzed. The s-Cr and blood urea nitrogen (BUN) were determined by using a POC test device (StatSensor™ Creatinine, Nova Medical, USA). PaO2, PaCO2, pH, Hct, electrolytes, and BUN were also determined with POC cartridge arterial blood gas analyzer (Stat Profile CCX, Nova Medical, USA). The amounts of transfused blood components were determined during CPB period, post-CPB period, and during the first 12 hours.
Statistical analysis was performed using SigmaPlot for Windows (Systat software Inc., 2011, ver 12.0, USA). Before statistical inference, all data were evaluated for normality test (Shapiro-Wilk test) and equal variance test. According to these results, for several variables which did not correspond to the assumptions for parametric statistical analysis, non-parametric methods were applied and data were presented as median (interquartile range) or number of cases. To compare data between groups, Mann-Whitney rank sum test was employed. Also, to compare the changes over observed time in each group, Friedman repeated measures analysis of variance on ranks, following Tukey test for post hoc analysis, were used. For categorical variables, chi-square analysis was applied. The significant alpha level was considered as below 0.050.

Sample size

By using pilot data of the 12 male patients undergoing cardiac surgery, mean ± SD of s-Cr was 0.743 ± 0.206 mg/dl. To detect s-Cr changes of 0.2 mg/dl minimally based on RM ANOVA, effect size was calculated as 0.485 with the assumption of F-statistics, mean difference was 0.2 with the same SD 0.206. The minimal number of patients in each group was 12. Minimum sample size in both groups was 24 with this effect size, power 0.80, alpha error probability 0.05, repetitions 5, with 50% correlation among repeated measures. Considering a 10% drop-out rate, a total of at least 28 patients were required with both groups combined.

RESULTS

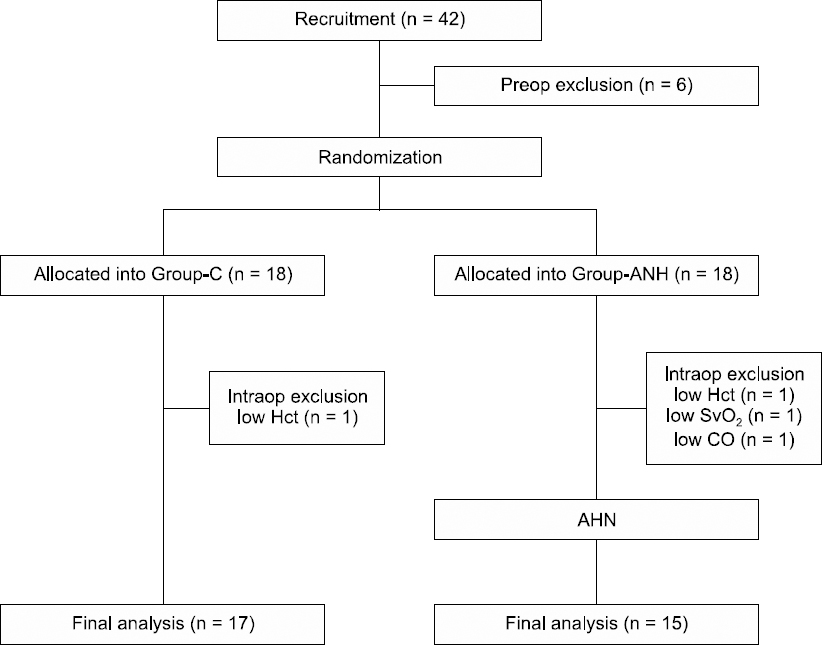
Fig. 1 shows the scheme of patient recruitment and analyses during the 12 month-study period. A total 42 patients were recruited, from which 6 were excluded based on the preoperative exclusion criteria. After intraoperative exclusion, 3 in Group-AHN and 1 in Group-C were excluded. Thus, totally 32 patients (n = 17 for Group Control, n = 15 for Group ANH) were included in the statistical analysis (Fig. 1). As shown in Table 1, no significant inter-group difference were seen based on the demographic data, including age, sex, height, weight, and body surface area. Volume of 5% HES was significantly greater in Group-ANH, but volume of intraoperatively administrated crystalloid, blood products (including packed red blood cell) and urine output also did not show significant inter-group difference.
Fig. 1
Scheme of patient recruitment. Group-C: patients in control group, Group-ANH: patients underwent ANH. ANH: acute normovolemic hemodilution, Preop: preoperative, Intraop: intraoperative, Hct: hematocrit, SvO2: mixed venous O2 saturation, CO: cardiac output.
APM_12_015_fig_1.tif
Table 1
Patient’s Characteristics and Variables Related Intraoperative Fluid Managements
Group-C Group-ANH P value
(n = 17) (n = 15)
Age (yr) 56 (47–63) 53 (41–65) 0.71
Sex (M/F) 7/10 10/5 0.178
Height (cm) 159 (154–168) 166 (158–170) 0.411
Weight (kg) 57 (50–70) 58 (51–64) 0.602
BSA (m2) 1.60 (1.5–1.7) 1.64 (1.5–1.7) 0.766
Intraoperative input
 Crystalloid (ml) 700 (525–800) 700 (500–900) 0.613
 HES (ml) 475 (300–500) 800 (500–1,000) 0.033*
 Allogenic blood products (ml) 870 (570–1,515) 755 (560–1,855) 0.839
 Packed-RBC during CPB (unit) 3 (3–5) 3 (2–5) 0.623
Intraoperative output Urine output (ml)   1,320 (718–1,738)   1,410 (970–1,980)  0.727

Data are presented as median (interquartile range) or number of patients. Group-C: patients in control group; Group-ANH: patients underwent ANH. ANH: Acute normovolemic hemodilution, BSA: body surface area, HES: 5% hydroxyethylstarch 130/0.4, packed-RBC: packed red blood cell, CPB: cardiopulmonary bypass. T1: before ANH of 5 ml/kg; T2: after ANH in Group-ANH or before the initiation of CPB in group-C; T3: 30 seconds after the initiation of CPB; T4: 60 seconds after the initiation of CPB; T5: immediately and at the end of surgery.

* P < 0.05 in inter-group comparison.

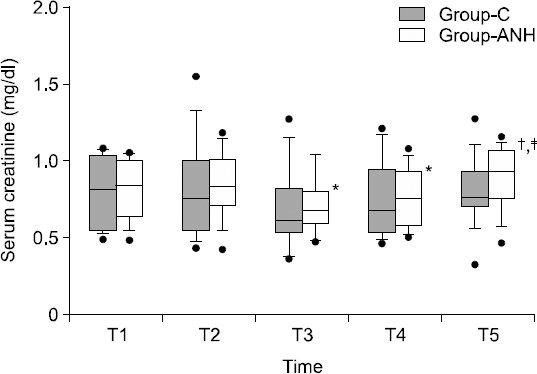
The s-Cr levels did not show any significant inter-group difference at any of the measured time points. In Group-ANH, s-Cr levels at T3 and T4 were significantly lower than those of T2 and T5 (Fig. 2 and Table 2).
Fig. 2
Changes in s-Cr. Box represents median (Q1-Q3) and whiskers represents maximum and minimum values inside fence. Upper fence is Q3 + 1.5 × (Q3-Q1) and lower fence is Q1 - (Q3-Q1). Dot tepresents outlier otude fence. Group-C: patients in control group, Group-ANH: patients underwent ANH. ANH: acute normovolemic hemodilution, s-Cr: serum creatinine, BUN: blood urea nitrogen, Hct: hematocrit. T1: before ANH, T2: after ANH of 5 ml/kg or before the initiation of cardiopulmonary bypass (CPB), T3 and T4: 30 and 60 seconds after the initiation of CPB, T5: at the end of surgery. *P < 0.05 vs. T2, †P < 0.05 vs. T3, ‡P < 0.05 vs. T4.
APM_12_015_fig_2.tif
Table 2
Changes in Serum-creatinine, Blood Urea Nitrogen, and Hematocrit
Groups T1 T2 T3 T4 T5 P value
s-Cr (mg/dl)
 Group-C 0.81 (0.55–1.04) 0.75 (0.55–0.97) 0.61 (0.54–0.82) 0.68 (0.53–0.89) 0.76 (0.71–0.93) 0.119
 Group-ANH 0.84 (0.64–1.00) 0.83 (0.71–1.00) 0.68 (0.61–0.80) 0.76 (0.59–0.92) 0.94 (0.77–1.06),§ < 0.001
 P value 0.769 0.316 0.625 0.625 0.161 -
BUN (mg/dl)
 Group-C 14 (12–17) 14 (12–15) 12 (9–15)* 12 (10–13)*, 13 (11–14)* < 0.001
 Group-ANH 13 (11–18) 12.0 (12–15) 11 (9–12)*, 11 (8–13)*, 13 (11–15)§ < 0.001
 P value 0.599 0.592 0.592 0.245 0.97 -
Hct (%)
 Group-C 39 (37–41) 38 (36–40) 31 (23–36)*, 27 (24–33)*, 31 (29–33)*, < 0.001
 Group-ANH 37 (35–39) 35 (31–37) 23 (19–26)*, 22 (19–26)*, 29 (26–31)* < 0.001
 P value 0.35 0.044 0.246 0.025 0.189 -

Values are median (interquartile range). Group-C: patients in control group (n = 17), Group-ANH: patients underwent ANH (n = 15). ANH: acute normovolemic hemodilution, s-Cr: serum creatinine, BUN: blood urea nitrogen, Hct: hematocrit. T1: before ANH, T2: after ANH of 5 ml/kg or before the initiation of cardiopulmonary bypass (CPB), T3 and T4: 30 and 60 seconds after the initiation of CPB, T5: at the end of surgery.

* P < 0.05 vs. T1,

P < 0.05 vs. T2,

P < 0.05 vs. T3,

§ P < 0.05 vs. T4, and

P < 0.05 in inter-group comparison.

After ANH (T2) and 60 seconds after the initiation of CPB (T4), BUN at T3, T4 and T5 were significantly lower than that of T1 in Group-C, and those of T3 and T4 were significantly lower than those of T1 in Group-ANH. There were no inter-group differences in the BUN values (Table 2)
Hct levels at T3, T4 and T5 were significantly lower than those of T1 in both groups. Hct levels at T2 and T4 of Group-ANH were significantly lower than those of Group-C (Table 2).
There was no inter-group difference in arterial blood gas and electrolytes (Tables 3 and 4).
Table 3
Changes in Arterial Blood Gas
Groups T1 T2 T3 T4 T5 P value
pH
 Group-C 7.41 (7.40–7.47) 7.43 (7.41–7.40) 7.44 (7.40–7.50) 7.44 (7.42–7.47) 7.38 (7.38–7.40)§ 0.01
 Group-ANH 7.44 (7.41–7.47) 7.43 (7.41–7.45) 7.40 (7.38–7.43) 7.41 (7.40–7.44) 7.40 (7.39–7.41)* 0.021
 P value 0.295 0.682 0.138 0.128 0.433 -
PaCO2 (mmHg)
 Group-C 39 (35–40) 38 (36–40) 32 (27–36) 29 (26–33)*, 41 (39–42),§ < 0.001
 Group-ANH 37 (33–38) 37 (35–39) 28 (26–34)*, 30 (27–31)*, 41 (40–43),§ < 0.001
 P value 0.261 0.37 0.262 0.799 0.766 -
PaO2 (mmHg)
 Group-C 176 (114–199) 133 (91–182) 208 (139–309) 251 (169–372)*, 124 (100–156),§ < 0.001
 Group-ANH 220 (151–236) 193 (170–232) 293 (255–357) 3,245 (2,623–344) 143 (101–190) < 0.001
 P value 0.023 0.020 0.019 0.23 0.502 -
HCO3 (mEq/L)
 Group-C 25 (25–26) 25 (24–26) 23 (17–24)*, 20 (18–23)*, 25 (23–26),§ < 0.001
 Group-ANH 24 (23–26) 25 (23–26) 18 (17–20)*, 19 (17–20)*, 26 (25–26),§ < 0.001
 P value 0.655 0.433 0.109 0.092 0.105 -
BE (mEq/L)
 Group-C 0.5 (0.2, 1.4) 0.7 (−0.2, 2.2) −1.9 (−6.0, 1.2)*, −3.5 (−5.0, −0.8)*, −0.2 (−0.7, 1.5)§ < 0.001
 Group-ANH 0.6 (−0.5, 2.0) 0.3 (−1.1, 1.9) −6.3 (−6.8, −5.0)*, −4.7 (−7.1, −3.2)*, 1.0 (−0.5, 2.1),§ < 0.001
 P value 0.737 0.39 0.071 0.084 0.433 -

Values are expressed as median (interquartile range; 25th, 75th). Group-C: patients in control group (n = 17), Group-ANH: patients underwent ANH (n = 15). ANH: acute normovolemic hemodilution, PaCO2: arterial Co2 tension, PaO2: arterial O2 tension, BE: base excess. T1: before ANH, T2: after ANH of 5 ml/kg or before the initiation of cardiopulmonary bypass (CPB), T3 and T4: 30 and 60 seconds after the initiation of CPB, T5: at the end of surgery.

* P < 0.05 vs. T1,

P < 0.05 vs. T2,

P < 0.05 vs. T3,

§ P < 0.05 vs. T4, and

P < 0.05 in inter-group comparison.

Table 4
Changes in Electrolytes and Osmolality
Groups T1 T2 T3 T4 T5 P value
Na+ (mEq/L)
 Group-C 140 (137–142) 140 (137–142) 139 (135–141) 138 (136–140) 142 (140–144),§ < 0.001
 Group-ANH 139 (137–140) 140 (137–141) 137 (135–138) 137 (136–138) 142 (141–146)*,,§ < 0.001
 P value 0.526 0.411 0.109 0.262 0.737 -
K+ (mEq/L)
 Group-C 3.5 (3.4–3.8) 3.8 (3.5–4.0) 4.0 (3.6–4.1)* 3.9 (3.8–4.2)*, 3.9 (3.7–4.1)* < 0.001
 Group-ANH 3.7 (3.5–4.0) 3.9 (3.6–4.1) 4.0 (3.7–4.2) 4.1 (3.8–4.3)* 3.9 (3.7–4.4) 0.027
 P value 0.114 0.526 0.71 0.799 0.628 -
Ca2+ (mEq/L)
 Group-C 1.2 (1.1–1.2) 1.2 (1.1–1.2) 0.9 (0.8–1.1)*, 0.9 (0.8–1.0)*, 1.1 (1.0–1.1) < 0.001
 Group-ANH 1.2 (1.1–1.2) 1.1 (1.1–1.2) 0.8 (0.7–0.9)*, 0.9 (0.8–0.9)*, 1.1 (0.9–1.1)* < 0.001
 P value 0.794 0.655 0.279 0.316 0.478 -
Osmolality (mOsm)
 Group-C 280 (274–285) 282 (276–286) 275 (270–283) 275 (270–278)*, 283 (282–290)§ < 0.001
 Group-ANH 277 (274–280) 279 (273–283) 272 (268–275) 271 (268–276) 290 (284–292)*,,§ < 0.001
 P value 0.264 0.229 0.183 0.225 0.295 -

Values are median (interquartile range). Group-C: patients in control group, Group-ANH: patients underwent ANH. T1: before ANH, T2: after ANH of 5 ml/kg or before the initiation of CPB, T3 and T4: 30 and 60 seconds after the initiation of CPB, T5: at the end of surgery.

* P < 0.05 vs. T1,

P < 0.05 vs. T2,

P < 0.05 vs. T3,

§ P < 0.05 vs. T4, and

P < 0.05 in inter-group comparison.

DISCUSSION

In addition to hemolysis, lack of pulsatility of the renal blood flow, and embolic events, hemodilution during the application of CPB can result in an increase in the s-Cr concentration by impairing oxygen delivery to an already hypoxic renal medulla and developing AKI in cardiac surgery [12]. S-Cr increases due to acute tubular necrosis and subsequent reduction in glomerular filtration rate (GFR), which results in 50% loss of glomerular function [12-14]. Contrarily, hemodilution itself can dilute s-Cr concentration and lead to underestimation of s-Cr. If this is the case, hemodilution can compromise the clinical relevancy of s-Cr measurements.
However, like the increased s-Cr, previous studies have indicated that the decline of s-Cr concentration can also have clinical importance and could be problematic; a mild reduction of postoperative s-Cr (< 0.3 mg/dl) was related with the lower mortality rate (2.1%) [14-16], and greater reduction (> 0.3 mg/dl) was related with increased mortality. The decline of s-Cr concentration (< 0.3 mg/dl) exerting protective effect seems to be mainly due to CPB-induced hemodilution in patients with “normal GFR” with constant creatinine excretion. A previous study also showed that even a modest decrease of s-Cr (< 0.5 mg/dl) is associated with increased risk of AKI, associated with increased mortality and a prolonged hospital stay [17].
Although repeated measurements of s-Cr concentration seems to be superior for detecting s-Cr increase, other methods employing a single measurement, such as the Risk, Injury, Failure, Loss of kidney function, and End-stage kidney disease or the acute kidney injury network (AKIN) classification, has been used for evaluating the risk of AKI and adverse postoperative outcomes after cardiac surgery [16]. Therefore, it may be critical to be aware of any clinical situations when single s-Cr value does not accurately reflect a patient’s renal function. Intraoperative hemodilution, volume therapy, and blood loss have the potential to affect intraoperative s-Cr measurement [18].
The present study showed that ANH-induced hemodilution, which replaces whole blood by 5% HES of 5 ml/kg, does not affect neither s-Cr values nor, consequently, compromise the clinical efficacy of s-Cr. Considering that the estimated blood volume is 60–65 ml/kg in women and 67–70 ml/kg in men [19], the degree of hemodilution was approximately 7–8% in Group-ANH.
However, the impact of ANH on s-Cr depends on the degree of hemodilution; contrary to the absence of s-Cr changes at application of ANH 5 ml/kg, s-Cr values were significantly reduced by the initiation of CPB, at which the degrees of hemodilution during the initial phase of CPB application was greater than 25%, even in Group-C. The implication is that, if the degree of hemodilution exceeds a certain degree, the degree of s-Cr dilution can be underestimated due to the misread of s-Cr values, and the clinical efficacy or relevance of s-Cr can be compromised.
In spite of the considerable hemodilution, the constant electrolytes seem to be due to the use of balanced crystalloid-based HES and CPB priming solution.

Limitations

We only evaluated the changes in s-Cr, although their single measurement could not provide more precise information compared with supplementation of other information such as blood urea nitrogen-to-creatinine ratio. Urine output data [20,21], including urinary-Cr for measuring Cr clearance, were not included in our study, since the times for urine collection after the completion of ANH before the initiation of CPB was limited, which was approximately 20–30 min [20,21].
Our data did not include values 48 hours after surgery, at which the postoperative increase of s-Cr is usually maximum in cardiac surgery [22].
We only appreciated s-Cr changes during intraoperative period with regard to ANH and CPB. The impact of ANH on the diagnosis of acute renal dysfunction was not evaluated. It may be worth investigating the effects of ANH on s-Cr and on perioperative renal failure diagnosis with a large sample size.
Further studies need to be performed to determine whether the extent of hemodilution affects the clinical relevancy of the s-Cr concentration in terms of determining and evaluating current kidney function.

REFERENCES

1. Bennett SR. Perioperative autologous blood transfusion in elective total hip prosthesis operations. Ann R Coll Surg Engl. 1994; 76:95–8. DOI: 10.1097/00132586-199412000-00057.
2. Bennett J, Haynes S, Torella F, Grainger H, McCollum C. Acute normovolemic hemodilution in moderate blood loss surgery: a randomized controlled trial. Transfusion. 2006; 46:1097–103. DOI: 10.1111/j.1537-2995.2006.00857.x. PMID: 16836555.
3. Berg KS, Stenseth R, Wahba A, Pleym H, Videm V. How can we best predict acute kidney injury following cardiac surgery?: a prospective observational study. Eur J Anaesthesiol. 2013; 30:704–12. DOI: 10.1097/EJA.0b013e328365ae64. PMID: 24067536.
4. Mangano CM, Diamondstone LS, Ramsay JG, Aggarwal A, Herskowitz A, Mangano DT. Renal dysfunction after myocardial revascularization: risk factors, adverse outcomes, and hospital resource utilization. The Multicenter Study of Perioperative Ischemia Research Group. Ann Intern Med. 1998; 128:194–203. DOI: 10.7326/0003-4819-128-3-199802010-00005. PMID: 9454527.
5. Jung HS, Kim CS, Kim TY. The relationship of serum creatinine and cardiac troponin I after off-pump coronary artery bypass graft surgery. Anesth Pain Med. 2009; 4:124–8.
6. Lee EH. Acute kidney injury in cardiac surgery. Anesth Pain Med. 2016; 11:225–35. DOI: 10.17085/apm.2016.11.3.225.
7. Akcan-Arikan A, Zappitelli M, Loftis LL, Washburn KK, Jefferson LS, Goldstein SL. Modified RIFLE criteria in critically ill children with acute kidney injury. Kidney Int. 2007; 71:1028–35. DOI: 10.1038/sj.ki.5002231. PMID: 17396113.
8. Bellomo R, Ronco C, Kellum JA, Mehta RL, Palevsky P. Acute renal failure - definition, outcome measures, animal models, fluid therapy and information technology needs: the Second International Consensus Conference of the Acute Dialysis Quality Initiative (ADQI) Group. Crit Care. 2004; 8:R204–12. DOI: 10.1186/cc2671. DOI: 10.1186/cc2872. PMID: 15312219. PMCID: PMC522841.
9. Mehta RL, Kellum JA, Shah SV, Molitoris BA, Ronco C, Warnock DG, et al. Acute Kidney Injury Network: report of an initiative to improve outcomes in acute kidney injury. Crit Care. 2007; 11:R31. DOI: 10.1186/cc5713. PMID: 17331245. PMCID: PMC2206446.
10. Parolari A, Pesce LL, Pacini D, Mazzanti V, Salis S, Sciacovelli C, et al. Risk factors for perioperative acute kidney injury after adult cardiac surgery: role of perioperative management. Ann Thorac Surg. 2012; 93:584–91. DOI: 10.1016/j.athoracsur.2011.09.073. PMID: 22269725.
11. Kumar AB, Suneja M, Bayman EO, Weide GD, Tarasi M. Association between postoperative acute kidney injury and duration of cardiopulmonary bypass: a meta-analysis. J Cardiothorac Vasc Anesth. 2012; 26:64–9. DOI: 10.1053/j.jvca.2011.07.007. PMID: 21924633.
12. Rosner MH, Okusa MD. Acute kidney injury associated with cardiac surgery. Clin J Am Soc Nephrol. 2006; 1:19–32. DOI: 10.2215/CJN.00240605. PMID: 17699187.
13. Bojan M, Lopez-Lopez V, Pouard P, Falissard B, Journois D. Limitations of early serum creatinine variations for the assessment of kidney injury in neonates and infants with cardiac surgery. PLoS One. 2013; 8:e79308. DOI: 10.1371/journal.pone.0079308. PMID: 24244476. PMCID: PMC3823616.
14. Waikar SS, Liu KD, Chertow GM. Diagnosis, epidemiology and outcomes of acute kidney injury. Clin J Am Soc Nephrol. 2008; 3:844–61. DOI: 10.2215/CJN.05191107. PMID: 18337550.
15. Lassnigg A, Schmid ER, Hiesmayr M, Falk C, Druml W, Bauer P, et al. Impact of minimal increases in serum creatinine on outcome in patients after cardiothoracic surgery: do we have to revise current definitions of acute renal failure? Crit Care Med. 2008; 36:1129–37. DOI: 10.1097/CCM.0b013e318169181a. PMID: 18379238.
16. Lassnigg A, Schmidlin D, Mouhieddine M, Bachmann LM, Druml W, Bauer P, et al. Minimal changes of serum creatinine predict prognosis in patients after cardiothoracic surgery: a prospective cohort study. J Am Soc Nephrol. 2004; 15:1597–605. DOI: 10.1097/01.ASN.0000130340.93930.DD. PMID: 15153571.
17. Chertow GM, Burdick E, Honour M, Bonventre JV, Bates DW. Acute kidney injury, mortality, length of stay, and costs in hospitalized patients. J Am Soc Nephrol. 2005; 16:3365–70. DOI: 10.1681/ASN.2004090740. PMID: 16177006.
18. Swaminathan M, Phillips-Bute BG, Conlon PJ, Smith PK, Newman MF, Stafford-Smith M. The association of lowest hematocrit during cardiopulmonary bypass with acute renal injury after coronary artery bypass surgery. Ann Thorac Surg. 2003; 76:784–91. DOI: 10.1016/S0003-4975(03)00558-7.
19. Gross JB. Estimating allowable blood loss: corrected for dilution. Anesthesiology. 1983; 58:277–80. DOI: 10.1097/00000542-198303000-00016. PMID: 6829965.
20. Cockcroft DW, Gault MH. Prediction of creatinine clearance from serum creatinine. Nephron. 1976; 16:31–41. DOI: 10.1159/000180580.
21. Edwards KD, Whyte HM. Plasma creatinine level and creatinine clearance as tests of renal function. Australas Ann Med. 1959; 8:218–24. PMID: 13819423.
22. Stafford-Smith M. Perioperative renal dysfunction: Implications and strategies for protection. Perioperative Organ Protection. Newman MF, editor. Richmond, Society of Cardiovascular Anesthesiologists. 2003; 89–124.
TOOLS
Similar articles