Abstract
Objectives.
Cochlear implant (CI) users typically report impaired ability to understand speech in noise. Speech understanding in CI users decreases with noise due to reduced temporal processing ability, and speech perceptual errors involve stop consonants distinguished by voice onset time (VOT). The current study examined the effects of noise on various speech perception tests while at the same time used cortical auditory evoked potentials (CAEPs) to quantify the change of neural processing of speech sounds caused by noise. We hypothesized that the noise effects on VOT processing can be reflected in N1/P2 measures, the neural changes relate to behavioral speech perception performances.
Methods.
Ten adult CI users and 15 normal-hearing (NH) people participated in this study. CAEPs were recorded from 64 scalp electrodes in both quiet and noise (signal-to-noise ratio +5 dB) and in passive and active (requiring consonant discrimination) listening. Speech stimulus was synthesized consonant-vowels with VOTs of 0 and 50 ms. N1-P2 amplitudes and latencies were analyzed as a function of listening condition. For the active condition, the P3b also was analyzed. Behavioral measures included a variety of speech perception tasks.
Results.
For good performing CI users, performance in most speech test was lower in the presence of noise masking. N1 and P2 latencies became prolonged with noise masking. The P3b amplitudes were smaller in CI groups compared to NH. The degree of P2 latency change (0 vs. 50 ms VOT) was correlated with consonant perception in noise.
Conclusion.
The effects of noise masking on temporal processing can be reflected in cortical responses in CI users. N1/P2 latencies were more sensitive to noise masking than amplitude measures. Additionally, P2 responses appear to have a better relationship to speech perception in CI users compared to N1.
Cochlear implants (CIs) provide hearing sensation by directly stimulating the auditory nerve in people with severe to profound hearing loss. Once postlingually deafened people start using a CI, their speech perception improves significantly over a short period of time [1,2]. However, although they have good speech perception under quiet conditions, CI users still often report impaired ability to understand speech with background noise. Indeed, a consistent background noise can affect central auditory processing in children that may impair normal language and speech development [3].
An everyday listening environment typically involves some degree of noise. Background noise can interfere with speech and language comprehension, especially in children and hearing-impaired listeners. Furthermore, speech-in-noise (SiN) perception is substantially variable for CI users whose speech perception is considerably affected by noise [4]. It is known that limited spectral and temporal information delivered through a CI yields decreased SiN perception in CI users [4-6]. According to behavioral studies, the hearing threshold has shown a poor relationship with SiN perception, indicating that the latter may not be accomplished by peripheral hearing sensitivity per se, rather a growing body of literature suggests that the variability in SiN perception is more related to central auditory processing [7,8]. However, previous cortical auditory evoked potential (CAEP) studies have reported mixed results of the noise effect on central processing. For example, when N1 and P2 were evoked by speech sounds, the amplitudes of both responses decreased with noise [9,10]. On the other hand, an enhancements of N1 and P2 in background noise were also reported [11,12].
An understanding of how noise change cortical temporal processing in adult CI users is clinically important because therapeutic programs focusing on background noise may increase the benefit of auditory training. In adult CI recipients, targeted auditory training for SiN perception was effective in improving speech and music recognition regardless of their speech performance [13]. Indeed, for postlingually deafened adult CI users, auditory training with background noise significantly improved speech perception in noise, and the training effect was generalized to more difficult listening conditions [14]. To provide more objective evidence for these findings, the aim of the current study was to investigate the cortical activity change as a function of noise in adult CI users. In particular, we examined the noise effects on the CAEPs in adult CI users in order to measure the noise-induced change in CAEPs and its relationship with behavioral speech perception. Previously, we examined auditory cortical activities to different voice onset times (VOTs) in quiet listening [15]. In that study, we found that P2 latency was increased with an increase in VOT, and that the P2 amplitude was smaller in CI users compared to the normal-hearing (NH) group. In addition, scalp-recorded and dipole N1/P2 measures were significantly correlated with behavioral perception. In the current study, CAEPs were evoked by consonant-vowel (CV) syllables in the presence of noise masking in both passive and active conditions in order to compare these listening conditions and to examine the relation of N1/P2 amplitudes and latencies with behavioral speech in noise perception scores in CI users.
We recruited 10 adult CI users (four males, all right-handed) according to an Institutional Review Board at Cincinnati Children’s Hospital Medical Center-approved protocol (IRB No. 2013-0105). Their age range was from 32 to 74 years (mean, 49.6 years). All CI participants were monolingual speakers of American English and were required to wear their CI for 1 year or more at the time of electroencephalography (EEG) recording as it takes at least a year to adjust to devices. Table 1 shows the demographics of the CI users and NH participants. For intra-subject comparison, we classified CI participants as either “good” or “poor” performers according to a composite score. A composite speech perception score was performed by taking the average score (percent correct) for all of the speech perception measures in noise (i.e., vowels, consonants, and speech perception in noise test terminal words). A composite score yielded a bimodal distribution and was the basis for classifying the participants as either “good” or “poor” performers. There were six good performers with composite speech perception scores above 50% and four poor ones with scores below 50%. For the control group, 15 NH subjects (five males, all right-handed) aged 20 to 66 years old (mean, 45.6 years old) were participated. All NH subjects had normal hearing thresholds (i.e., <20 dB HL) at octave frequencies between 250 and 8,000 Hz. All participants submitted their informed consent before taking part in the study.
We used synthesized CVs speech stimuli with different VOT duration. The VOT values in the syllables were 0 and 50 ms (Fig. 1). The steady-state portion of the stimuli, the vowel /a/, was different in duration relative to the VOT to maintain the overall duration of 180 ms. For noise conditions, speech shaped noise with an signal-to-noise ratio of +5 dB was added to the speech stimuli. Note that the noise was always present through the entire EEG recording. The interstimulus interval was 1.5 ms, and the interstimulus interval was fixed during the whole experiment. Stimulus presentation was conducted by a customized Matlab/ TDT (Tucker-Davis Technologies, Alachua, FL, USA) RP5 system that controlled for EEG synchronization with the sound. The stimuli were calibrated using a Brüel and Kjær (2260 Investigator, Nærum, Denmark) sound level meter.
All subjects participated in the tasks for passive (inattentive) and active (attentive) listening conditions separately. For the passive conditions, subjects were seated in a comfortable reclining chair and watched a silent, closed-captioned movie of their choice while stimuli were presented in the background through a loud speaker at 0° azimuth 1.5 m. During the recording, they were alert and calm. For the active condition, participants indicated which sound they heard between ba and pa by pressing a labeled button. In general, 0 and 50 ms VOTs are perceived as /ba/ and /pa/, respectively. Both procedures occurred in noise conditions, and passive conditions always followed active conditions. After familiarization with the task, participants began with tasks under active conditions. A total of 200 trials for each VOT stimulus were presented to the NH subjects in 2 blocks and 1 blocks for both the active and passive conditions, respectively. For CI users, a minimum of 400 trials per VOT were presented in 4 blocks and 2 blocks for both the active and passive listening conditions to ensure good signal to noise ratios. Sound intensity was at a “loud but comfortable” level for CI users, while sounds were presented at 70 dB HL for NH. Electrode positions were determined for each subject using a Polhemus FastTrak 3D digitizer. The total EEG recording time was approximately 30 minutes for NH and 1 hour for CI participants. Note that this study was conducted as a part of our previous VOT study [15]. In this paper, we focused on the noise effect of VOT processing.
Behavioral testing was identical to our previous VOT study [15]. All sounds were presented via one speaker 1.5 m away at 0° azimuth. The intensity was presented at a “loud but comfortable” level determined using a bracketing approach.
A 64-channel actiCHamp Brain Products recording system was used to collect electrophysiological data. Electrode placements consisted of equidistant electrodes. Signals were digitized at 5,000 Hz and stored later for offline analysis. Continuous EEG data were analyzed using Brain Vision Analyzer 2.0. Data were band-pass filtered and down sampled to 512 Hz samples per second. Independent component analysis (ICA; infomax algorithm) [16] was performed to remove artifacts such as eye blinks/movement, electrocardiogram, and CI-related artifacts (see “data processing” section in Han et al. [15] for more details). On average, less than five ICs have been rejected for all subject. Also, more than 90% of acquired trails have been used for peak analysis. After ICA artifact correction, the data were low-pass filtered at 20 Hz and segmented from –200 to 1,500 ms with 0 ms at the onset of the sound. Segments containing peak amplitudes greater than 150 µV were removed. Separate averages of individual conditions were performed. Subsequent peak detection was performed for N1/P2 on frontal central electrodes, and P3b on parietal electrodes.
An independent samples t-test was used to compare each behavioral test as well as reaction time between good and poor performing CI groups. For the EEG recordings, mixed model analysis of variance (ANOVA) was performed to examine the effect of noise (quiet/noise), attention (active/passive), and subject group (poor performing CI vs. good performing CI vs. NH) on amplitudes and latencies for N1, P2, and P3b components. Post-hoc comparisons were conducted using Tukey’s honest significant difference (HSD) test. To examine correlations between N1/P2 responses and behavioral speech perception performance, each physiological measure was compared to speech perception scores using Spearman rank order correlations.
Fig. 2 shows speech perception under noise conditions for the good and poor performing CI groups. An independent samples t-test was conducted to compare two groups. For the good performing CI group, differences between the quiet and noise conditions were observed for most of the speech perception tests, including sentence [t(10)=4.4, P<0.05], wordtotal [t(10)=2.9, P<0.05], wordhigh [t(10)=3.6, P<0.05], consonant [t(10)=4.2, P<0.05], and composite scores [t(10)=5.2, P<0.05]. However, in the poor performing CI group, only wordhigh [t(6)=2.9, P<0.05] was significantly different between the quiet and noise listening conditions.
The time waveforms to 0 ms VOTs under quiet and noise conditions, each with passive and active listening, are shown in Fig. 3. For the NH group, the topography of N1 appeared to be greater under noise conditions than quiet ones, while P2 activity under noise conditions was smaller than quiet conditions as shown in Fig. 4. In good CI group, the N1 in noise condition was comparable to that in quiet condition, while the P3b were greater in quiet than in noise. However, no noticeable activities for all responses were revealed in poor CI group.
A repeated measures ANOVA (NH/good CI/poor CI×noise/quiet) revealed a significant group effect for N1 amplitude [F(2, 21)=4.01, P=0.033]. A post-hoc test showed that the N1 amplitudes in NH were greater than those in poor CI performers (P=0.036), while no difference was found with good CI performers. No differences in N1 amplitude were observed for quiet vs. noise. For P2 amplitude, a significant group×noise interaction [F(2, 21)=5.3, P=0.014] were revealed such that the P2 amplitudes in NH group during quiet listening were greater compared quiet (P=0.002) and noise (P=0.01) in good CI group, quiet (P=0.004) and noise (P=0.001) in poor CI group, and noise condition (P=0.001) in NH group. For the P3b, a repeated measures ANOVA revealed significant main effects of group [F(2, 18)=9.7, P=0.001] and noise [F(1, 18)=12.3, P=0.002]. A post-hoc test showed that the P3b amplitudes in the NH group were larger compared to both CI groups (both P=0.006), and P3b amplitudes to noise were smaller than those under quiet conditions (P=0.001).
Regardless of subject group, N1 and P2 latencies were prolonged with noise masking under both passive and active conditions. For N1 latency, a repeated measures ANOVA revealed significant main effects of group [F(2, 20)=6.2, P=0.008] and noise [F(1, 20)=54.2, P≤0.001]. Similarly, significant main effects of group [F(2, 20)=6.5, P=0.006] and noise [F(1, 21)=70, P≤0.001] were also found for P2 latency. Tukey’s HSD post-hoc tests showed that the N1/P2 latencies in NH were shorter compared to good CI performers, and the N1/P2 latencies to noise were longer compared to quiet (P<0.01). No N1/P2 latency differences were found between good and poor CI groups. In addition, there was a significant noise×attention interaction [F(1, 20)=6.0, P=0.023] for N1 latency. The N1 latencies in passive condition were shorter than those in active condition for both quiet and noise listening. Also, under passive listening, the N1 latency in noise condition was prolonged compared to quiet listening (all P<0.05). For P2 latency, a significant main effect of attention was found [F(1, 22)=4.2, P=0.049]. A post-hoc test revealed that the P2 latency increased with attention (P<0.05).
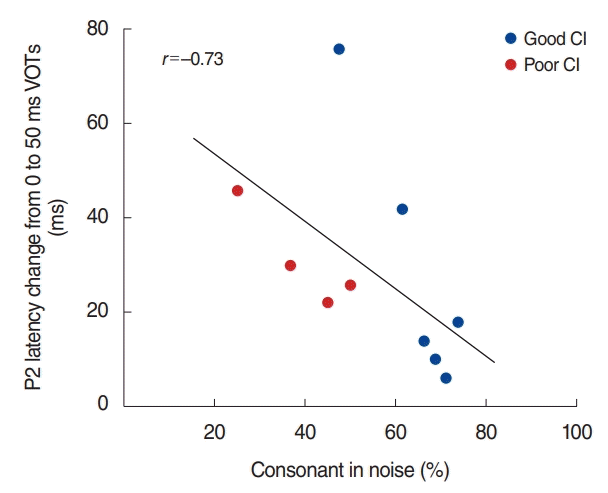
We examined the relationships between speech perception and the N1/P2 responses to a VOT by means of looking at the difference between the N1/P2 response to the extremes (i.e., the difference between 0 and 50 ms VOT). Spearman’s rank correlation was revealed the differences in P2 latency in noise condition were negatively correlated with consonant in the noise perception scores (percent corrects for consonant in noise test, ρ= –0.73; P<0.05). The significant relationship is plotted in Fig. 5. None of N1 measures revealed significant relationships with speech perception scores.
The aim of this study was to characterize noise induced neural change during a VOT discrimination task in both passive and attentive listening. We observed: (1) N1/P2 latencies increased with noise masking while no changes in amplitude were observed, (2) N1/P2 latencies increased with attention, (3) only P2 latency showed a significant correlation with consonant perception.
We compared neural activities from both quiet and noise listening when participants were presented with CV stimuli varied in VOT duration. During noise listening, N1/P2 latencies were increased for all groups. Previous studies have reported that listening in noise increases N1 amplitude and the increased response may reflect neural representations of the top-down control for an increased sensory gain [9,17,18]. It is known that peak amplitude is significantly affected by the magnitude and synchronization of neural activation whereas the latency is more related to neural conduction and processing time [19]. Thus, the N1 latency increase with noise observed in our study would be due to increased processing time for a cognitively demanding discrimination task requiring more time to process.
In general, when a stimulus is presented with noise, the cortical responses are decreased and delayed, as shown in previous studies using various types of stimuli such as tone [20], harmonic complex [21], and speech [11,22]. However, recent studies that have used speech stimuli have shown that the latency would reflect the effect of noise on cortical activity better than the amplitude measure. For example, in a study using a stimulus with different VOTs, N1 latency to speech sounds with a long VOT was increased with noise [10]. Moreover, another study using a /da/ sound showed that N1 and P2 latencies were increased with noise at all loudness levels from soft to loud, but N1 amplitude was decreased only at a soft loudness level [23]. In that study, it was demonstrated that the amplitude measure was more complex and variable depending on the noise level whereas N1 latency change was straightforward. Therefore, our results on latency change with noise complement these previous studies by suggesting that the latency measures were more efficient for reflecting neurophysiological changes caused by noise.
A group difference was found in the P3b amplitude such that P3b in the NH group was significantly larger compared to the CI groups. Similar to our finding, previous CI studies have reported an attenuation of P3b responses in CI subjects. For example, in a series of studies, Henkin et al. [24-26] have shown that in postlingual CI users, P3 amplitude was decreased and latency was increased as acoustic cues decreased and cognitive demands increased. P3 likely reflects the inhibitory activity of auditory neurons, which is supported by the finding that the magnitude of P3 was significantly decreased in response to irrelevant sounds during a sound discrimination task [27,28]. Thus, we assumed that smaller P3b responses in CI users would reflect reduced neural synchrony for inhibitory control during acoustically demanding listening tasks. Meanwhile, the P3b was sensitive to training-related changes and temporal variations. A previous study has shown that improved performance following auditory training was related to increased amplitude of the P3b observed over the parieto-occipital region. However, this increase of P3b was revealed for speech stimulus, but not for noise stimulus [29]. In a task discriminating temporally-structured patterns, the P3b (also known as late positive complex) was larger in listeners who were better at detecting temporal change [30], which suggests that decreased P3b amplitudes is associated with temporal processing deficits of CI users.
For CI users, paying attention to sound is one solution to enhance SiN perception. Previously, in both CI users and the NH group, the attentional modulation of auditory cortical responses has been revealed during SiN perception [31,32]. In people with hearing impairment and CIs, aural rehabilitation focusing on attention-induced change has been effective in improving speech understanding with background noise [14,33]. A number of studies comparing the cortical responses recorded from passive and active listening reported that N1 and P2 amplitudes increased with attention [9,34,35]. Nonetheless, we found that the effect of attention reflected in the N1/P2 latencies, not in amplitudes. In this study, we applied a sustained attention paradigm, which requires continuous focus on stimuli without being distracted, while a selective attention paradigm requiring paying attention to a specific sound selectively has been widely employed in other studies. For instance, Choi et al. [32] have applied a selective attention paradigm where participants actively engaged in an auditory judgement task, and they reported that N1 response to ignored stimuli was suppressed, but enhanced for attended stimuli. On the other hand, participants in our study selected either /ba/ or /pa/ exclusively, thereby revealed no N1 amplitude change with attention. This indicates that a different attention mechanism may stimulate different brain areas and yields distinct patterns of cortical activation.
In this study, we examined relationships of CAEPs to VOT stimuli by quantifying N1/P2 as a function of VOT via looking at the difference between the N1/P2 responses to the extremes (50 vs. 0 ms VOT) in order to see if N1/P2 response has a predictive power of speech perception for CI users. As we expected, our results show that P2 latency change with VOT (50 vs. 0 ms) was correlated with consonant in noise perception, and this supports that P2 latency changes can be a marker for speech perception in CI users. Previously, it was found that the P2 changes as a function of VOT were significantly related to behavioral speech perception performance in CI users [15]. Thus, our finding confirmed that the P2 measures would be more applicable to predict CI user’s speech perception abilities than the N1. It is known that the N1 is dominated by stimulus acoustic characteristics such as frequency and amplitude of the speech envelope, while P2 is related to learning-related changes [36]. Therefore, we assumed that more active CI learners were better performers, and their P2 latencies were shorter, regardless of VOT duration.
▪ The effects of noise masking on temporal processing can be reflected in cortical responses in cochlear implant (CI) users.
▪ N1/P2 measures to voice onset time stimuli with noise masking may serve to differentiate between good and poor performing users.
▪ P2 responses appear to have a better overall relationship to speech perception in CI users compared to N1.
ACKNOWLEDGMENTS
This project was supported by Basic Science Research Program through the National Research Foundation of Korea (NRF) funded by the Ministry of Education (2017R1D1A1B03030613 & 2019R1A2B5B01070129), the Center for Women in Science, Engineering and Technology (WISET) Grant funded by the Ministry of Science ICT & Future Planning of Korea (MSIP) under the Program for Returners into R&D (WISET-2019-252), and by the Hallym University Research Fund (HURF), Republic of Korea.
REFERENCES
1. Ponton CW, Don M, Eggermont JJ, Waring MD, Masuda A. Maturation of human cortical auditory function: differences between normal-hearing children and children with cochlear implants. Ear Hear. 1996; Oct. 17(5):430–7.

2. Rouger J, Lagleyre S, Fraysse B, Deneve S, Deguine O, Barone P. Evidence that cochlear-implanted deaf patients are better multisensory integrators. Proc Natl Acad Sci U S A. 2007; Apr. 104(17):7295–300.

3. Niemitalo-Haapola E, Haapala S, Jansson-Verkasalo E, Kujala T. Background noise degrades central auditory processing in toddlers. Ear Hear. 2015; Nov-Dec. 36(6):e342–51.

4. Fu QJ, Nogaki G. Noise susceptibility of cochlear implant users: the role of spectral resolution and smearing. J Assoc Res Otolaryngol. 2005; Mar. 6(1):19–27.

5. Hopkins K, Moore BC. The contribution of temporal fine structure to the intelligibility of speech in steady and modulated noise. J Acoust Soc Am. 2009; Jan. 125(1):442–6.

6. Won JH, Drennan WR, Rubinstein JT. Spectral-ripple resolution correlates with speech reception in noise in cochlear implant users. J Assoc Res Otolaryngol. 2007; Sep. 8(3):384–92.

7. Anderson S, White-Schwoch T, Parbery-Clark A, Kraus N. A dynamic auditory-cognitive system supports speech-in-noise perception in older adults. Hear Res. 2013; Jun. 300:18–32.

8. Bidelman GM, Howell M. Functional changes in inter- and intra-hemispheric cortical processing underlying degraded speech perception. Neuroimage. 2016; Jan. 124(Pt A):581–90.

9. Zhang C, Lu L, Wu X, Li L. Attentional modulation of the early cortical representation of speech signals in informational or energetic masking. Brain Lang. 2014; Aug. 135:85–95.

10. Dimitrijevic A, Pratt H, Starr A. Auditory cortical activity in normal hearing subjects to consonant vowels presented in quiet and in noise. Clin Neurophysiol. 2013; Jun. 124(6):1204–15.

11. Parbery-Clark A, Marmel F, Bair J, Kraus N. What subcortical-cortical relationships tell us about processing speech in noise. Eur J Neurosci. 2011; Feb. 33(3):549–57.

12. Rao A, Zhang Y, Miller S. Selective listening of concurrent auditory stimuli: an event-related potential study. Hear Res. 2010; Sep. 268(1-2):123–32.

13. Fu QJ, Galvin JJ 3rd. Maximizing cochlear implant patients’ performance with advanced speech training procedures. Hear Res. 2008; Aug. 242(1-2):198–208.

14. Oba SI, Fu QJ, Galvin JJ 3rd. Digit training in noise can improve cochlear implant users’ speech understanding in noise. Ear Hear. 2011; Sep-Oct. 32(5):573–81.

15. Han JH, Zhang F, Kadis DS, Houston LM, Samy RN, Smith ML, et al. Auditory cortical activity to different voice onset times in cochlear implant users. Clin Neurophysiol. 2016; Feb. 127(2):1603–17.

16. Delorme A, Makeig S. EEGLAB: an open source toolbox for analysis of single-trial EEG dynamics including independent component analysis. J Neurosci Methods. 2004; Mar. 134(1):9–21.

17. Picton TW, Hillyard SA. Human auditory evoked potentials. II. Effects of attention. Electroencephalogr Clin Neurophysiol. 1974; Feb. 36(2):191–9.

18. Toscano JC, McMurray B, Dennhardt J, Luck SJ. Continuous perception and graded categorization: electrophysiological evidence for a linear relationship between the acoustic signal and perceptual encoding of speech. Psychol Sci. 2010; Oct. 21(10):1532–40.
19. Tremblay K, Ross B. Effects of age and age-related hearing loss on the brain. J Commun Disord. 2007; Jul-Aug. 40(4):305–12.

20. Bertoli S, Smurzynski J, Probst R. Effects of age, age-related hearing loss, and contralateral cafeteria noise on the discrimination of small frequency changes: psychoacoustic and electrophysiological measures. J Assoc Res Otolaryngol. 2005; Sep. 6(3):207–22.

21. Alain C, Roye A, Salloum C. Effects of age-related hearing loss and background noise on neuromagnetic activity from auditory cortex. Front Syst Neurosci. 2014; Jan. 8:8.

22. Shtyrov Y, Kujala T, Ilmoniemi RJ, Naatanen R. Noise affects speechsignal processing differently in the cerebral hemispheres. Neuroreport. 1999; Jul. 10(10):2189–92.

23. Sharma M, Purdy SC, Munro KJ, Sawaya K, Peter V. Effects of broadband noise on cortical evoked auditory responses at different loudness levels in young adults. Neuroreport. 2014; Mar. 25(5):312–9.

24. Henkin Y, Kileny PR, Hildesheimer M, Kishon-Rabin L. Phonetic processing in children with cochlear implants: an auditory event-related potentials study. Ear Hear. 2008; Apr. 29(2):239–49.

25. Henkin Y, Tetin-Schneider S, Hildesheimer M, Kishon-Rabin L. Cortical neural activity underlying speech perception in postlingual adult cochlear implant recipients. Audiol Neurootol. 2009; 14(1):39–53.

26. Henkin Y, Yaar-Soffer Y, Steinberg M, Muchnik C. Neural correlates of auditory-cognitive processing in older adult cochlear implant recipients. Audiol Neurootol. 2014; 19 Suppl 1:21–6.

27. Groenen PA, Beynon AJ, Snik AF, van den Broek P. Speech-evoked cortical potentials and speech recognition in cochlear implant users. Scand Audiol. 2001; 30(1):31–40.
28. Beynon AJ, Snik AF, Stegeman DF, van den Broek P. Discrimination of speech sound contrasts determined with behavioral tests and eventrelated potentials in cochlear implant recipients. J Am Acad Audiol. 2005; Jan. 16(1):42–53.

29. Alain C, Campeanu S, Tremblay K. Changes in sensory evoked responses coincide with rapid improvement in speech identification performance. J Cogn Neurosci. 2010; Feb. 22(2):392–403.

30. Snyder JS, Pasinski AC, McAuley JD. Listening strategy for auditory rhythms modulates neural correlates of expectancy and cognitive processing. Psychophysiology. 2011; Feb. 48(2):198–207.

31. Dimitrijevic A, Smith ML, Kadis DS, Moore DR. Cortical alpha oscillations predict speech intelligibility. Front Hum Neurosci. 2017; Feb. 11:88.

32. Choi I, Rajaram S, Varghese LA, Shinn-Cunningham BG. Quantifying attentional modulation of auditory-evoked cortical responses from single-trial electroencephalography. Front Hum Neurosci. 2013; Apr. 7:115.

33. Schumann A, Hast A, Hoppe U. Speech performance and training effects in the cochlear implant elderly. Audiol Neurootol. 2014; 19 Suppl 1:45–8.

34. Snyder JS, Alain C, Picton TW. Effects of attention on neuroelectric correlates of auditory stream segregation. J Cogn Neurosci. 2006; Jan. 18(1):1–13.

Fig. 1.
Acoustic of stimuli consisted of consonant-vowel syllables with 0 and 50 ms VOTs. The total duration of stimulus was 180 ms, and it was presented in quiet (upper) and noise (bottom) listening conditions. VOT, voice onset time.
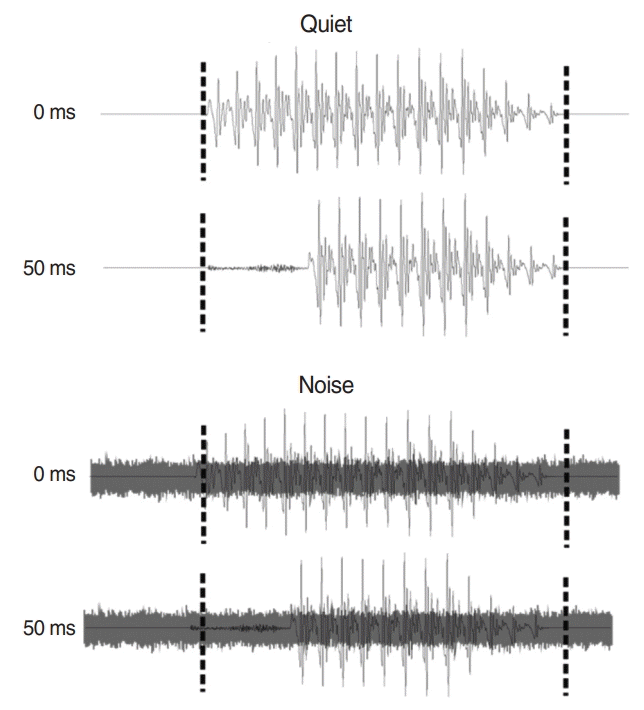
Fig. 2.
Speech perception in noise for good cochlear implant (CI) users (A) and poor CI users (B). (A) All tests except Wordlow were significantly different between quiet and noise condition for good CI users. (B) Only Wordhigh was significantly different between quiet and noise condition for poor CI users. Error bars are standard deviation (*P<0.05, **P<0.01).
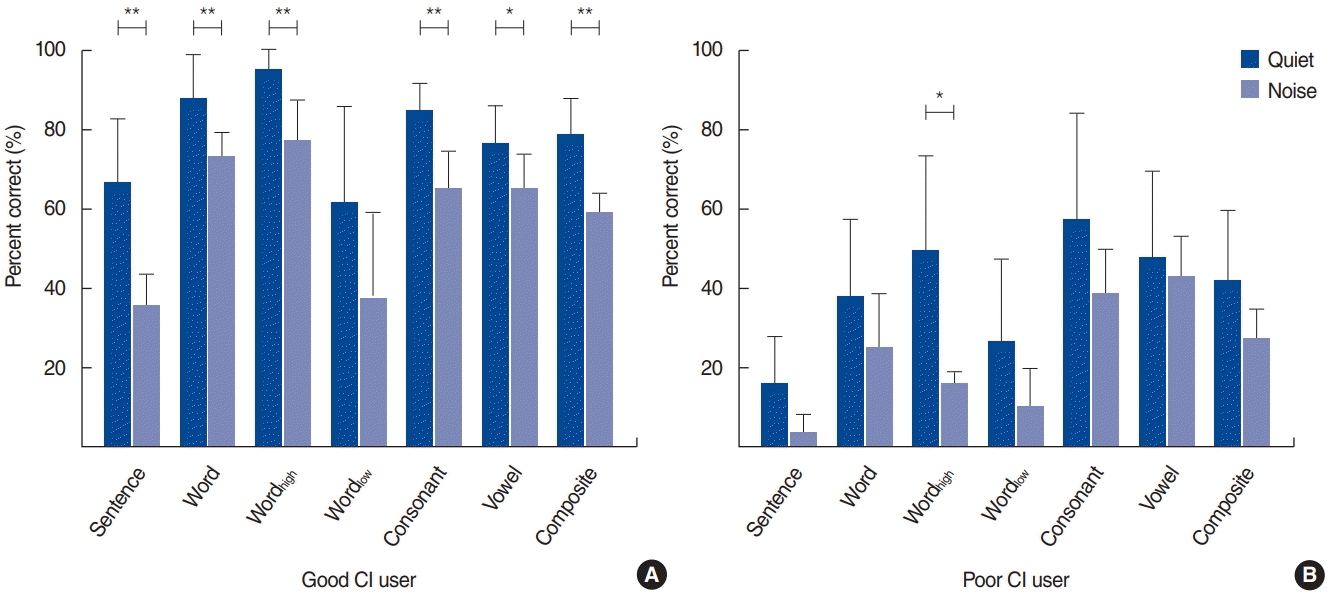
Fig. 3.
Grand mean waveforms to a consonant-vowel with 0 ms VOT with and without noise masking for normal-hearing (NH) participants, good cochlear implant (CI) performers, and poor CI performers during passive (upper) and active (lower) listening conditions. N1/P2 and P3 responses were recorded from fronto-central (left) and parietal (right) electrodes, respectively. VOT, voice onset time.
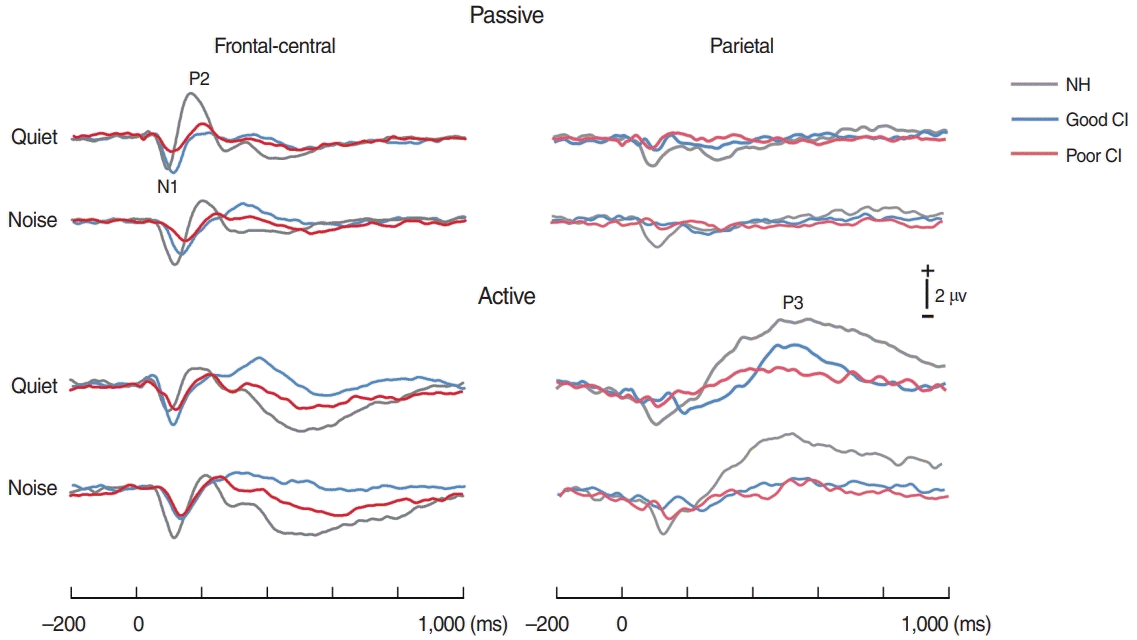
Fig. 4.
Topography of the N1, P2, and P3b responses under quiet and noise conditions for the normal-hearing (NH) and good and poor performing cochlear implant (CI) groups. The top row shows the N1 topographies for quiet/noise listening. The second row shows the topographies of P2. Note the greater (more positive) responses under quiet than noise conditions in the NH group whereas no difference was shown in CI groups. The bottom row shows the topographies of P3b measured under active condition. Note the greater P3b shown in NH group compared to both CI groups.
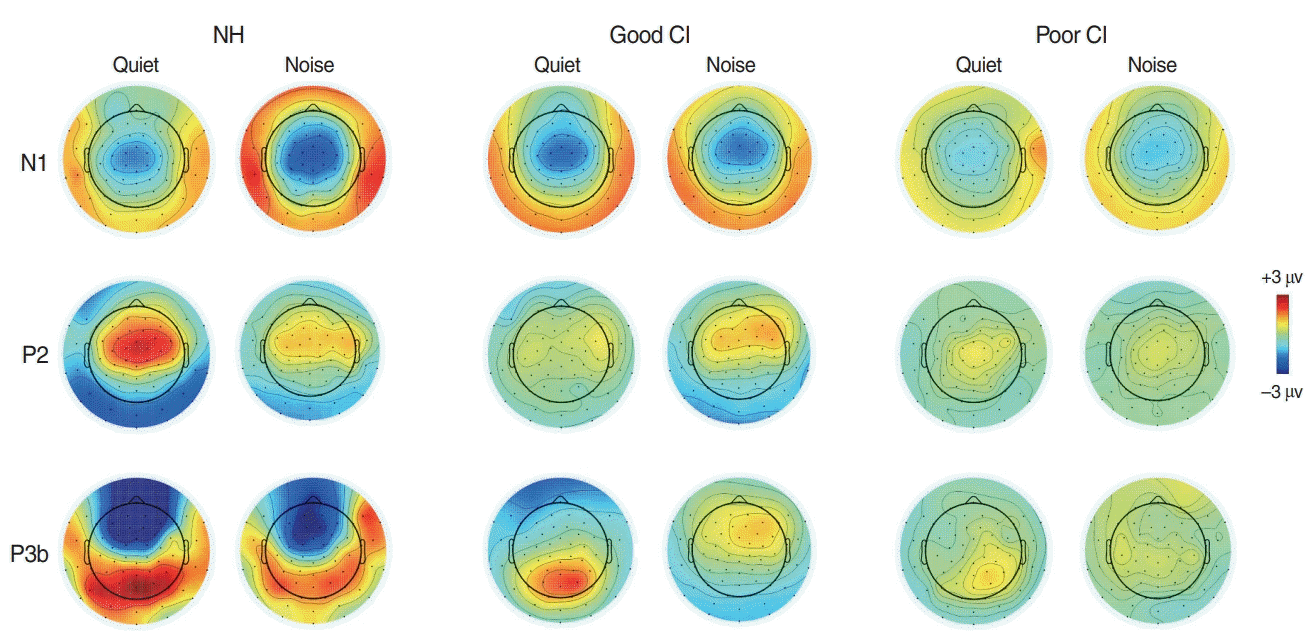
Fig. 5.
Significant Spearman rank correlation between the P2 latency difference (0 vs. 50 ms VOT) and consonant in noise perception. Note that consonant in noise performances were better as the differences in P2 latency were smaller. VOT, voice onset time; CI, cochlear implant.


 PDF
PDF Citation
 Print
Print


 XML Download