Abstract
Objectives
Speech perception abilities, which vary widely among cochlear implant (CI) users, are considered to be associated with the integrity of the central auditory pathways from the auditory nerve to the cortex. Therefore, auditory evoked potentials (AEPs) are used to evaluate central auditory processing, which is thought to contribute to speech perception in CI subjects. In AEPs, the P300 component reflects the cognitive ability of subjects to detect and respond to stimuli and has most frequently been used and investigated in CI subjects. Other studies have used mismatched negativity (MMN) to examine central auditory processing. It is important to compare MMN and P300 and examine the auditory processing mechanisms involved in these components. Our study therefore aimed to investigate the relationship between P300 and MMN using both active and passive hearing paradigms in CI and normal hearing (NH) subjects.
Methods
Our subjects consisted of 3 CI subjects and 3 NH subjects. An oddball paradigm was used to deliver the stimuli on both components. The frequent stimuli were 1,000-Hz tone bursts, whereas the rare stimuli were 1,500, 2,000, and 4,000-Hz.
Results
As the frequency contrasts increased, the P3 latencies increased in the CI subjects. However, the latency in NH subjects did not change significantly across the frequency contrast conditions. MMNs were identified for both the CI and NH subjects; the latencies in the CI subjects were longer than those in the NH subjects. However, there were no differences in the latencies of either the CI or NH subjects in the 3 frequency contrast tasks.
Conclusion
Our results indicated that different auditory processing pathways are involved in the active and passive hearing conditions based on the P300 and MMN data and that a combination of both responses plays an important role in the comprehension of auditory processing mechanisms in CI subjects.
Speech perception abilities vary widely among cochlear implant (CI) users. These abilities are considered to be associated with the integrity of the central auditory pathways from the auditory nerve to the cortex. Therefore, auditory evoked potentials (AEPs) are used to evaluate central auditory processing, which is thought to contribute to speech perception in CI subjects (1).
Several studies have attempted to investigate the differences between CI subjects and normal hearing (NH) subjects using AEPs (2-4). In AEPs, the P300 component reflects the cognitive ability of subjects to detect and respond to stimuli and has most frequently been used and investigated in CI subjects. Oviatta and Kileny (2) showed that CI subjects exhibited prolonged latency and reduced amplitude of the P3 component as compared to NH subjects. They also observed that in CI subjects, P3 latencies were longer for the 500-1,000 Hz signal contrasts than those for the 500-2,000 Hz and 500-3,000 Hz signal contrasts. That is, in CI subjects, P3 components toward difficult-to-discriminate contrasts had longer latencies than those toward easy-to-discriminate contrasts. A similar tendency has been indicated in previous AEP studies using speech stimuli (5). Several studies have also indicated a relationship between P3 latencies and speech perception in CI subjects. Further, Kelly et al. (3) demonstrated that poorer CI performance in speech intelligibility tests were associated with poorer responses in AEPs.
Other studies have used mismatched negativity (MMN) to examine central auditory processing in CI subjects (3, 6, 7). In contrast to P300, MMN is considered to reflect the pre-attentive detection of the differences between the neural representations of the standard stimuli in memory and the deviant stimuli in the sensory input (8). Zhang et al. (7) found that good performers in a speech perception task displayed large MMN responses, while moderate-to-poor performers had small or absent responses. Kileny et al. (6) demonstrated significant correlations between P3 and MMN. It is therefore important to compare MMN and P300 and examine the auditory processing mechanisms involved in these components. However, most studies that have compared MMN and P300 employed an active hearing paradigm, for which the subject had to listen to rare stimuli, with MMN and P300 being recorded simultaneously. However, we consider that the paradigm for deriving MMN waveforms should involve passive hearing.
Therefore, our study aimed to investigate the relationship between P300 and MMN using both active and passive hearing paradigms in CI and NH subjects. Furthermore, we have herein discussed the differences in the central auditory processing in the 2 hearing paradigms.
Our subjects consisted of 3 CI subjects (age range, 45 to 65 years) using the Nucleus CI 24 system (Cochlear Ltd., New South Wales, Australia) with advanced combinational encoder (ACE) processing strategy. They were postlingually deafened and had no history of neurological trauma. Additional subject data has been provided in Table 1.
Further, 3 age-matched and NH adults served as control subjects. They were evaluated prior to the experiment to measure their normal hearing thresholds.
Two types of AEPs were recorded as follows: P300 under the active hearing condition and MMN under the passive hearing condition, and a Nihon Kohden Neuropack MEB-9204 (Nihon Kohden Co., Tokyo, Japan) was used for generating acoustic stimuli and recording evoked potentials.
An oddball paradigm was used to deliver the tonal bursts. The frequent stimuli comprised 1,000-Hz tone bursts, whereas the rare stimuli included 1,500, 2,000, and 4,000-Hz tone bursts. The ratio of frequent to rare stimuli was 80:20, and 150 stimuli were presented in a random order. Prior to the electrophysiological studies, it was established that each subject could comfortably detect all the stimuli. The stimuli were presented at 85 dBSPL through a loudspeaker placed at ear level and 80 cm from the microphone of the sound processor of the CI subject. NH subjects were stimulated monaurally via headphones to the right or left ear at 70 dBSPL. All stimuli were delivered at a rate of 1/second.
The electrophysiological activity was recorded from 3 different positions: Cz (coronal midline), Fz (forehead midline), and Cl or Cr (halfway left or right between the meatus contralateral to the implanted ear and Cz) electrode sites. A ground electrode was placed on the tip of the nose. Impedances were maintained below 3 kΩ. Artifacts were automatically rejected at ±50 µV, and the band pass filter was set at 0.2-50 Hz.
The subjects were seated in a comfortable chair. In the active condition, the subjects were instructed to close their eyes but stay awake and push a button when the rare stimulus was heard. In the passive condition, the test stimuli were presented in the same way as P300. However, the subjects watched a DVD movie with its sound turned off and did not listen to the test stimuli via loudspeaker.
Responses to frequency and rare stimuli were averaged and recorded separately. Latencies and amplitudes of P3 components were investigated. P300 components were obtained from the response to the deviant stimulus by determining the maximum positive wave after N2. The MMN was measured from a difference wave obtained by subtracting the response to the standard from the response to the deviant stimulus.
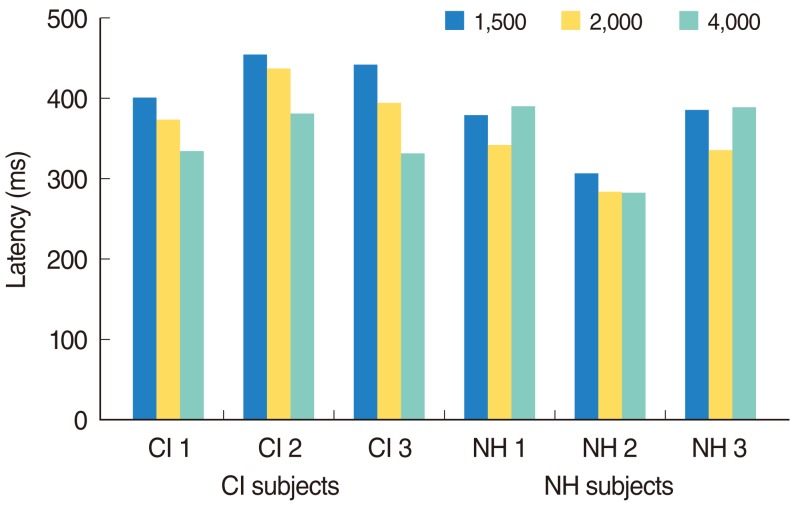
The individual P3 latencies at the Cz electrode in the 3 frequency contrast tasks, 1,000-1,500 Hz signal contrast, 1,000-2,000 Hz signal contrast, 1,000-4,000 Hz signal contrast tasks, are presented in Fig. 1. Both CI and NH subjects could discriminate between the 2 different pitch tones, and the response accuracy was 100% in all frequency tasks. However, the P3 latencies for CI subjects were longer than those for the NH subjects, particularly in the small contrast task. Furthermore, as the frequency contrasts increased, the P3 latencies increased in the CI subjects. However, the latency in NH subjects did not change significantly across the frequency contrast conditions.
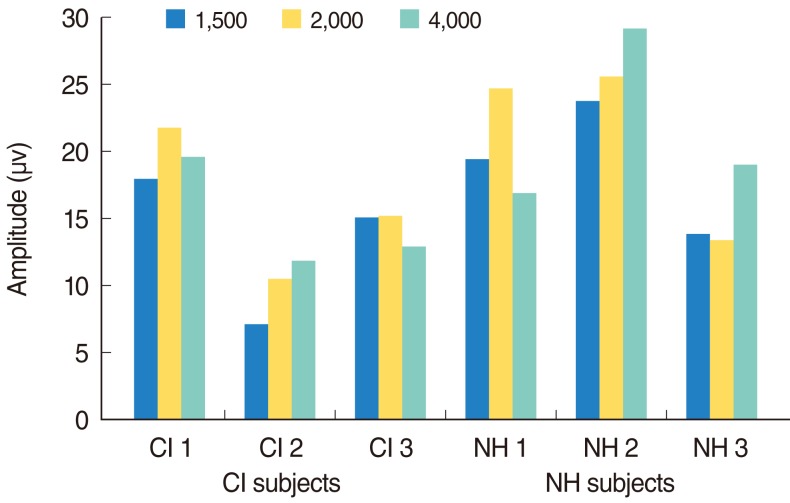
The individual P3 amplitudes are presented in Fig. 2. The results showed reduced P3 amplitudes in the CI subjects as compared to the NH subjects. Furthermore, the amplitudes in the small frequency contrast task tended to be reduced in the CI subjects.
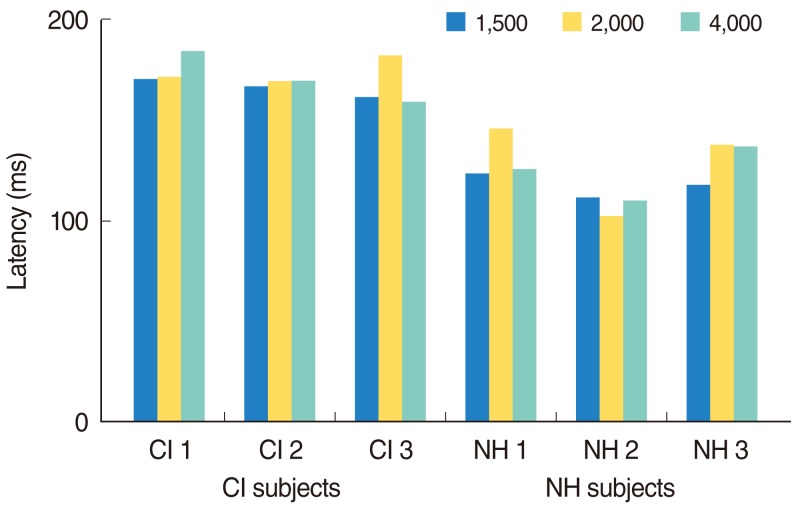
The individual MMN peak latencies at the Fz electrode in the 3 frequency contrast tasks, 1,000-1,500 Hz signal contrast, 1,000-2,000 Hz signal contrast, 1,000-4,000 Hz signal contrast tasks, are presented in Fig. 3. MMNs were identified for both the CI and NH subjects; the latencies in the CI subjects were longer than those in the NH subjects. However, there were no differences in the latencies of either the CI or NH subjects in the 3 frequency contrast tasks.
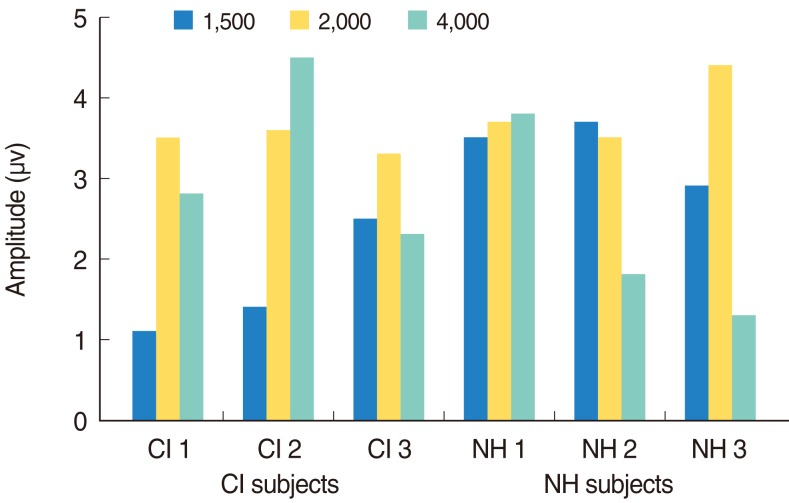
The individual MMN peak amplitudes are presented in Fig. 4. There were individual differences in both the groups, and no consistency was observed in these data.
P3 components were identified for all CI subjects who participated in the present study. Previously, Kelly et al. (3) indicated a relationship between speech perception ability and P3 responses. Our subjects performed well in the speech perception test; therefore, they showed a P3 response for all the tasks.
Furthermore, as the frequency contrasts decreased, the P3 latencies of the CI subjects increased, despite the fact that all CI subjects could similarly discriminate the 2 pitch tones in the 3 frequency contrast tasks. This was likely due to the degree of the discrimination. While the CI subjects could discriminate large frequency contrasts as easily as the NH subjects on both their behavior and brain cortex level, they could behaviorally discriminate the tones in small contrast tasks but faced difficulties in discriminating the stimuli on their cortex level. It is considered that the differences in the P3 latency reflected the primary auditory processing ability.
In terms of comparing the results of the CI and NH subjects, the P3 latencies and amplitudes in CI subjects were greater than those in NH subjects in the large frequency contrast task; this result was in agreement with previous reports (2). This finding may be related to the difficulty faced by CI subjects in using temporal and spectral cues. They appeared to require longer time periods to process the incoming information as compared to the NH subjects.
In contrast, the MMN results indicated that the latencies in the CI subjects were longer than those in the NH subjects; however, no significant differences were observed in any of the 3 frequency tasks. The auditory processing ability of CI subjects appeared to be delayed as compared to NH subjects. However, the MMN is a brain autoresponse that reflects the central auditory processing involved in the subtle differences in auditory signals. Further, this response is passive and does not require a behavioral response or attention. Thus, if CI subjects can discriminate between the 2 tones, MMN is considered to be elicited irrespective of whether the stimuli contrast is large or not.
The MMN amplitudes of CI subjects tended to be lowered in the 1,000-1,500-Hz small contrast task. Small or absent MMNs in CI subjects have been previously reported by Zhang et al. (7), and our results appear to agree with their findings.
The results of the present study indicated that different auditory processing pathways are involved in the active and passive hearing conditions based on the P300 and MMN data. We therefore consider that a combination of both responses plays an important role in the comprehension of auditory processing mechanisms in CI subjects. AEPs need to be further investigated to obtain objective information about central auditory processing in CI users. However, the sample size of this study was small; therefore, we have to investigate the relationship between P300 and MMN in a large number of CI users in future studies.
References
1. Beynon AJ, Snik AF. Use of the event-related P300 potential in cochlear implant subjects for the study of strategy-dependent speech processing. Int J Audiol. 2004; 12. 43(Suppl 1):S44–S47. PMID: 15732382.
2. Oviatt DL, Kileny PR. Auditory event-related potentials elicited from cochlear implant recipients and hearing subjects. Am J Audiol. 1991; 11. 1(1):48–55.

3. Kelly AS, Purdy SC, Thorne PR. Electrophysiological and speech perception measures of auditory processing in experienced adult cochlear implant users. Clin Neurophysiol. 2005; 6. 116(6):1235–1246. PMID: 15978485.
4. Henkin Y, Tetin-Schneider S, Hildesheimer M, Kishon-Rabin L. Cortical neural activity underlying speech perception in postlingual adult cochlear implant recipients. Audiol Neurootol. 2009; 14(1):39–53. PMID: 18781063.

5. Micco AG, Kraus N, Koch DB, McGee TJ, Carrell TD, Sharma A, et al. Speech-evoked cognitive P300 potentials in cochlear implant recipients. Am J Otol. 1995; 7. 16(4):514–520. PMID: 8588653.
6. Kileny PR, Boerst A, Zwolan T. Cognitive evoked potentials to speech and tonal stimuli in children with implants. Otolaryngol Head Neck Surg. 1997; 9. 117(3 Pt 1):161–169. PMID: 9334760.

7. Zhang F, Hammer T, Banks HL, Benson C, Xiang J, Fu QJ. Mismatch negativity and adaptation measures of the late auditory evoked potential in cochlear implant users. Hear Res. 2011; 5. 275(1-2):17–29. PMID: 21129468.

8. Naatanen R, Astikainen P, Ruusuvirta T, Huotilainen M. Automatic auditory intelligence: an expression of the sensory-cognitive core of cognitive processes. Brain Res Rev. 2010; 9. 64(1):123–136. PMID: 20298716.
Fig. 1
Individual P3 latencies (ms) at the Cz electrode of cochlear implant (CI) subjects (CI1-CI3) and normal hearing (NH) subjects (NH1-NH3) in the 3 frequency contrast tasks. 1,000-1,500 Hz signal contrast (blue bars), 1,000-2,000 Hz signal contrast (yellow bars), and 1,000-4,000 Hz signal contrast (green bars) tasks.

Fig. 2
Individual P3 amplitudes (µV) at the Cz electrode of cochlear implant (CI) subjects (CI1-CI3) and normal hearing (NH) subjects (NH1-NH3) in the 3 frequency contrast tasks. 1,000-1,500 Hz signal contrast (blue bars), 1,000-2,000 Hz signal contrast (yellow bars), and 1,000-4,000 Hz signal contrast (green bars) tasks.

Fig. 3
Individual mismatched negativity (MMN) peak latencies (ms) at the Cz electrode of cochlear implant (CI) subjects (CI1-CI3) and normal hearing (NH) subjects (NH1-NH3) in the 3 frequency contrast tasks. 1,000-1,500 Hz signal contrast (blue bars), 1,000-2,000 Hz signal contrast (yellow bars), and 1,000-4,000 Hz signal contrast (green bars) tasks.

Fig. 4
Individual mismatched negativity (MMN) peak amplitudes (µV) at the Cz electrode of cochlear implant (CI) subjects (CI1-CI3) and normal hearing (NH) subjects (NH1-NH3) in the 3 frequency contrast tasks. 1,000-1,500 Hz signal contrast (blue bars), 1,000-2,000 Hz signal contrast (yellow bars), and 1,000-4,000 Hz signal contrast (green bars) tasks.


 PDF
PDF Citation
 Print
Print


 XML Download