

 PDF
PDF Citation
 Print
Print


INTRODUCTION
Insulin-like growth factor 1 (IGF-1) and IGF-2 are also known as somatomedin C and somatomedin A, respectively, and these are single chain polypeptides that share amino acid sequence homology with insulin. The insulin-like growth factor system is formed by the peptide factors (insulin, IGF-1 and IGF-2), their cellular receptors and the specific IGF binding proteins (classically IGFBP-1 to -6) (1). The type 1 receptor mediates most of the biological effects of IGF-1, 2 (2). The type 2 receptor is involved with IGF-2 regulation. The liver is the main source of the plasma IGFs released into the circulation. However IGFs have been found in most tissues and they appear to exert both local (organ-specific; autocrine/paracrine) and systemic (endocrine) actions (3, 4).
IGF-1 is necessary for the normal development and maintenance of the inner ear (5) and IGF-2 compensates for IGF-1 actions during early development (6). IGF-1 knockout mice showed a significant reduction in the size of the cochlea and cochlear ganglion (7, 8) and so IGF-1 is an essential factor for the normal development of the inner ear. IGF-2 appears to be more local distributed compared with that of IGF-1 (4), and IGF-2 shows many beneficial actions. IGF-2 can act as a growth factor in the teratocarcinoma cell line by promoting overall cell survival (9). IGF-2 can compensate in part for IGF-1 actions on myelination (10), and it can be related to neuronal differentiation (11) and other regulations after neurotoxic insults (12). Thus, the IGF system efficiently signals to cells to grow, differentiate and survive because the IGF system can prevent apoptosis by activation of phosphoinositide 3-kinase (PI3K) (13) and increasing the level of proliferating cell nuclear antigen (PCNA) (14). IGFs are important for regeneration/repair in the mammalian labyrinth (15). IGFs are also accepted as neurotrophic factors, and they are associated with the therapeutic potential to alleviate neurodegerative disease (1, 16).
Salicylate toxicity presents a unique pattern of auditory dysfunction that consists of reversible hearing loss and tinnitus. In humans, high dosages of salicylate induce a moderate degree of hearing loss and tinnitus, and salicylate's effect on the hearing threshold and volume of tinnitus are dose-dependent (17). In our previous study, a threshold shift of 30 dB can be induced after a few hours and this returns to normal after 1-3 days in a mouse model of salicylate intoxication (18). A concurrent experiment that used a microarray analysis revealed IGF-2 to be a prominent factor in salicylate ototoxicity (18). The purpose of this current study was to identify the expressions of IGF-1 and IGF-2 in a murine model of salicylate ototoxicity, which is a typical reversible hearing loss model.
Go to : 
MATERIALS AND METHODS
Preparation of samples
Thirty male BALB/c adult mice (mean body weight, 40.4 g) with normal hearing were used in this study. Ten male BALB/c adult mice with normal hearing, as was initially assessed by ABR measurement, were used for the normal controls. The mice were anesthetized with rodent cocktail (Ketamine 50 mg/kg and Rompun 5 mg/kg). Sodium salicylate (Sigma Chemical Co., St. Louis, MO, USA) was dissolved in 0.9% sodium chloride (400 mg/kg) and this was given as intra-peritoneal injections to the mice. The ABR thresholds were measured by broad band clicks at 3 hours and 72 hours after an injection of sodium salicylate. The ABR thresholds were measured with a Navigator Pro Diagnostic ABR/ASSR system (Bio-logic Systems Co., Mundelein, IL, USA). An approximate 30 dB threshold shift was achieved at 3 hours after the sodium salicylate injection (the salicylate 3 hours group), and then 10 mice were sacrificed. The temporal bones were immediately removed and the bony cochleae were removed under a stereoscope and immediately frozen at -70℃ for later use to synthesize the cDNA. Return to the normal threshold, as measured by the ABR, was observed in another 10 mice at 72 hours after the sodium salicylate injection (the salicylate 72 hours group). Their cochleae were removed under a stereoscope and immediately frozen at -70℃ until further use for the salicylate 72 hours group.
HEI-OC1 cell culture
Establishment of the HEI-OC1 cell line has been facilitated by the development of a transgenic mouse, the Immortomouse, which harbors a temperature-sensitive mutant of the SV40 large T antigen gene. HEI-OC1 cells express several molecular markers that are characteristic of the organ of Corti sensory cells, and HEI-OC1 cells are extremely sensitive to ototoxic drugs (19). Therefore, the HEI-OC1 cell line can be a useful model to study ototoxic drugs such as cisplatin and salicylate. The HEI-OC1 cell line was kindly provided by F. Kalinec (House Ear Institute, Los Angeles, CA, USA). The cells used in this study were maintained in DMEM with 10% FBS at 33℃ under a 10% CO2 in air atmosphere.
Semi-quantitative RT-PCR
The expression of each target mRNA was confirmed by semi-quantitative reverse transcription polymerase chain reaction (RT-PCR). Glyceraldehyde-3-phosphate dehydrogenase (GAPDH), as a housekeeping gene, was also used as an internal control in the PCR protocol. The PCR cycle consisted of: 1) 94℃ for 30 seconds, 2) 52-62℃ for 30 seconds, and 3) 72℃ for 1 minute 30 seconds. This protocol was repeated for 33 cycles, and a control PCR reaction, which involved taq polymerase and the primer combination, but no template, was used as a negative PCR control. The PCR products were separated on 1.5% agarose gel, and they were visualized by ethidium bromide staining. The Polaroid photographs were optically scanned and analyzed with the National Institute of Health Image Software ver.1.6 and the available gel macros.
MTT assay
The uptake and conversion of 3-(4, 5-Dimethylthiazol-2-yl)-2, 5-diphenyl-tetrazdiumbromide (MTT, Sigma) to crystals of dark violet formazan is dependent on the mitochondria activity. Cell viability was measured using the MTT assay and this was expressed as a percentage of the untreated control cell samples. The dose-dependent or time-dependent effects of salicylate were measured by performing MTT assay on the HEI-OC1 cell cultures. The cells were treated with 1, 5, 10, or 20 mM salicylate for 24 (circle), 48 (square) and 72 (triangle) hours, and with salicylate (at 20 mM) for 0, 3, 6, 12, 24, 48, and 72 hours. For MTT assay, 50 µL of MTT solution (0.25 mg) was added to 0.5 mL of the cell suspension, and the plates were then incubated for 4 hours at 33℃ in 10% CO2. The insoluble formazan crystals were centrifuged, and the pellets were dissolved by the addition of DMSO (500 µL/well). The optical density was measured at 570 nm with using a microplate reader (Spectra Max, Molecular Devices, Sunnyvale, CA, USA).
Hoechst 33258 staining
The loss of cell viability was determined by evaluating the nuclear morphology with performing Hoechst 33258 staining. The HEI-OC1 cell cultures were treated without salicylate for 24 hours (control) or with salicylate at 10 mM and 20 mM for 24 hours. After fixation with 4% paraformaldehyde for 10 minutes at room temperature, the cells were washed twice with phosphate-buffered saline (PBS) and incubated with 10 µg/mL Hoechst 33258 (Sigma) for 10 minutes at room temperature in a dark room. After two washes, the condensed and fragmented nuclei were observed under an inverted fluorescence microscope (BX61, Olympus, Tokyo, Japan).
Confocal immunofluorescence imaging
For the immunohistochemical study, the tissue samples were embedded, cryosectioned and then stored at -80℃ prior to use. The sections were air dried, rehydrated in PBS and blocked with normal horse serum. The endogenous peroxidase was inactivated by incubation with 3% hydrogen peroxidase for 15 minutes at room temperature. After incubation with the mouse monoclonal IGF-1 and 2 antibody at a dilution of 1:500 overnight at room temperature, the biotinylated secondary antibody was applied, followed by the avidin-biotin-peroxidase complex. The color was developed using 3,3'-diaminobenzidine. The cells were photographed and analyzed with a confocal microscope (Carl Zeiss, MicroImaging Inc., Thornwood, NY, USA) and a Zeiss LSM Image Browser.
Western blotting
For Western blot analysis, equal amounts of the total protein were separated on 7.5% sodium dodecyl sulfate-polyacrylamide gels and the proteins were transferred to immobilon (Millipore, Bedford, MA, USA). The blots were blocked for 1 hour at room temperature with PBS containing 1% skim milk and then the blots were incubated with anti-IGF-1 and 2 antibodies for overnight at room temperature. The biotinylated secondary antibody was applied and this was followed by the avidin-biotin-peroxidase complex. The color was developed using 3,3'-diaminobenzidine.
Go to :
RESULTS
The IGFs' mRNA expressions were increased in the salicylate ototoxicity mice. Semi-quantitative RT-PCR analysis confirmed that the IGFs' mRNA expressions were significantly enhanced in the salicylate ototoxicity groups as compared with that of the normal control group (Fig. 1A). The ratio of the expression levels, as seen on the images of RT-PCR and as measured by densitometry, was significantly higher in the salicylate groups (and especially in the salicylate 3 hours group) than that of the normal control group (Fig. 1B, C). One-way ANOVA indicated that the difference in the mean fold induction in the salicylate 3 hours group was significant as compared with that of the mean fold induction of the normal control group (P<0.05).
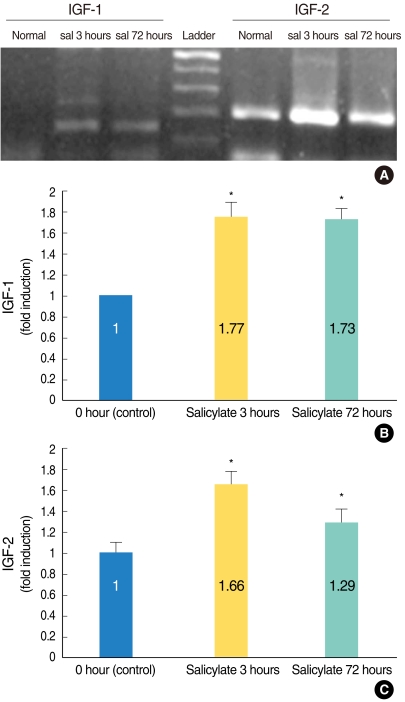 | Fig. 1Semi-quantitative reverse transcription polymerase chain reaction (RT-PCR) analysis confirmed that the insulin-like growth factors (IGFs)' mRNA expressions were significantly enhanced in the salicylate (sal) ototoxicity groups as compared with that of the normal control group (A). The ratio of the expression levels on the image of the RT-PCR and as measured by densitometry was significantly higher in the salicylate group (and especially the salicylate 3 hours group) as compared to that of the normal control group (B, IGF-1; C, IGF-2). *P<0.05 compared with the control group.
|
Cell viability was decreased in a dose- and time-dependent manner. The viability of the HEI-OC1 cell cultures was decreased in a dose-dependent (Fig. 2A) and time-dependent (Fig. 2B) manner in the mice with salicylate ototoxicity. The nuclei of the normal control cells were observed as round-shaped with homogenous staining (Fig. 3A). Compared with the normal control nuclei, the 10 mM and 20 mM salicylate induced characteristic apoptotic morphology of the nuclei showed heterogeneous staining condensation and fragmentation (Fig. 3B, C). These changes were consistent with the results of the MTT assay and they support the fact that salicylate induced apoptotic cellular changes occurred in the HEI-OC1 cell line.
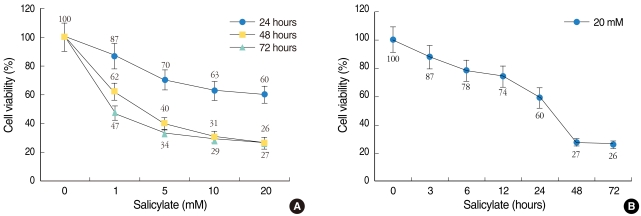 | Fig. 2Cytotoxic effect of salicylate on the HEI-OC1 cell cultures. Cell viability was measured using the MTT assay and this was expressed as a percentage of the untreated control cell samples. Dose-dependent (A) or time-dependent (B) effects of salicylate on the HEI-OC1 cell cultures. The cells treated with 1, 5, 10, or 20 mM salicylate for 24 (●), 48 (■), and 72 (▲) hours (A), and with salicylate (at 20 mM) for 0, 3, 6, 12, 24, 48, and 72 hours (B). The values are the mean±SE of the data.
|
 | Fig. 3Hoechst 33258 staining of the salicylate-treated HEI-OC1 cell cultures. The HEI-OC1 cell cultures were treated without salicylate for 24 hours (A), or with salicylate at 10 mM (B) and 20 mM (C) for 24 hours, and they were examined under a light microscope. The nuclei of the normal control cells were shown as round-shaped with homogenous staining (A). However, the 10 mM and 20 mM salicylate treatment induced characteristic apoptotic morphology nuclei with heterogeneous staining, condensation and fragmentation (B, C).
|
Confocal immunofluorescence imaging IGF-1 and 2 were highly expressed in the stria vascularis at 72 hours after an injection of sodium salicylate, as compared with that of the normal control group and the salicylate 72 hours group (Fig. 4). The stria vascularis is a vascular-rich area in the cochlea, and systemic IGFs can be expressed in this region.
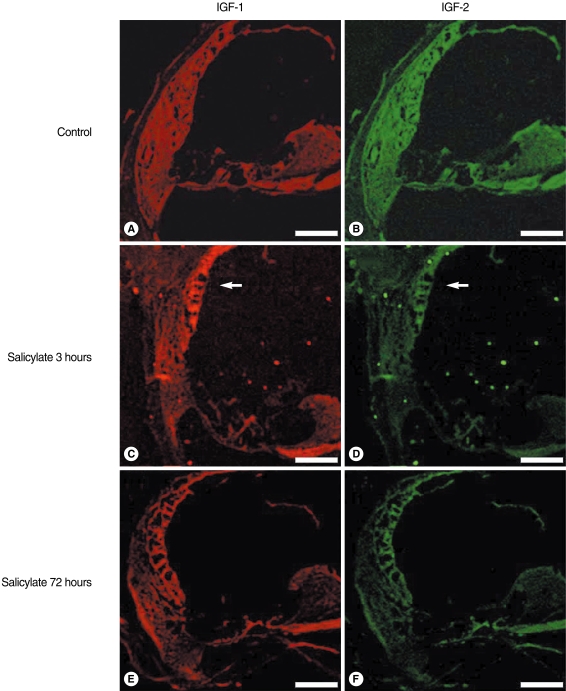 | Fig. 4Confocal immunofluorescence imaging of the insulin-like growth factors (IGFs) in salicylate ototoxicity. The IGFs expressions were non-specific in the normal control group (A, B). IGF-1 and 2 were highly expressed in the stria vascularis (arrow) 3 hours after an injection of sodium salicylate, as compared with that of the normal control group and the salicylate 72 hours group (C, D). Decreased IGF expressions were observed in the salicylate 72 hours group, which is the time of returning to normal hearing (E, F). Scale bars is 100 µm.
|
Western blotting
The expression of IGF-1 and 2 proteins was increased in the salicylate ototoxicity groups as compared with that of the normal control group. In the in-vivo condition, the expression of IGFs was higher in the salicylate ototoxicity groups as compared with that of the normal control group, and especially in the salicylate 3 hours group, and there were similar patterns on both RT-PCR and Western blotting. In the in-vitro condition, the expressions of IGFs were slightly increased compared with that of the normal control (Fig. 5).
 | Fig. 5Western blot analysis of the insulin-like growth factors (IGFs) in salicylate (sal) ototoxicity. The expressions of IGF-1 and 2 were increased in the sal ototoxicity groups compared with that of the normal control group. The expressions of IGFs on the in-vitro study (control, sal 10 mM and 20 mM) were increased in a dose-dependent manner. The expression of IGFs in the in-vivo study was higher in the sal group (and especially the sal 3 hours group) than that of the normal control. The molecular weight of the IGF-1 and 2 proteins was about 7.6 and 7.4 kDa, respectively.
|
Go to :
DISCUSSION
This study originated from our previous study, which showed high expressions of IGFs on the microarray analysis of mice with salicylate ototoxicity (18). Hearing measurement in the salicylate-intoxicated mouse (ABR threshold measurements by broadband clicks) showed a maximal threshold shift of 33 dB at 3 hours (33±6.3 dB) after salicylate administration, and these changes were reversible after 72 hours (12.5±2.6 dB) in our previous study (18). Salicylate ototoxicity can be an interesting model of reversible hearing loss for both animals and human.
In this study, the IGF-1 and IGF-2 mRNA expressions were observed and especially in the salicylate 3 hours group, which is the time of showing the maximal toxic effect of salicylate. Otherwise, the IGFs expressions were less in both the control group and the salicylate 72 hours group, which is the time the hearing returns to normal. This observation shows that IGFs play some role in salicylate ototoxicity.
On the western blotting, the IGFs protein expression was increased, and especially in the 3 hours group of the in-vivo study. On the confocal immunofluorescence imaging, IGF-1 and IGF-2 were highly expressed in the stria vascularis, which is a vascular-rich area in the cochlea. This observation was predictable because IGFs are mainly produced systemically and they are supplied to the whole body by the blood system. These results show that systemic IGFs' actions may be critical to prevent permanent damages induced by the salicylate in the in-vivo condition. Otherwise, the local production and action of IGFs (autocrine/paracrine) may be possible in the cochlea because the expressions of IGFs proteins were increased in both the in-vivo and in-vitro conditions. The IGFs system can work in both the in-vitro and in-vivo conditions in mice with salicylate ototoxicity. However, the point is that the systemic IGFs' actions can be a main portion in the IGF system of the cochlea, which is supported by the fact that the increment of IGF protein was more prominent, and especially in the 3 hours group, in the in-vivo study. Thus, IGFs can protect the cochlear auditory cells from ototoxic insults in the in-vivo condition, and the hearing threshold change was reversible and little cellular damage occurred in the salicylate-intoxicated mice (17, 18). Only the local actions of IGFs can not cause complete recovery of cellular damage, which was shown by MTT assay in the in-vitro study. We also suggest that the cellular damage induced by salicylate may be related to apoptosis because Hoechst 33258 staining revealed the apoptotic changes induced by salicylate (20).
We suggest that there are some protective mechanisms in salicylate ototoxicity, and the IGF system may play a role in these protective mechanisms, and especially in the in-vivo condition. In the cochlea, the IGF system may have both local (autocrine/paracrine) and systemic (endocrine) effects. The systemic action of IGFs may be more powerful than the local effects of IGFs, and the systemic action of IGFs can prevent the cochlea auditory cells from permanent damage induced by salicylate. In the future, an iatrogenic supply of IGFs may improve the cellular viability and cochlear/neuronal survival in salicylate intoxicated animals, and this requires further studies. Obviously, it is of great importance that the therapeutic value of IGFs in human should be evaluated, and especially in the cochlea, neurons and brain.
Go to :
 XML Download