INTRODUCTION
MATERIALS AND METHODS
Patient enrollment
Table 1
Evaluation of vestibular function
Vestibular rehabilitation and follow-up
Statistical analysis
RESULTS
Demographic data and vestibular function of the patients
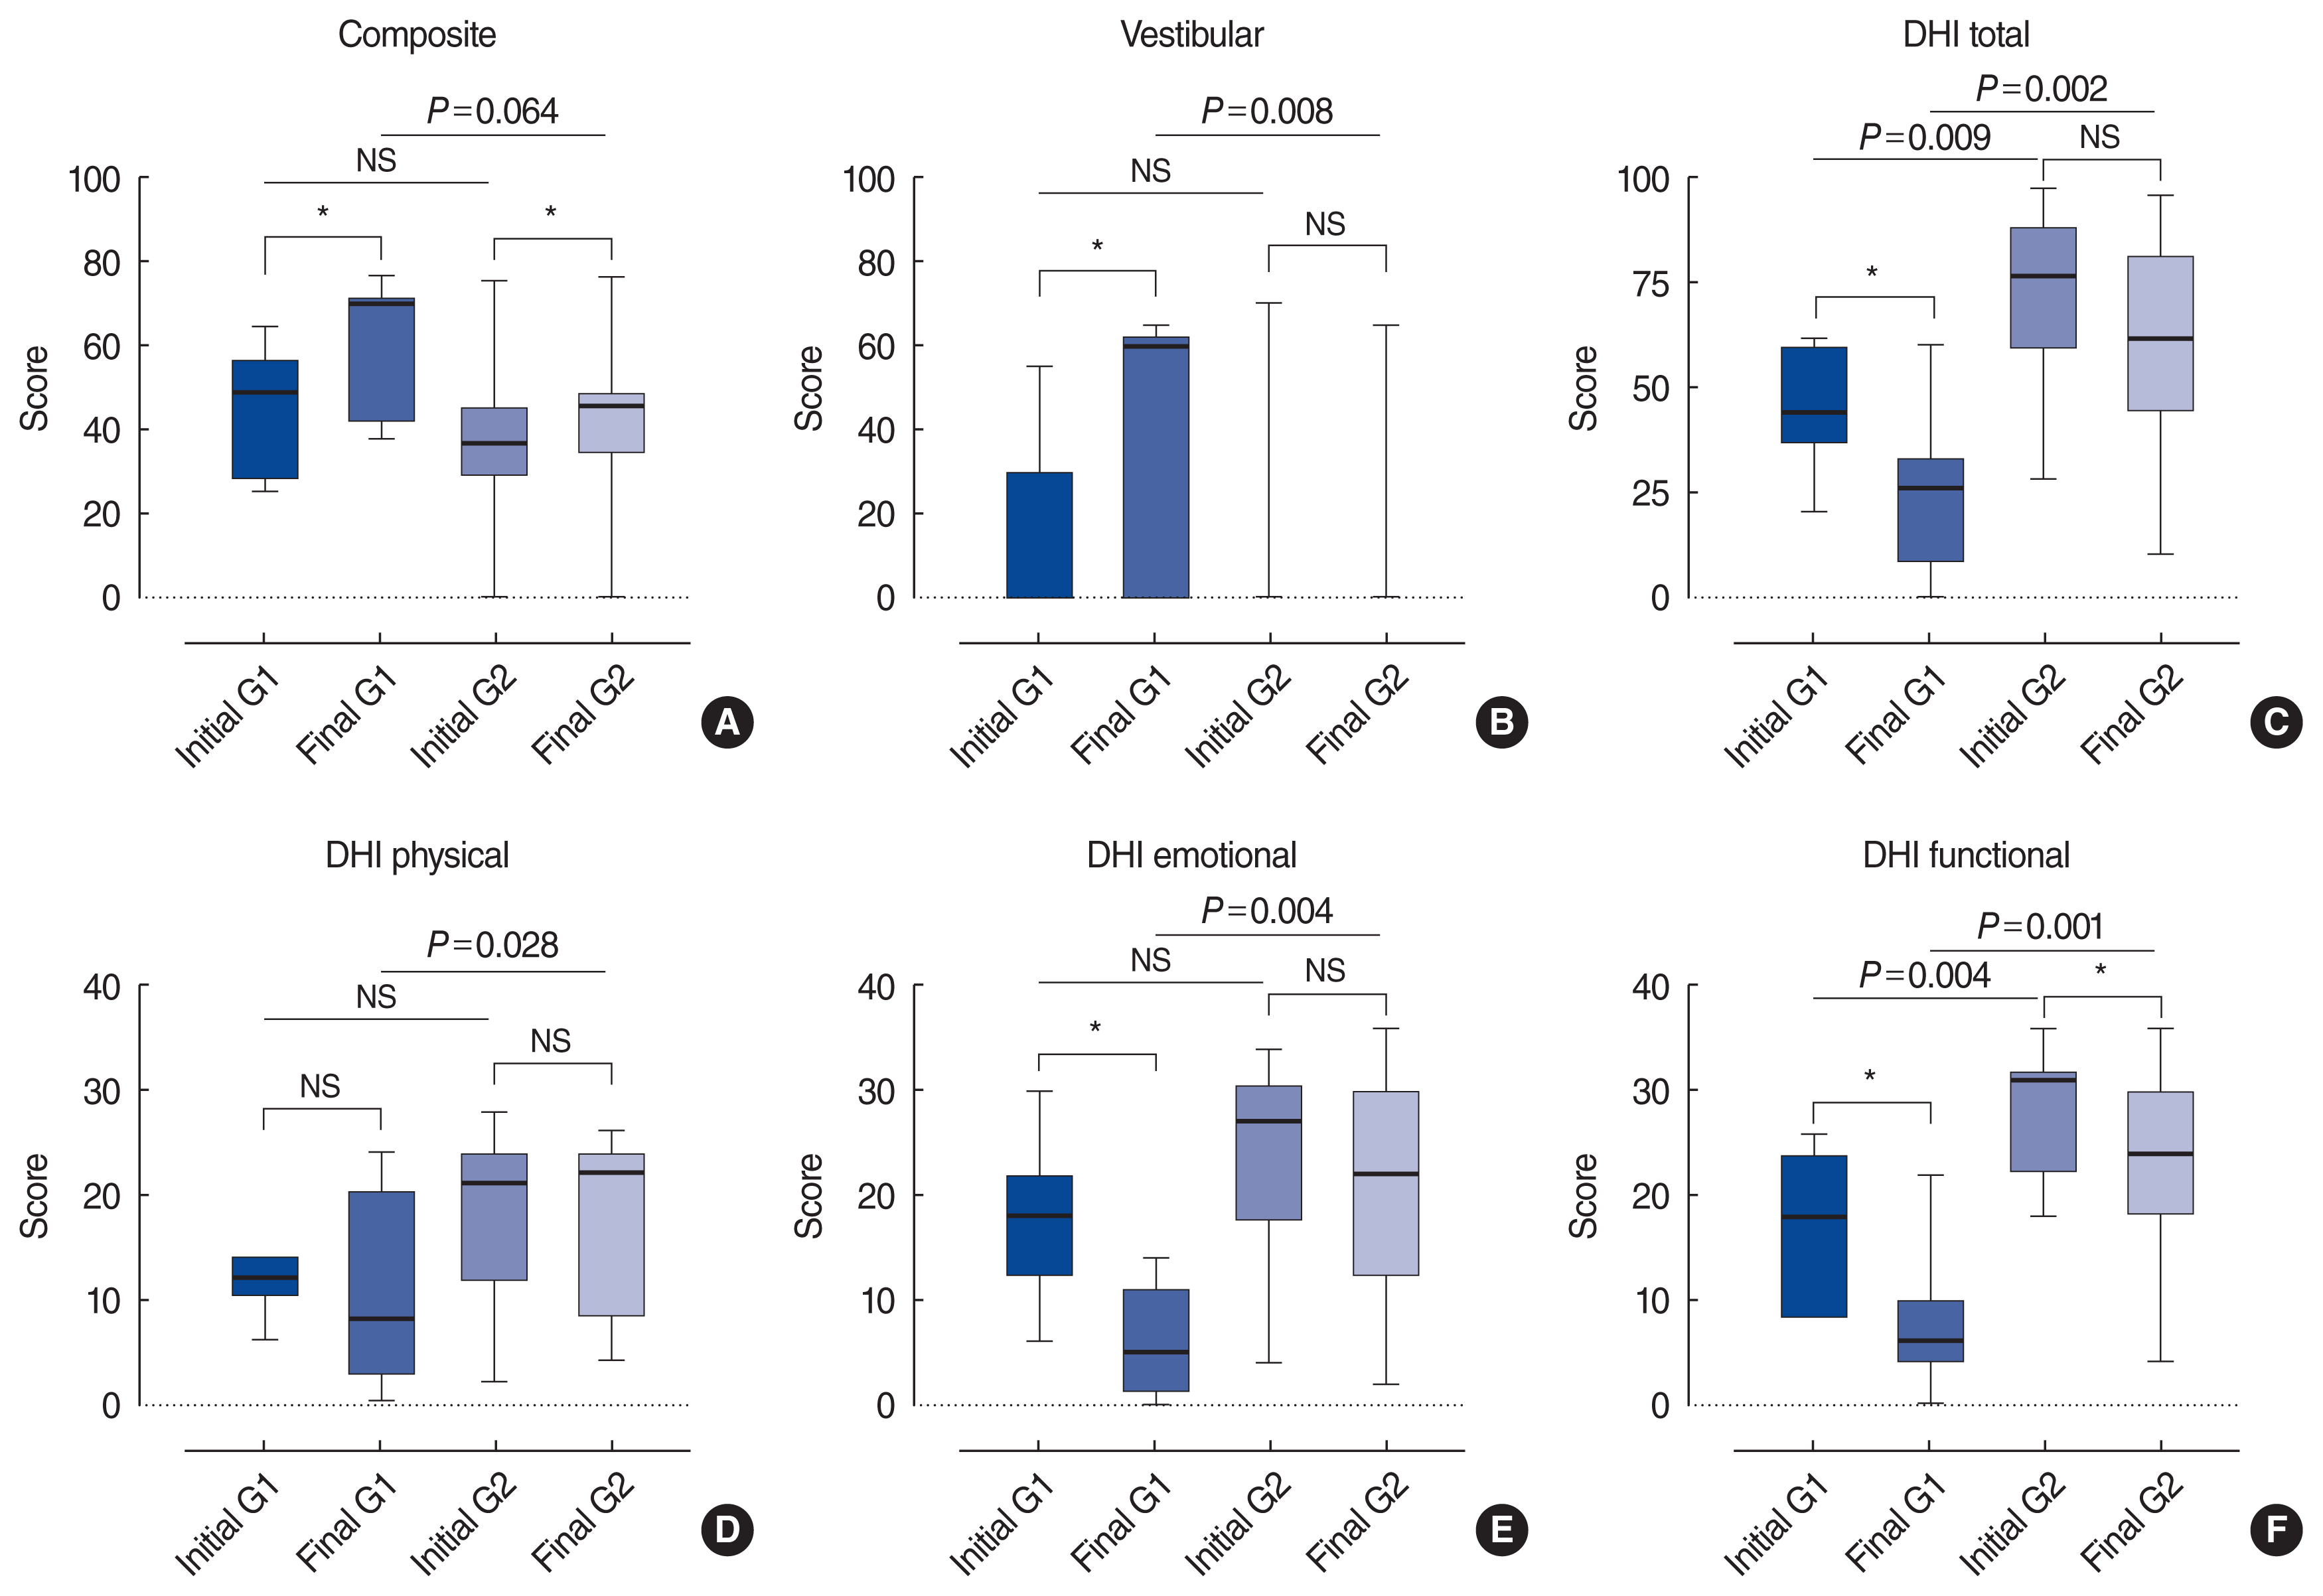
 | Fig. 1Changes in subjective symptoms and objective parameters of balance function after rehabilitation. A simple boxplot of the computerized dynamic posturography and Dizziness Handicap Inventory (DHI) scores for bilateral vestibulopathy patients at baseline and follow-up. G1 (group 1, video head impulse test [vHIT] gain in the lateral semicircular canal [LSCC] ≥0.6 in one or both ears) patients showed a better outcome than G2 (group 2, vHIT gain in the LSCC <0.6 in both ears) patients. (A) Composite score, (B) vestibular score, (C) DHI total score, (D) DHI physical score, (E) DHI emotional score, and (F) DHI functional score. The line in the middle is the median. The top and bottom box lines show the first and third quartiles, respectively. The whiskers show the maximum and minimum values. NS, not significant. *P<0.05. |
Table 2
| Factor | Group 1 (n=9) | Group 2 (n=15) | Total (n=24) | P-value |
|---|---|---|---|---|
| Age (yr) | 58.56±15.69 | 61.87±17.02 | 60.63±16.26 | 0.570 |
| Sex | 0.678 | |||
| Male | 3 | 7 | 10 | |
| Female | 6 | 8 | 14 | |
| Disease durationa) | 1.000 | |||
| Recent | 4 | 7 | 11 | |
| Remote | 5 | 8 | 13 | |
| Hypertension | 4 | 7 | 11 | 1.000 |
| Diabetes mellitus | 1 | 5 | 6 | 0.351 |
| cVEMP lossb) | 5 | 8 | 13 | 1.000 |
| oVEMP lossb) | 6 | 12 | 18 | 0.635 |
| Caloric SPVc) | 4.17±6.6 | 8.0±17 | 6.56±13.95 | 0.706 |
| RCT SHA gaind) | 0.28±0.14 | 0.14±0.15 | 0.19±0.16 | 0.022* |
| Average vHIT gaine) | 0.70±0.10 | 0.39±0.12 | 0.51±0.19 | <0.001* |
Values are presented as mean±standard deviation. Group 1 and group 2 included patients with preservation or loss of high-frequency VOR (LSCC gain ≥0.6 at least on one side or LSCC gain <0.6 on both sides on the vHIT), respectively.
cVEMP, cervical vestibular-evoked myogenic potential; oVEMP, ocular vestibular-evoked myogenic potential; SPV, slow-phase velocity; RCT, rotary chair test; SHA, slow harmonic acceleration; vHIT, video head impulse test; VOR, vestibulo-ocular reflex; LSCC, lateral semicircular canal.
a) Duration of disease was defined as recent if the duration of the symptoms was within 6 months and as remote if the duration of the symptoms was more than 6 months. b)cVEMP/oVEMP loss indicated bilateral “no response” in cervical or ocular vestibular-evoked myogenic potential.
c) Caloric SPV indicated the sum of the SPV of nystagmus evoked by bilateral warm and cold-water stimulation.
Prognostic differences according to high-frequency VOR preservation
Table 3
| Variable | Group 1 | Group 2 | Total | P-value |
|---|---|---|---|---|
| PTv | ||||
| Change | 28.3±28.4 | −2.3±10.8 | 9.2±24.1 | 0.002* |
| P-valuea) | 0.031* | 0.750 | 0.066 | |
| PTc | ||||
| Change | 16.3±14.8 | 5.6±9.1 | 9.6±12.4 | 0.064 |
| P-valuea) | 0.016* | 0.023* | 0.001* | |
| DHI total | ||||
| Change | −26.3±23.8 | −10.4±17.4 | −15.7±20.6 | 0.125 |
| P-valuea) | 0.047* | 0.080 | 0.006* | |
| DHI physical | ||||
| Change | −2.9±9.6 | 0.1±5.8 | −0.9±7.2 | 0.202 |
| P-valuea) | 0.406 | 0.970 | 0.467 | |
| DHI emotional | ||||
| Change | −12.1±9.2 | −3.4±8.9 | −6.3±9.7 | 0.052 |
| P-valuea) | 0.016* | 0.235 | 0.009* | |
| DHI functional | ||||
| Change | −11.3±8.9 | −5.7±6.9 | −7.6±7.9 | 0.133 |
| P-valuea) | 0.031* | 0.005* | <0.001* | |
Values are presented as mean±standard deviation. Group 1 and group 2 included patients with preservation or loss of high-frequency VOR (LSCC gain ≥0.6 at least on one side or LSCC gain <0.6 on both sides on the vHIT), respectively.
CDP, computerized dynamic posturography; DHI, Dizziness Handicap Inventory; PTv, vestibular score in posturography; PTc, composite score in posturography; VOR, vestibulo-ocular reflex; LSCC, lateral semicircular canal.
The Mann-Whitney U-test was used to evaluate differences between group 1 and group 2. The Wilcoxon signed-rank test was used to evaluate differences between baseline and follow-up.
Characteristics of patients who showed a favorable prognosis
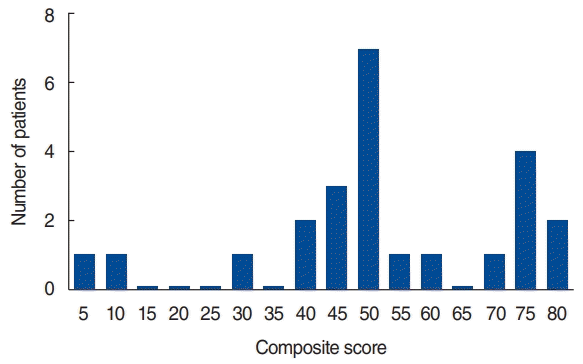
 | Fig. 2Distribution of patients according to the final composite score after vestibular rehabilitation. The cumulative graph of the final composite score showed a double peak at 45–50 and 70–75. |
Table 4
| Variable | Favorable (n=6) | Unfavorable (n=18) | P-value |
|---|---|---|---|
| Age (yr) | 62.83±10.17 | 59.89±18.03 | 0.871 |
| Sex | 0.341 | ||
| Male | 1 | 9 | |
| Female | 5 | 9 | |
| Duration of diseasea) | 1.000 | ||
| Recent | 3 | 8 | |
| Remote | 3 | 10 | |
| Hypertension | 0.649 | ||
| Yes | 2 | 9 | |
| No | 4 | 9 | |
| Diabetes mellitus | 1.000 | ||
| Yes | 1 | 5 | |
| No | 5 | 13 | |
| cVEMP | 1.000 | ||
| Lossb) | 3 | 10 | |
| Present | 3 | 8 | |
| oVEMP | 0.139 | ||
| Lossb) | 3 | 15 | |
| Present | 3 | 3 | |
| Caloric testc) | 1.000 | ||
| Loss | 5 | 16 | |
| Present | 1 | 2 | |
| RCTd) | 0.066 | ||
| Loss | 0 | 8 | |
| Present | 6 | 10 | |
| vHITe) | 0.015* | ||
| Loss | 1 | 14 | |
| Present | 5 | 4 |
The favorable group and unfavorable group included patients with a composite score of 70 or more and less than 70, respectively, at 6 months of follow-up.
cVEMP, cervical vestibular-evoked myogenic potential; oVEMP, ocular vestibular-evoked myogenic potential; RCT, rotary chair test; vHIT, video head impulse test.
a) Duration of disease was defined as recent if the duration of the symptoms was within 6 months and as remote if the duration of the symptoms was more than 6 months.
b) cVEMP/oVEMP loss indicated bilateral “no response” in cervical and ocular vestibular-evoked myogenic potentials.
c) Loss in the caloric test indicated that the sum of the slow phase velocity of nystagmus on each side evoked by cold and warm water stimulation was lower than 6°/sec. “Present” in the caloric test indicated that the sum of the slow-phase velocity of nystagmus evoked by cold and warm water stimulation was 6°/sec or more at least in one ear.
d) “Loss” in the RCT indicated that the gain at 0.12 Hz of slow harmonic acceleration stimulation was lower than 0.1 in the RCT. “Present” in the RCT indicated that the gain at 0.12 Hz of slow harmonic acceleration stimulation was 0.1 or more.
e) “Loss” in the vHIT indicates that the gain of the lateral semicircular canal was lower than 0.6 in both sides of the ear in the vHIT. “Present” in the vHIT indicated that the gain of the lateral semicircular canal was 0.6 or higher in one or both sides of the ear in the vHIT.


 PDF
PDF Citation
 Print
Print


 XML Download