INTRODUCTION
MATERIALS AND METHODS
OCT system and instrumentation
Animal preparation
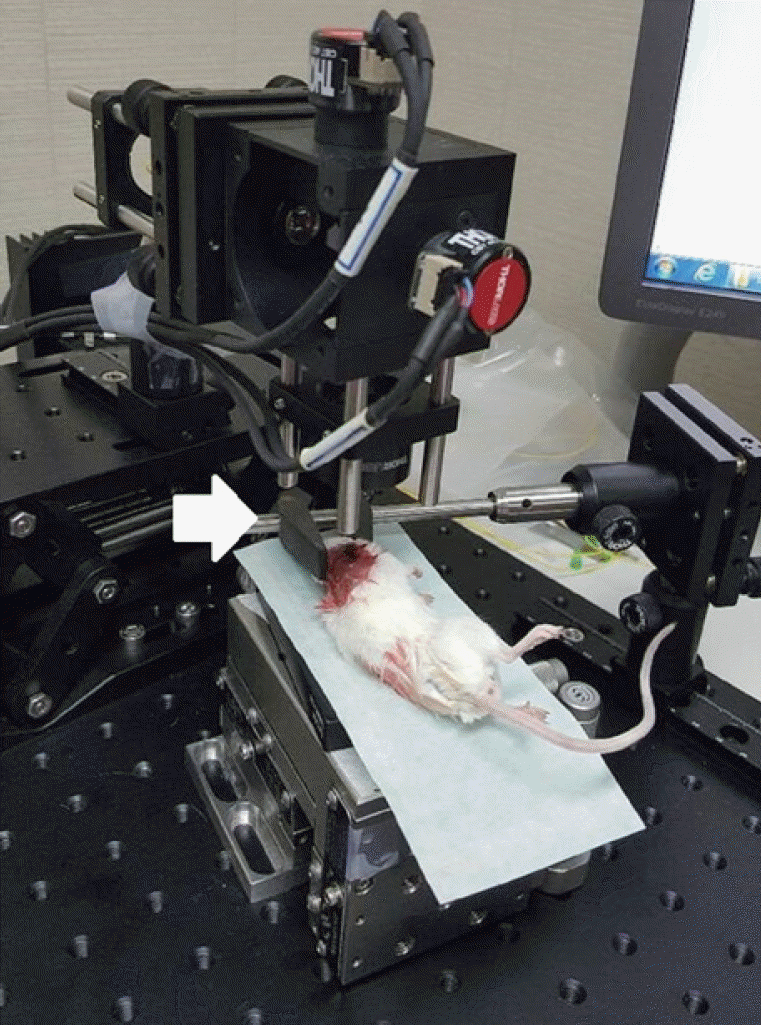
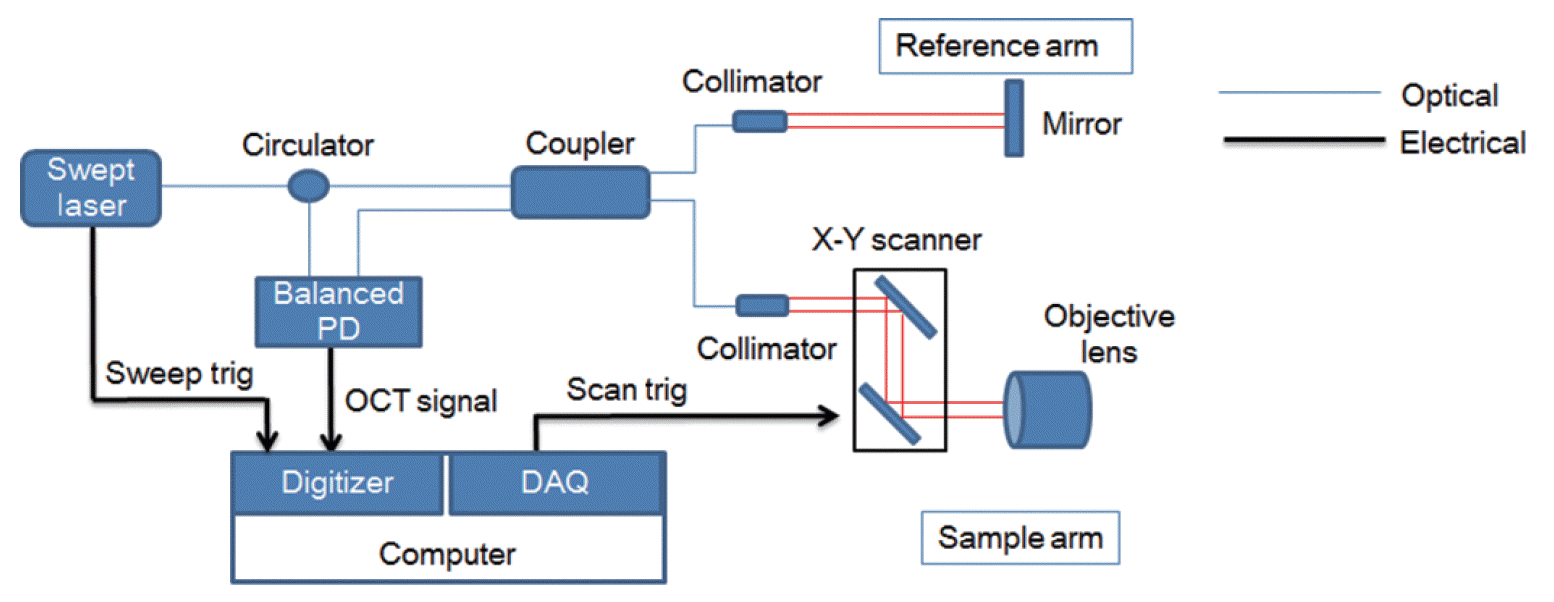
 | Fig. 2.Swept-source optical coherence tomography (OCT) system that was used in this experiment. The objective lens had an outer diameter of 34 mm and a working distance of 7.5 mm. A mouse is placed on the scanning stage of the OCT system. The head of the mouse is grasped by the holder to keep it steady. The white arrow indicates the head holder. |
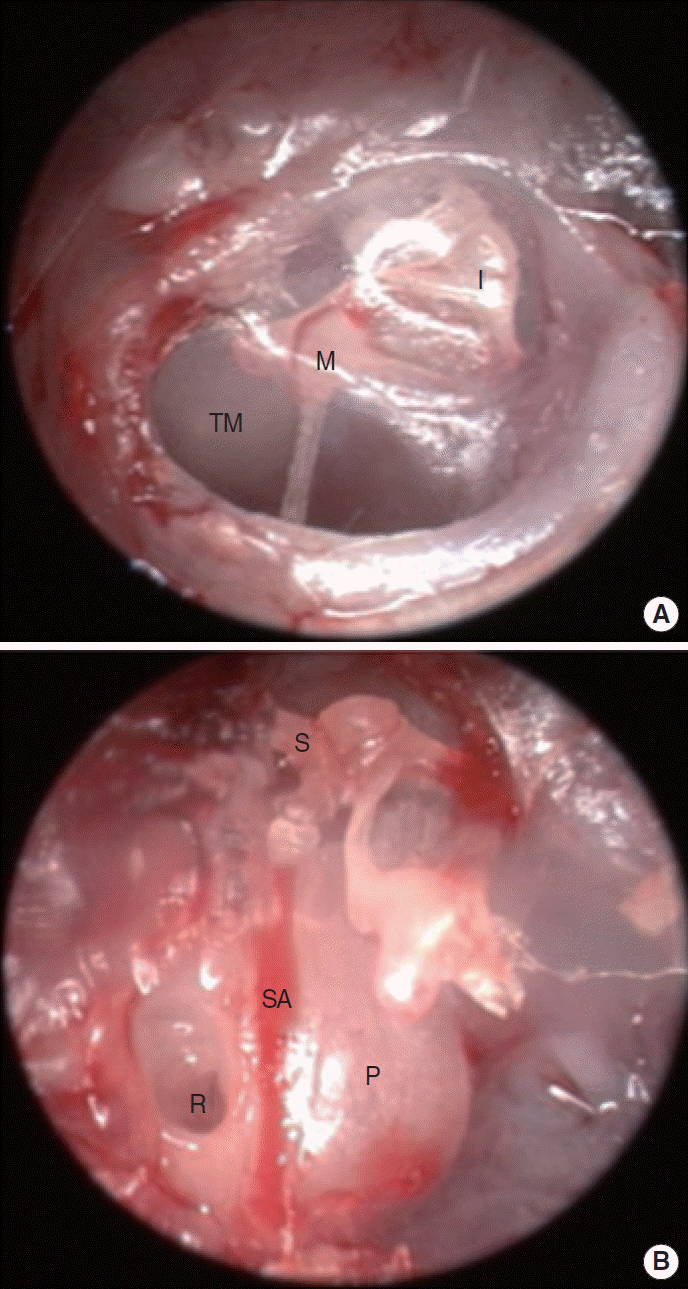
 | Fig. 3.Endoscopic findings in the right ear of the mouse. (A) Tympanic membrane (TM) viewed extra-tympanically. (B) Middle ear of mouse after removal of the TM and the cartilaginous and bony external auditory canal. M, malleus; I, incus; S, stapes; SA, stapedial artery; R, round window; P, promontory. |
Histologic assessment
Statistical analysis
RESULTS
Mouse
 | Fig. 4.
In vivo middle ear and inner ear structure images of a mouse using optical coherence tomography. (A) Two-dimensional image at the apex of the cochlear structures. (B) Three-dimensional image of the same structure in (A). (C) Two-dimensional image of the ossicles in the middle ear cavity. Scale bars (white) represent 500 μm in length. TM, tympanic membrane; M, manubrium of malleus; BM, basilar membrane; SM, scala media; RM, Reissner's membrane; SV, scala vestibuli; ST, scala tympani; P, promontory; I, incus; S, stapes; TC, tympanic cavity; C, cochlea. |
Rat
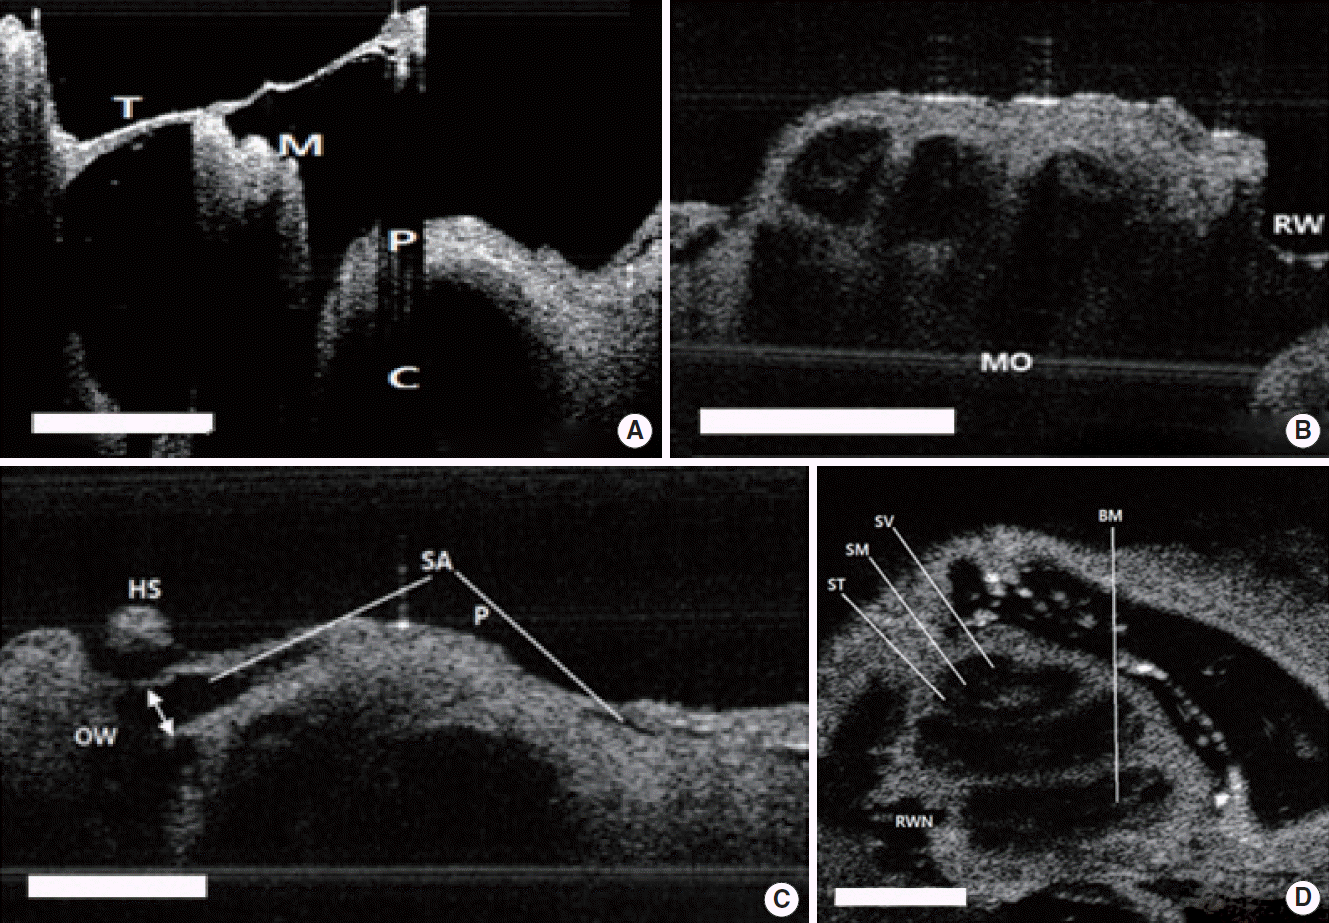
 | Fig. 5.Two-dimensional (2D) images of rat TM, middle ear, and inner ear structures. (A) TM and M with the bulla removed. (B) Apical, middle, basal turn of C and round window with TM with the bulla removed. (C) SA passing on the C and OW. The white arrow indicates the diameter of the SA. (D) Two-dimensional en face image at the apex of the cochlear structures. Scale bars (white) represent 500 μm in length. TM, tympanic membrane; M, malleus; P, promontory; C, cochlea; MO, modiolus; RW, round window; OW, oval window; HS, head of stapes; SA, stapedial artery; ST, scala tympani; SM, scala media; SV, scala vestibuli; BM, basilar membrane; RWN, round window niche. |
 | Fig. 6.The comparison between the optical coherence tomography (OCT) image and histologic view in rats. (A) Apical, middle, basal turn of cochlea and round window with tympanic membrane with the bulla removed. The white arrows indicate the thickness of the bone at each turn of cochlea. Scale bars represent 500 μm in length. (B) Histology of the cochlea, sections were stained with H&E (×40). (C) The comparison of bony thickness covering the cochlea measured by OCT and histology, which shows no significant differences between two methods. MO, modiolus; RW, round window. |


 PDF
PDF Citation
 Print
Print


 XML Download