INTRODUCTION
MATERIALS AND METHODS
Patients
Table 1.
CT examination
Evaluation of CT images
Statistical analysis
RESULTS
Table 2.
| Variable | All subjects | Male | Female | P-value |
|---|---|---|---|---|
| No. of subjects | 159 | 85 | 74 | - |
| Age (yr) | 62.2±12.1 (19–86) | 62.2±10.1 (37–83) | 62.3±14.2 (19–86) | 0.661* |
| Weight (kg) | 72±11.1 (39–99) | 71.9±15.8 (45–109) | 67.4±13.3 (38–98) | 0.051 |
| Height (cm) | 165.3±8.3 (148–190) | 170.1±6.8 (154–190) | 159.9±7.5 (148–175) | <0.001 |
| Body mass index (kg/m2) | 25.6±5.7 (15.9–44.8) | 24.9±5.7 (15.9–44.8) | 26.4±5.5 (16.7–41.4) | 0.091 |
| Stage | 0.004 | |||
| 0 | 7 (4.4) | 1 (1.2) | 6 (8.1) | |
| 1 | 69 (43.4) | 30 (35.3) | 39 (52.7) | |
| 2 | 43 (27) | 29 (34.1) | 14 (18.9) | |
| 3 | 35 (22) | 21 (24.7) | 14 (18.9) | |
| 4 | 5 (3.2) | 4 (4.7) | 1 (1.4) | |
| Performance status | 0.859 | |||
| 0 | 31 (19.5) | 16 (18.8) | 15 (20.3) | |
| 1 | 35 (22) | 18 (21.2) | 17 (23) | |
| 2 | 51 (32.1) | 32 (37.7) | 19 (25.7) | |
| 3 | 37 (23.3) | 16 (18.8) | 21 (28.3) | |
| 4 | 5 (3.2) | 3 (3.5) | 2 (2.7) | |
| Sarcopenia | 0.021 | |||
| Yes | 80 (50.3) | 50 (59.5) | 30 (40) | |
| No | 79 (48.7) | 34 (40.5) | 45 (60) | |
| Location of HNC | <0.001 | |||
| Nasopharynx | 60 (37.7) | 51 (60) | 9 (12.2) | |
| Oral cavity | 4 (2.5) | 4 (4.7) | - | |
| Hypopharynx | 32 (20.1) | 8 (9.4) | 24 (32.4) | |
| Oropharynx | 34 (21.4) | 6 (7.1) | 28 (37.8) | |
| Larynx | 29 (18.2) | 16 (18.8) | 13 (17.6) |
Table 4.
Values are presented as mean±standard deviation.
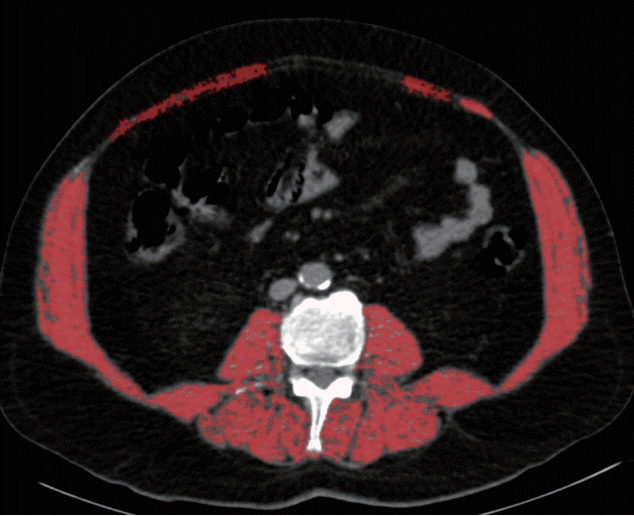
C2MA–C4MA, paravertebral skeletal muscle areas at second (C2), third (C3), and fourth (C4) cervical vertebrae levels; C2MI–C4MI, normalized C2MA–C4MA values for stature; SCMA, sum of the bilateral sternocleidomastoid muscle areas at the levels of C2, C3, and C4 vertebrae; SCMI, normalized SCMA values for stature; L3MA, sum of the all skeletal muscle area at the lower part of the third lumbar vertebrae (L3) level; L3MI, normalized L3MA values for stature.
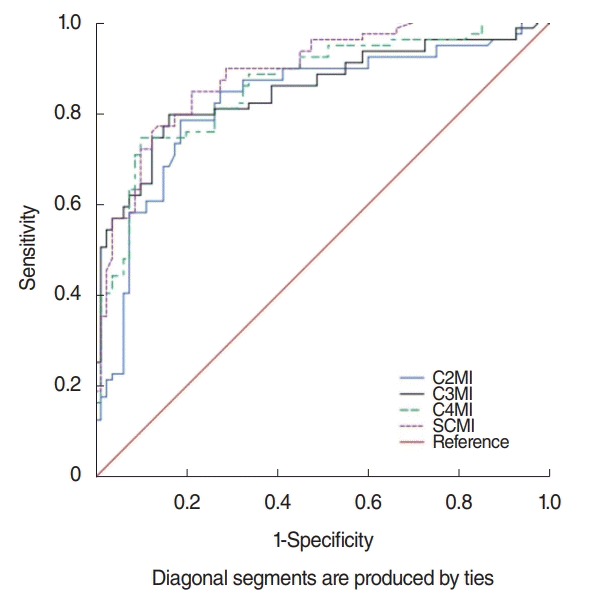 | Fig. 3.Receiver operation characteristic curve for prediction of sarcopenia for the assessment of C2MI, C3MI, C4MI, and SCMI in the study total population (males and females). C2MI–C4MI, normalized paravertebral skeletal muscle areas at the level of C2–C4 vertebrae values for stature; SCMI, normalized sum of the bilateral sternocleidomastoid muscle areas at the levels of C2, C3, and C4 vertebrae values for stature. |
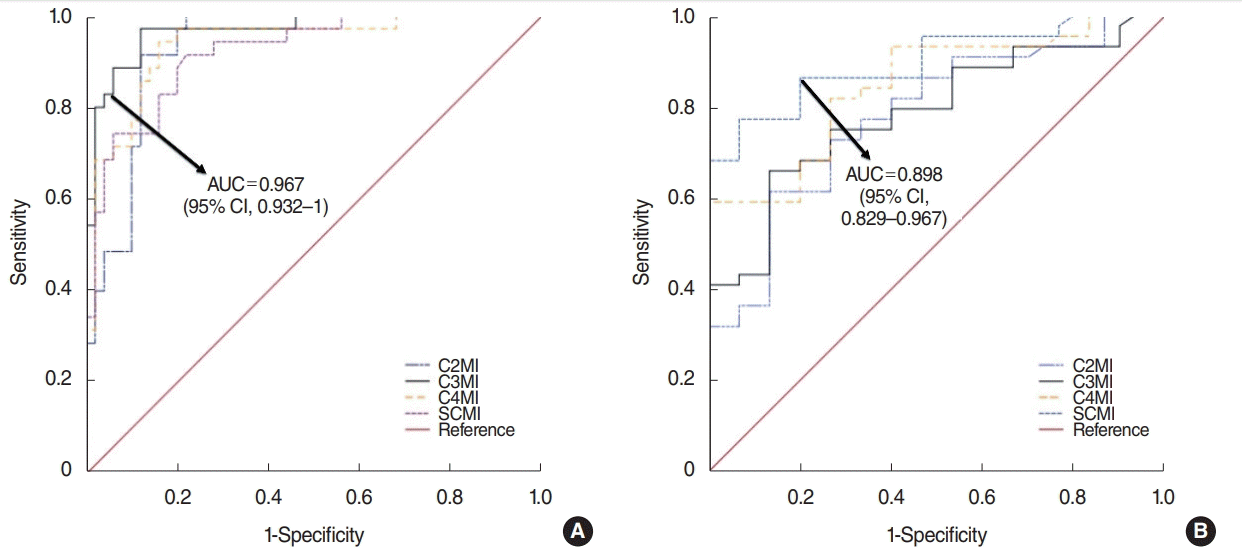 | Fig. 4.Receiver operation characteristic curve for prediction of sarcopenia for the assessment of C3MI in males (A) and C4MI in females (B). AUC, area under the curve; CI, confidence interval; C2MI–C4MI, normalized paravertebral skeletal muscle areas at the level of C2–C4 vertebrae values for stature; SCMI, normalized sum of the bilateral sternocleidomastoid muscle areas at the levels of C2, C3, and C4 vertebrae values for stature. |
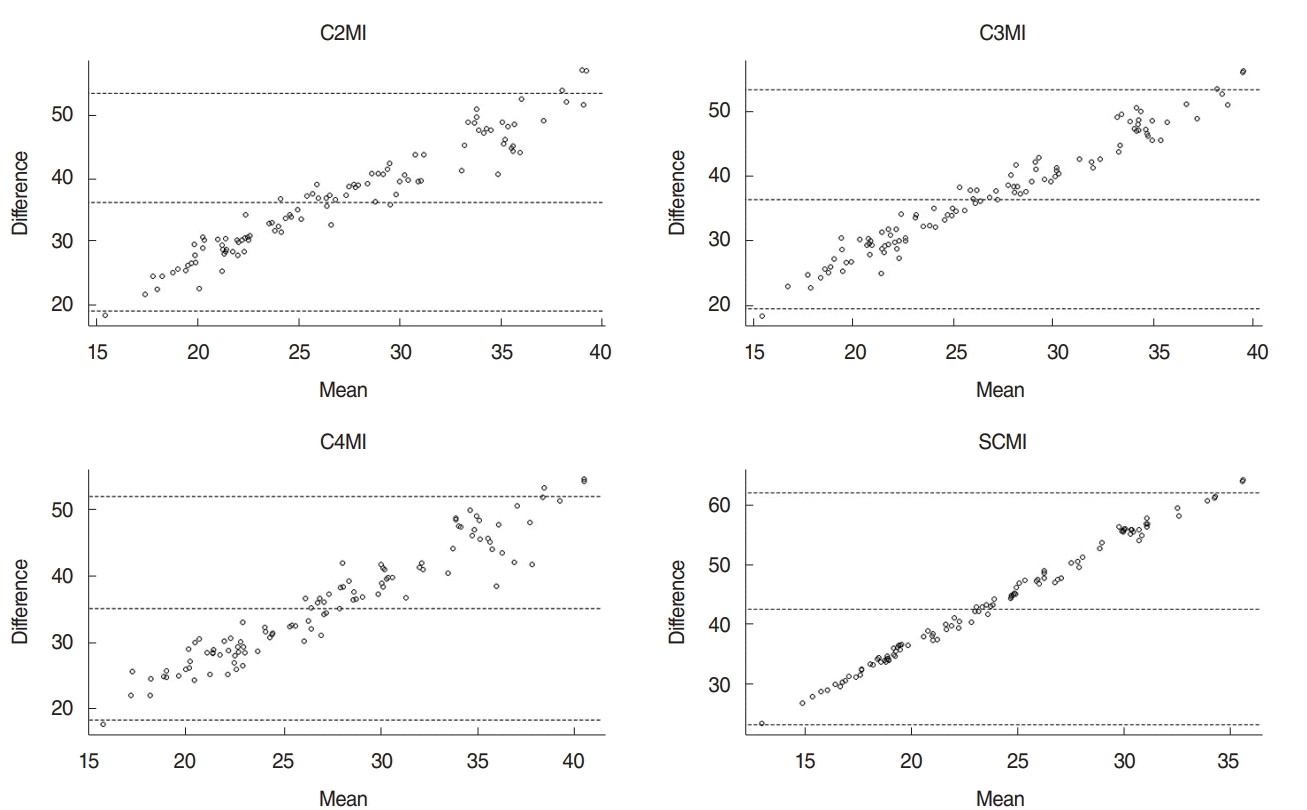 | Fig. 5.Bland-Altman plots show the agreement of the L3MI and cervical paravertebral muscle indexes (C2MI, C3MI, C4MI, and SCMI) measurements. C2MI–C4MI, normalized paravertebral skeletal muscle areas at the levels of second (C2), third (C3), and fourth (C4) cervical vertebrae values for stature; SCMI, normalized sum of the bilateral sternocleidomastoid muscle areas at the levels of C2, C3, and C4 vertebrae values for stature; L3MI, normalized sum of the all skeletal muscle area at the lower part of L3 level value for stature. |
Table 5.
L3MI, normalized sum of the all skeletal muscle areas at the lower part of the third lumbar vertebrae (L3) level value for stature; C2MI–C4MI, normalized paravertebral skeletal muscle areas at the levels of second (C2), third (C3), and fourth (C4) cervical vertebrae values for stature; SCMI, normalized sum of the bilateral sternocleidomastoid muscle areas at the levels of C2, C3, and C4 vertebrae values for stature; BMI, body mass index.
Table 6.
C2MI–C4MI, normalized paravertebral skeletal muscle areas at the levels of second (C2), third (C3), and fourth (C4) cervical vertebrae values for stature; SCMI, normalized sum of the bilateral sternocleidomastoid muscle areas at the levels of C2, C3, and C4 vertebrae values for stature; L3MI, normalized sum of the all skeletal muscle area at the lower part of the third lumbar vertebrae (L3) level value for stature.


 PDF
PDF Citation
 Print
Print


 XML Download