Abstract
Although efficacies and proportions of tympanoplasty performed via endoscopic ear surgery (EES) have gradually introduced, it remains unclear whether total EES is a good alternative to microscopic ear surgery (MES). Herein, we aimed to compare therapeutic effects of EES and MES in patients receiving tympanoplasty or myringoplasty. A search of MEDLINE, PubMed, and Embase databases was conducted to compare the efficacies of EES and MES. Two investigators independently reviewed all studies and extracted data with a standardized form. We assessed risk of bias and calculated pooled odds ratio (OR) estimates with a 95% confidence interval (CI). Thirteen studies (607 EES patients and 678 MES patients) met inclusion criteria for quantitative meta-analysis. In pooled analysis, those who undergo EES have 0.99 times the OR of graft success compared to those with MES (95% CI, 0.84 to 1.16; P=0.894). In qualitative analysis, comparable hearing improvement was observed between the two groups, despite inconsistent audiometric evaluation. The air-bone gaps (ABGs) improved 2.02 dB less in EES than in MES (mean difference of improvements of ABGs, 2.02; 95% CI, –3.84 to –0.20; P=0.029); however, substantial heterogeneity and publication bias limited the integrity of this analysis. Further, EES significantly decreased canalplasty rate, wound complications, and operation time, compared to MES. Moreover, patients receiving EES reported higher cosmetic satisfaction than patients receiving MES. EES can be a good alternative to MES in terms of comparable graft success rate and hearing outcomes in patients receiving tympanoplasty or myringoplasty. Moreover, EES was less invasive, resulting in higher cosmetic satisfaction, reduced morbidity, and shorter operation time. Our results may affect decision-making and outcome prediction in cases of EES; however, confirmation is needed to clarify potential bias.
Tympanic membrane (TM) perforation is a common surgical indication in an otolaryngology practice; it can be managed by tympanoplasty or myringoplasty [1]. Repair of TM perforation via the microscopic ear surgery (MES) is traditionally preferred worldwide, with success rates ranging from 83% to 100% [2-4]. Since the endoscope was introduced for middle ear surgery in the 1970s, assisted or total endoscopic ear surgery (EES) has been introduced to evaluate the degree of disease and to resolve middle ear pathologies [5,6]. Although the transcanal approach using endoscope may be restricted by single-handed surgery, a loss of depth perception, and a steeper learning curve [7], endoscopy is characterized by panoramic, wide angle, and magnified views that can overcome most disadvantages of a microscope, providing effective access to the middle ear with no requirement for postauricular incision and canalplasty [8].
Recently, EES has demonstrated comparable treatment outcomes of MES with respect to TM closure rates, as well as hearing improvement [9-20]. Furthermore, the application of EES for tympanoplasty or myringoplasty has been extended to challenging cases, such as those involving anterior TM perforation and pediatric patients exhibiting a narrow ear canal [21]. A previous systematic review and meta-analysis demonstrated comparable TM closure rates and hearing outcomes between endoscopic and microscopic tympanoplasty; however, the results were limited by a lack of enrolled studies and potential bias that may have affected the integrity of the study [22]. Furthermore, the strength of bias leading to small-study effects has not yet been elucidated. Notably, a growing body of evidence regarding comparative efficacies between the two operative tools has been reported after publication of the previous systematic review and meta-analysis.
Although efficacies and proportions of tympanoplasty performed via endoscopy have gradually increased due to new technologies (e.g., high-definition cameras, 3-mm endoscope, and curved burrs with a protective shaft) [11], it remains unclear whether total EES is a good alternative to MES for repair of TM perforation. Herein, we aimed to explore the therapeutic effects, according to surgical tool, by a systematic review and meta-analysis; further, we aimed to meticulously evaluate the integrity of quantitative analysis.
This systematic review was developed and performed in accordance with recommendations from the Preferred Reporting Items for Systematic Reviews and Meta-Analyses (PRISMA) checklists. A PRISMA flow diagram was used to describe the flow of information throughout various phases of the systematic review [23]. This study utilized quantitative methods to examine reasons for variation in treatment outcomes.
Two of the authors (SYL and YS) independently searched MEDLINE, PubMed, and Embase databases for articles published from database inception through June 30, 2018, for all available studies reporting comparison of the efficacies of tympanoplasty or myringoplasty via EES and MES. Based on the search syntax adopted by a previous systematic review and meta-analysis [22], this study employed the following search keywords. The search keyword for the PubMed database was “(endoscop*tympanoplast*[Title/Abstract] OR endoscop*myringoplasty*[Title/Abstract])”; the search keyword for the Embase database was “(endoscop*tympanoplast*:ab.ti OR endoscop*tympanoplast*:ab,ti)”; the search keyword for the MEDLINE Ovid database, “(endoscop*tympanoplast* OR endoscop*myringoplast*).ti.”
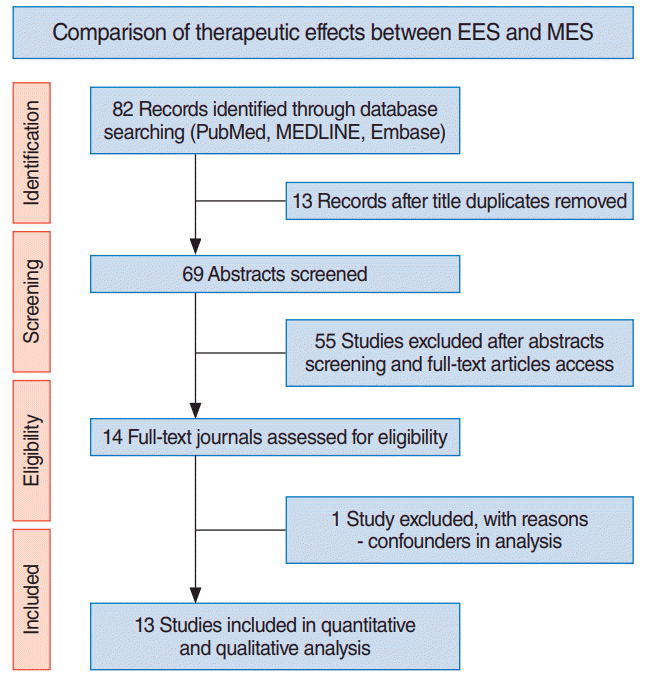
All retrieved articles were independently screened by two authors (SYL and YS) based on titles and abstracts by using the search strategy. Full texts of eligible articles were subsequently evaluated based on inclusion and exclusion criteria (Fig. 1). Inclusion criteria for the present study were as follows: (1) report of a comparison with at least one postoperative outcome including graft success rates, audiometric results, canalplasty rate, and cosmetic results; (2) original articles from peer-reviewed scientific journals published in English. The following types of publications were excluded: (1) animal studies, in vitro studies, review articles, and case reports; (2) publications where original articles were inaccessible (e.g., only abstracts were available) and/or incomplete data were provided; (3) duplicate publications; (4) studies with duplicate data (e.g., a mixture of endoscope-assisted ear surgery and total EES). Thus, the EES group included only patients who received total EES. Unfortunately, we were unable to contact study authors to obtain additional information and further studies.
Two authors reviewed all relevant studies and independently extracted data; any discrepancies were resolved by consensus between the two authors. For meta-analysis, the following information was retrieved: author, year of publication, study design, number of patients, and treatment outcomes. Analysis of pooled proportions was performed; cases with missing or incomplete information were excluded. For treatment outcomes, weighted proportions and their 95% confidence intervals (CIs) were calculated.
In this study, estimated pooled odds ratio (OR) and 95% CIs were calculated by using fixed-effects or random-effects models; selection of random-effects or fixed-effects models was based on a conceptual understanding of the presence of population effects within enrolled studies, rather than statistical results of homogeneity tests. We calculated the I2 statistic to evaluate rates of heterogeneity across studies. If an I2 value of >50% and a P-value of <0.10 were indicated, we classified the heterogeneity of the effect size as substantial [25]. In cases of substantial heterogeneity, the presence of small-study effects, including publication bias, was evaluated; a subsequent trim-and-fill method or sensitivity analysis was used to verify the integrity of the quantitative analysis results. Potential publication bias was examined in analyses involving more than three studies by using a funnel plot. All statistical analyses were performed by using the software package R ver. 3.3.2 (The R Foundation, Vienna, Austria).
A flow diagram including initial identification, screening, eligibility, and inclusion of studies is shown in Fig. 1. Eleven articles met the initial screening criteria based on title and abstract reviews. After evaluating full-length articles, one study was excluded because it included patients who underwent endoscopy as an adjuvant to microscopic tympanoplasty. Finally, 13 studies were included in the meta-analysis: four randomized controlled trials, four prospective, and five restrospective case-controlled studies (Table 1). A total of 1,285 patients served as subjects in the meta-analysis: 607 received EES and 678 received MES. While all subjects receiving EES were performed by the transcanal approach, those receiving MES were performed by the retroauricular (568 out of 678, 87.7%) or endaural approach (80 out of 678, 12.3%). The enrolled studies were conducted between 2001 and 2017; the age of patients ranged from 2 to 82 years. Three of 13 studies only included pediatric patients (cutoff value, 18 years).
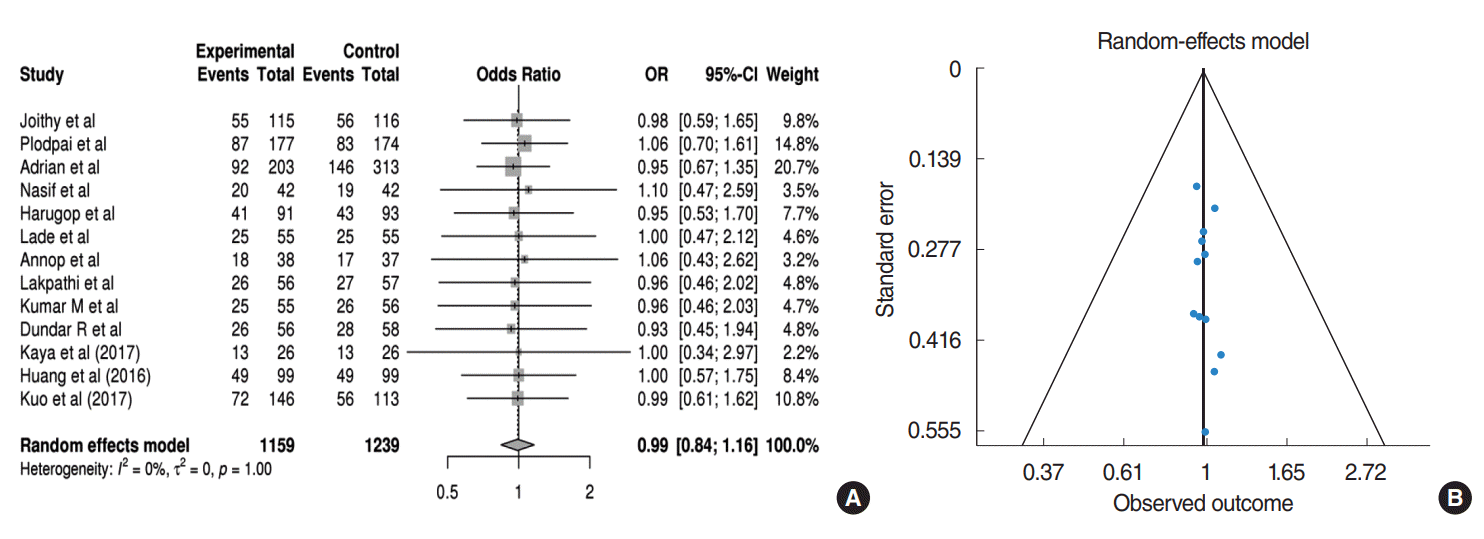
All studies included data regarding postoperative graft success rates. In the pooled analysis (Fig. 2A), those receiving EES have 0.99 times the OR of graft success compared to those receiving MES without statistical significance (95% CI, 0.84 to 1.16; P= 0.894). In addition, no heterogeneity or publication bias were found (Fig. 2B).
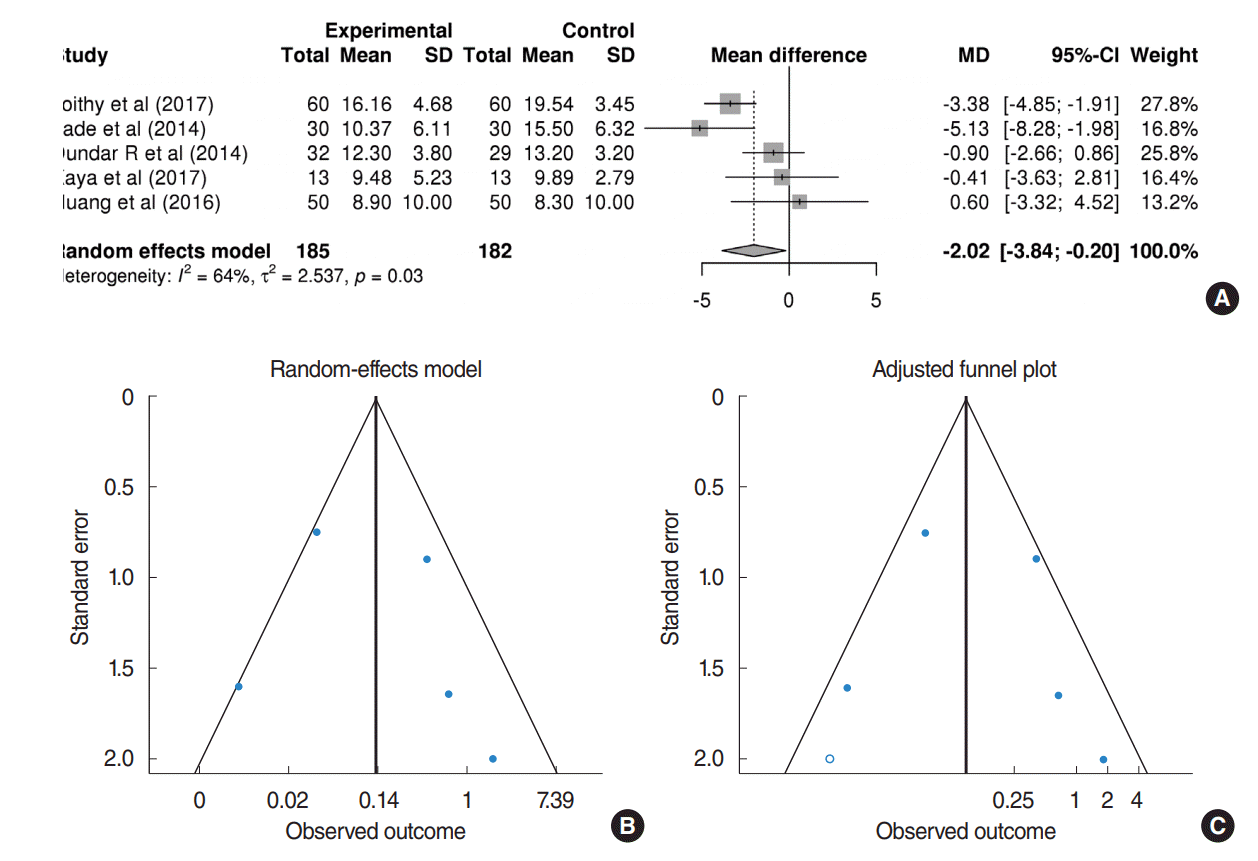
Table 2 shows a qualitative analysis of the hearing outcomes of each study. Despite inconsistent audiometric evaluation among the studies, most demonstrated comparable hearing improvement between EES and MES. Twelve of 13 studies exhibited postoperative hearing outcomes; five studies demonstrating mean and standard deviations of air-bone gaps (ABGs) were available for quantitative meta-analysis. In the pooled analysis with the random-effects model (Fig. 3A), the ABGs improved 2.02 dB less in EES than that in MES (mean difference of improvements of ABGs, 2.02; 95% CI, –3.84 to –0.20; P=0.029). However, a substantial amount of heterogeneity (I2=63.8%, P= 0.026) and publication bias were found (Fig. 3B). After adjustment of the trim-and-fill method, the mean difference of improvements of ABGs was –2.42 (95% CI, –4.18 to –0.67; P= 0.007) (Fig. 3C), indicating that small-study effects did not impact hearing improvement.
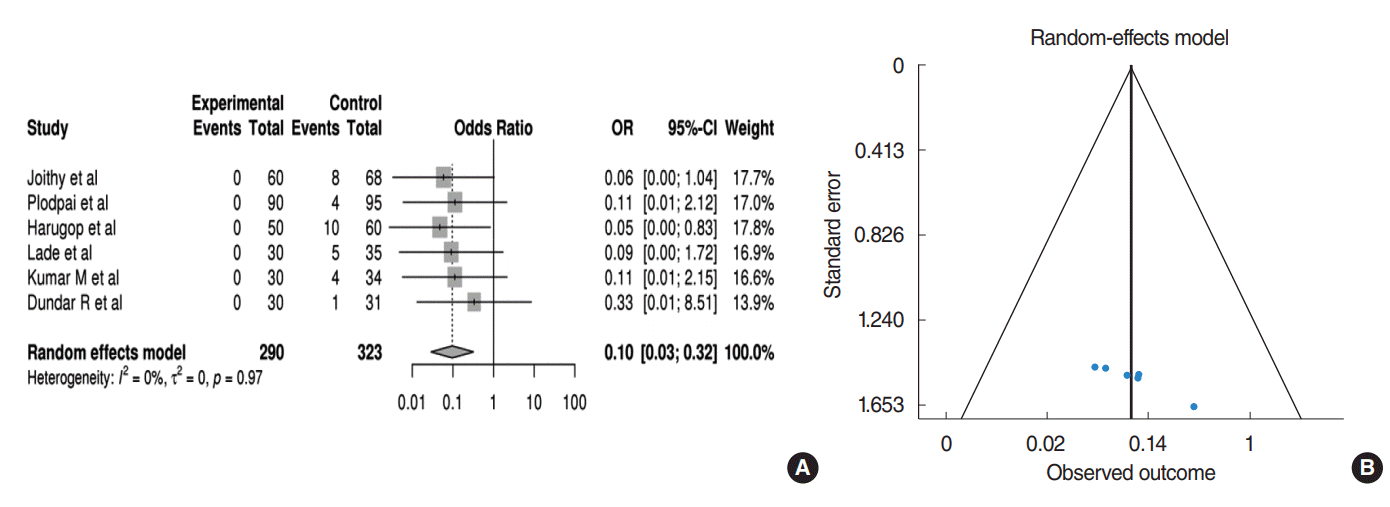
Six studies addressed the comparison of canalplasty outcomes, comprising a total of 581 patients (290 patients in EES; 291 patients in MES). For canalplasty rate, it was defined in a binary fashion. In the pooled analysis (Fig. 4A), those receiving EES have 0.09 times the OR of canalplasty rate compared to those receiving MES (95% CI, 0.02 to 0.32; P<0.001). In addition, no heterogeneity or publication bias were found (Fig. 4B).
Nine studies reported operation time according to operative tool. The operation time for EES seemed to be shorter than for MES; however, data were only available from four studies (183 patients receiving EES; 184 patients receiving MES) regarding mean and standard deviation for quantitative analysis. In the pooled analysis (Fig. 5A), the operation time for EES was significantly shorter than for MES (mean difference of operation time, 37.99 minutes; 95% CI, 2.76 to 73.21; P=0.035). However, a substantial amount of heterogeneity (I2=99.6%, P<0.001) and publication bias were found. In a sensitivity analysis, after excluding the study by Plodpai and Paje [10] that used the overlay technique, the mean difference of operation time was reduced to 24.02 minutes (95% CI, 13.62 to 34.43; P<0.001) (Fig. 5B).
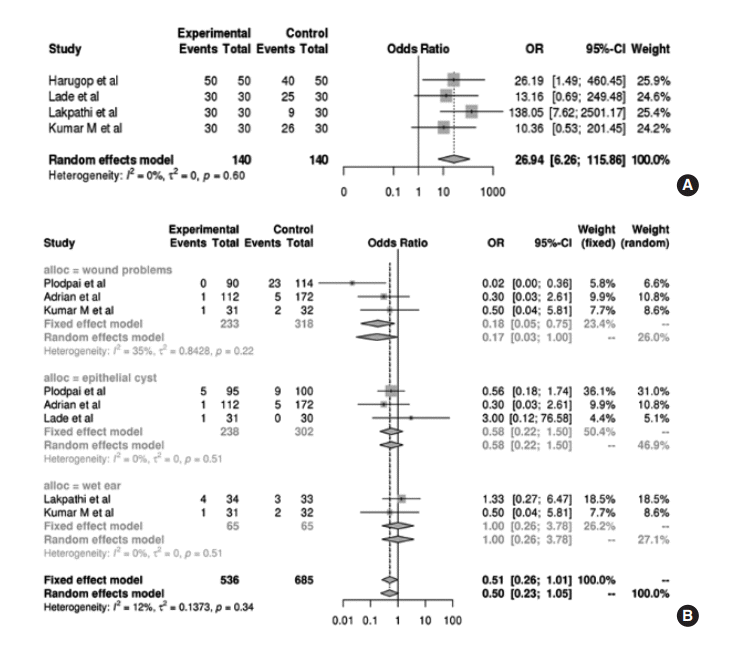
Four studies comprising 80 patients in total evaluated and compared subjective cosmetic results according to poor, satisfactory, and excellent. For cosmetic satisfaction rate in this study, the number of patients rated the cosmetic results as satisfactory or excellent were calculated. In the pooled analysis (Fig. 6A), those receiving EES have 26.94 times the OR of cosmetic satisfaction rate compared to those receiving MES (95% CI, 6.26 to 115.86; P< 0.001).
Various postoperative complications were retrieved from enrolled studies. We quantitatively analyzed the incidence of postoperative complications, with a particular focus on wound problems, epithelial cysts, and wet ear. Data regarding wound problems were available from three studies; pooled analysis demonstrated that patients receiving EES had a significantly lower OR of wound problems than patients receiving MES (OR, 0.17; 95% CI, 0.03 to 1.00; P<0.001). However, there was no significant difference in terms of epithelial cysts from three studies (OR, 0.58; 95% CI, 0.22 to 1.50; P=0.249) and wet ear from two studies (OR, 1.00; 95% CI, 0.26 to 3.78; P=0.621), irrespective of operative tool (Fig. 6B).
We assessed the risk of bias of randomized controlled studies included in the quantitative meta-analysis based on the Cochrane Collaboration tool (Supplementary Table 1). For prospective and retrospective studies, we examined internal validity by using the Newcastle-Ottawa Scale criteria (Supplementary Table 2). In analyses involving more than three studies, publication bias was found in hearing outcomes (P<0.001 for hearing outcomes), except for graft success rate and canalplasty rate. Funnel plots for publication bias with respect to hearing outcomes presented noticeable asymmetry.
In this study, surgical approach-related therapeutic effects were compared with different perspectives through a systematic review and meta-analysis. Graft success rate and hearing improvements of EES and MES were comparable, which supported previous studies suggesting that EES for tympanoplasty or myringoplasty can be a good alternative to MES. Although an slight improvement in ABGs of MES was elicited compared to ABGs of EES, this result seems not clinically meaningful considering small-study effects related to potential publication bias. Additionally, EES may be superior to MES in terms of canalplasty rate, operation time, cosmetic results, and post-treatment complications.
Although a previous meta-analysis regarding a comparison of surgical approach-related graft success rates and hearing outcomes was introduced thus [22], the results were limited by a lack of enrolled studies and subsequent small-study effects that lead to potential bias. Considering that a growing body of evidence on implications of EES has been increased recently, clinical effectiveness between two operative techniques remains to be re-established.
The present study comprised of relatively large patients revealed a comparable graft success rate between endoscopic and microscopic approaches based on the meta-analysis. In qualitative analysis, the graft success rate via the EES ranged from 83% to 100%, which is consistent with that of the MES. Because neither significant risk differences nor publication biases were observed between the two operative tools, the estimated effect in terms of graft success rate may be unalterable. Although age, a factor previously associated with graft success rate, may restrict this result [21], our meta-analysis with a moderator showed that the graft success rate between EES and MES did not depend on age (Supplementary Fig. 1). Moreover, in our qualitative analysis of pediatric patients, the graft success rate of EES was >85%, compatible with the results of a recent meta-analysis of pediatric tympanoplasty [26]. This may be a result of a wider endoscopic surgical view, as well as innovations of endoscopic technology that enable access for tympanoplasty or myringoplasty in nearly all cases [11].
However, previous studies suggested that the comparable graft success rate is more likely associated with grafting technique, rather than surgical approach [22]. Although one of our enrolled studies performed an overlay grafting technique that led to a higher graft success rate (96.7%) and comparable overall success rate [10], our quantitative meta-analysis of graft success rates might be biased to exclusively include the underlay grafting technique. Thus, additional studies, including grafting technique randomization, are warranted to clarify graft success rate based on different approaches.
In qualitative analysis of hearing outcomes, the results consistently demonstrate comparable hearing improvement of EES and MES, despite discrepancies in hearing evaluations. Remarkable TM closure rates between EES and MES may elicit comparable hearing outcomes [22]. Notably, pooled analysis in this study revealed greater hearing improvements in MES than in EES. Potential limitations involving the one-hand technique, such as difficulty in bleeding control and light-induced thermal damage, may affect hearing improvement [27]. However, potential publication bias with a substantial amount of heterogeneity may have influenced the integrity of this analysis, suggesting that the small-study effect was validated by the trim-and-fill method. Moreover, we could not assess sub-group analysis by using a moderator, including perforation site or size and revision surgery that may impact hearing outcomes because only three studies presented data for quantitative analysis of hearing outcomes including mean and standard deviation of ABGs [28].
Given that the surgical view from microscopy can be limited when evaluating complex structures of the external auditory canal, such as a tortuous, stenotic ear canal and bony overhangs, the tympanic annulus could not be completely visualized in 17%–20% of patients who underwent the MES. Therefore, surgeons are likely to drill out bony overhangs to visualize the comprehensive pathology of TM or the middle ear. Partial visualization of the perforation margin, as well as canalplasty, were reported to be significantly associated with prolonged operation time [21]. In our quantitative meta-analysis, a significantly higher canalplasty rate in cases of MES was identified; however, interpretation regarding prolonged operation time awaits further confirmation due to publication bias.
Conversely, the EES is considered to be a less invasive technique that involves reduced morbidity [29]. Endoscopy, characterized by panoramic, wide angle, and magnified views, enhanced performance even in challenging cases, such as anterior TM perforation; hence, no additional canalplasty was required in most cases [21]. Morbidity regarding the postauricular incision appeared to impact cosmetic results [5]. In addition to a postauricular scar, auricular displacement and asymmetry of the pinna could also develop from the postauricular incision; this may yield better cosmetic outcomes for patients who received EES [9]. Similarly, a significantly lower morbidity may cause patients to choose the endoscopic approach, as they returned to normal daily activity sooner than those receiving the MES [12,13].
In this study, EES appeared to be advantageous over MES in terms of minimally invasive technique, which is crucial for clinical outcomes. Nevertheless, transcanal approach using endoscope has some limitations. The one-handed technique is likely to lose to chance of simultaneous dissection and suction maneuver, thereby limiting healthy tissue removal [30]. Given that hemostasis is essential in the setting of one-handed surgical technique, the procedure that minimizes incision and trauma can be required, which in turn would rather hinder the surgical field. A steeper learning curve is likely to be associated with significantly with the one-handed surgical technique. In addition, two-dimensional operative image of EES causes a lack of depth perception that links to potential risk of damage to the surrounding structures not included in the visual field [31]. Even though new technologies to reduce EES related disadvantages have developed [32], the appropriate application of EES, with consideration of its limitation, would be mandatory.
Although this study provides comparative data regarding the efficacy of two surgical approaches with evaluation of the integrity of quantitative analysis, as well as bias analysis that affects the integrity of the results, there are some limitations that should be addressed in future studies. First, a lack of randomized control studies (four of 13) may have led to a small-study effect, which limits the integrity of the analysis. Moreover, except for graft success rate, a relatively small number of published articles were included for other quantitative meta-analyses. Given that the strength of this study might be affected by the small number of patients [33,34], studies involving a larger cohort are warranted to further support our current interpretations. Second, enrolled studies had potential biases, as shown in the risk of bias summary (Supplementary Table 1) and quality assessment by the Newcastle-Ottawa scale (Supplementary Table 2). In addition, a publication bias was observed in most risk factor analyses, except for graft success rate and canalplasty rate. Third, risk factors that influence surgical outcomes, such as age and size or site of TM perforation, were inconsistent among the included studies. Deviated outcomes are theoretically possible due to these uncontrolled factors; therefore, a large cohort with randomization must be established in a future study. Despite limited heterogeneity and bias in this study, current results may be useful for decision-making and outcome prediction in patients receiving EES. Further well-designed large cohort studies are necessary to elucidate factors related to successful treatment outcomes of EES in patients receiving tympanoplasty or myringoplasty.
Taken together, the rate of graft success and hearing outcomes of EES were comparable with those of MES for patients receiving tympanoplasty or myringoplasty. Moreover, EES, a less-invasive technique, showed better outcomes for the rate of canalplasty, cosmetic result, wound problem, and operation time. Therefore, our results may be useful for decision-making and outcome prediction in patients receiving EES; however, further confirmation is required due to limited heterogeneity and potential bias in this study.
• Endoscopic ear surgery (EES) have comparable outcomes of graft success compared to microscopic ear surgery (MES).
• EES significantly decreased canalplasty rate, wound complications, and operation time compared to MES did.
• Patients receiving EES reported higher cosmetic satisfaction than patients receiving MES.
• Air-bone gap improved 2.02 dB less in EES than in MES; however, substantial heterogeneity and publication bias limited the integrity of this analysis.
• Our results may affect decision-making and outcome prediction in cases of EES, but confirmation is needed to clarify potential bias.
ACKNOWLEDGMENTS
This study was supported by a clinical research grant from the SMG-SNU Boramae Medical Center, Seoul, Republic of Korea.
SUPPLEMENTARY MATERIALS
Supplementary materials can be found via https://doi.org/10.21053/ceo.2018.01277.
REFERENCES
1. Tan HE, Santa Maria PL, Eikelboom RH, Anandacoomaraswamy KS, Atlas MD. Type I tympanoplasty meta-analysis: a single variable analysis. Otol Neurotol. 2016; Aug. 37(7):838–46.
2. Rizer FM. Overlay versus underlay tympanoplasty. Part II: the study. Laryngoscope. 1997; Dec. 107(12 Pt 2):26–36.
3. Mundra RK, Sinha R, Agrawal R. Tympanoplasty in subtotal perforation with graft supported by a slice of cartilage: a study with near 100 % results. Indian J Otolaryngol Head Neck Surg. 2013; Dec. 65(Suppl 3):631–5.
4. Jumaily M, Franco J, Gallogly JA, Hentzelman JL, Costa DJ, Wild AP, et al. Butterfly cartilage tympanoplasty outcomes: a single-institution experience and literature review. Am J Otolaryngol. 2018; Jul-Aug. 39(4):396–400.
5. Kozin ED, Gulati S, Kaplan AB, Lehmann AE, Remenschneider AK, Landegger LD, et al. Systematic review of outcomes following observational and operative endoscopic middle ear surgery. Laryngoscope. 2015; May. 125(5):1205–14.
6. Migirov L, Shapira Y, Horowitz Z, Wolf M. Exclusive endoscopic ear surgery for acquired cholesteatoma: preliminary results. Otol Neurotol. 2011; Apr. 32(3):433–6.
8. Furukawa T, Watanabe T, Ito T, Kubota T, Kakehata S. Feasibility and advantages of transcanal endoscopic myringoplasty. Otol Neurotol. 2014; Apr. 35(4):e140–5.
9. Jyothi AC, Shrikrishna BH, Kulkarni NH, Kumar A. Endoscopic myringoplasty versus microscopic myringoplasty in tubotympanic CSOM: a comparative study of 120 cases. Indian J Otolaryngol Head Neck Surg. 2017; Sep. 69(3):357–62.
10. Plodpai Y, Paje N. The outcomes of overlay myringoplasty: endoscopic versus microscopic approach. Am J Otolaryngol. 2017; Sep-Oct. 38(5):542–6.
11. James AL. Endoscope or microscope-guided pediatric tympanoplasty? Comparison of grafting technique and outcome. Laryngoscope. 2017; Nov. 127(11):2659–64.
12. Nassif N, Berlucchi M, Redaelli de Zinis LO. Tympanic membrane perforation in children: endoscopic type I tympanoplasty, a newly technique, is it worthwhile. Int J Pediatr Otorhinolaryngol. 2015; Nov. 79(11):1860–4.
13. Harugop AS, Mudhol RS, Godhi RA. A comparative study of endoscope assisted myringoplasty and micrsoscope assisted myringoplasty. Indian J Otolaryngol Head Neck Surg. 2008; Dec. 60(4):298–302.
14. Lade H, Choudhary SR, Vashishth A. Endoscopic vs microscopic myringoplasty: a different perspective. Eur Arch Otorhinolaryngol. 2014; Jul. 271(7):1897–902.
15. Raj A, Meher R. Endoscopic transcanal myringoplasty: a study. Indian J Otolaryngol Head Neck Surg. 2001; Jan. 53(1):47–9.
16. Lakpathi G, Sudarshan Reddy L. Comparative study of endoscope assisted myringoplasty and microscopic myringoplasty. Indian J Otolaryngol Head Neck Surg. 2016; Jun. 68(2):185–90.
17. Kumar M, Kanaujia SK, Singh A. A comparative study of endoscopic myringoplasty vs conventional myringoplasty. Otorhinolaryngology Clinics. 2015; 7(3):132–37.
18. Dundar R, Kulduk E, Soy FK, Aslan M, Hanci D, Muluk NB, et al. Endoscopic versus microscopic approach to type 1 tympanoplasty in children. Int J Pediatr Otorhinolaryngol. 2014; Jul. 78(7):1084–9.
19. Kaya I, Sezgin B, Sergin D, Ozturk A, Eraslan S, Gode S, et al. Endoscopic versus microscopic type 1 tympanoplasty in the same patients: a prospective randomized controlled trial. Eur Arch Otorhinolaryngol. 2017; Sep. 274(9):3343–9.
20. Huang TY, Ho KY, Wang LF, Chien CY, Wang HM. A comparative study of endoscopic and microscopic approach type 1 tympanoplasty for simple chronic otitis media. J Int Adv Otol. 2016; Apr. 12(1):28–31.
21. Tseng CC, Lai MT, Wu CC, Yuan SP, Ding YF. Endoscopic transcanal myringoplasty for anterior perforations of the tympanic membrane. JAMA Otolaryngol Head Neck Surg. 2016; Nov. 142(11):1088–93.
22. Tseng CC, Lai MT, Wu CC, Yuan SP, Ding YF. Comparison of the efficacy of endoscopic tympanoplasty and microscopic tympanoplasty: a systematic review and meta-analysis. Laryngoscope. 2017; Aug. 127(8):1890–6.
23. Liberati A, Altman DG, Tetzlaff J, Mulrow C, Gotzsche PC, Ioannidis JP, et al. The PRISMA statement for reporting systematic reviews and meta-analyses of studies that evaluate health care interventions: explanation and elaboration. PLoS Med. 2009; Jul. 6(7):e1000100.
24. Kuo CH, Wu HM. Comparison of endoscopic and microscopic tympanoplasty. Eur Arch Otorhinolaryngol. 2017; Jul. 274(7):2727–32.
25. Higgins JP, Thompson SG, Deeks JJ, Altman DG. Measuring inconsistency in meta-analyses. BMJ. 2003; Sep. 327(7414):557–60.
26. Vrabec JT, Deskin RW, Grady JJ. Meta-analysis of pediatric tympanoplasty. Arch Otolaryngol Head Neck Surg. 1999; May. 125(5):530–4.
27. Kozin ED, Lehmann A, Carter M, Hight E, Cohen M, Nakajima HH, et al. Thermal effects of endoscopy in a human temporal bone model: implications for endoscopic ear surgery. Laryngoscope. 2014; Aug. 124(8):E332–9.
28. Nardone M, Sommerville R, Bowman J, Danesi G. Myringoplasty in simple chronic otitis media: critical analysis of long-term results in a 1,000-adult patient series. Otol Neurotol. 2012; Jan. 33(1):48–53.
29. Kakehata S, Futai K, Sasaki A, Shinkawa H. Endoscopic transtympanic tympanoplasty in the treatment of conductive hearing loss: early results. Otol Neurotol. 2006; Jan. 27(1):14–9.
30. Marchioni D, Grammatica A, Alicandri-Ciufelli M, Genovese E, Presutti L. Endoscopic cochlear implant procedure. Eur Arch Otorhinolaryngol. 2014; May. 271(5):959–66.
31. Choi N, Noh Y, Park W, Lee JJ, Yook S, Choi JE, et al. Comparison of endoscopic tympanoplasty to microscopic tympanoplasty. Clin Exp Otorhinolaryngol. 2017; Mar. 10(1):44–9.
32. De Zinis LO, Berlucchi M, Nassif N. Double-handed endoscopic myringoplasty with a holding system in children: preliminary observations. Int J Pediatr Otorhinolaryngol. 2017; May. 96:127–30.
Table 1.
Study/country | Study design |
EES vs. MES |
Comparative parameter | Follow-up period | ||
---|---|---|---|---|---|---|
Anesthesia, grafting techniques, surgical type | No. of patients | Age (yr, range) | ||||
Jyothi et al. (2017) [9]/India | RCT | LA, underlay, EM vs. LA, underlay, R-MM (n=60) | 60 (M:F=39:21) vs. 60 (M:F=26:34) | 28.5 vs. 31.4 | 1. Graft success rate | 12 mo |
2. Hearing outcomes | ||||||
3. Canalplasty rate | ||||||
Plodpai and Paje (2017) [10]/Thailand | Retrospective | LA, overlay, EM vs. LA, overlay, R-MM (n=91) | 90 (M:F=33:57) vs. 91 (M:F=23:68) | 45.5 (36–56) vs. 46 (22–58) | 1. Graft success rate | 6 mo |
2. Hearing outcomes | ||||||
3. Canalplasty rate | ||||||
4. Surgical time | ||||||
5. Postoperative outcomes | ||||||
James (2017) [11]/Canada | Prospective | GA, EM or ET vs. GA, R-MM or R-MT (n=167) | 111 vs. 167 | 12.7 (2–18) | 1. Graft success rate | 12 mo |
2. Postoperative outcomes | ||||||
Nassif et al. (2015) [12]/Italy | Retrospective | GA, underlay, EM vs. GA, underlay, R-MM (n=19) or E-MM (n=4) | 20 (M:F=10:12) vs. 23 (M:F=17:6) | 11 (7–16) vs. 9 (5–16) | 1. Graft success rate | 6–108 mo |
2. Hearing outcomes | ||||||
3. Surgical time | ||||||
Harugop et al. (2008) [13]/India | RCT | Underlay, EM vs. underlay, R-MM (n=45) or E-MM (n=5) 90 Under LA; 10 under GA | 50 vs. 50 | 15–65 | 1. Graft success rate | 6 mo |
2. Hearing outcomes | ||||||
3. Canalplasty rate | ||||||
4. Cosmetic results | ||||||
5. Surgical time | ||||||
Lade et al. (2014) [14]/India | RCT | Underlay, EM vs. underlay R-MM (n=30) >16 yr Under LA; ≤16 yr under GA | 30 (M:F=15:15) vs. 30 (M:F=13:17) | 28.30 (SD, 9.39) vs. 28.30 (SD, 9.39) | 1. Graft success rate | 6 mo |
2. Hearing outcomes | ||||||
3. Canalplasty rate | ||||||
4. Cosmetic result | ||||||
5. Postoperative outcomes | ||||||
Raj and Meher (2001) [15]/India | Prospective | LA, underlay, EM vs. LA, underlay, E-MM (n=20) | 20 vs. 20 | NA | 1. Graft success rate | 10 wk |
2. Hearing outcomes | ||||||
Lakpathi et al. (2016) [16]/India | Prospective | LA, underlay, EM vs. LA, underlay, R-MM (n=30) | 30 (M:F=18:12) vs. 30 (M:F=22:8) | 15–55 | 1. Graft success rate | 6 mo |
2. Hearing outcomes | ||||||
3. Cosmetic result | ||||||
4. Surgical time | ||||||
5. Postoperative outcomes | ||||||
Kumar et al. (2015) [17]/India | Prospective | LA, underlay, EM vs. LA, underlay, R-MM (n=30) | 30 vs. 30 | 18–45 | 1. Graft success rate | 6 mo |
2. Hearing outcomes | ||||||
3. Canalplasty rate | ||||||
4. Cosmetic result | ||||||
5. Surgical time | ||||||
6. Postoperative outcomes | ||||||
Dundar et al. (2014) [18]/Turkey | Retrospective | GA, underlay, EM vs. GA, underlay, R-MM (n=29) | 32 (M:F=14:17) vs. 29 (M:F=19:10) | 12.4 (10.04–14.76) vs. 11.89 (9.82–13.96) | 1. Graft success rate | 12 mo |
2. Hearing outcomes | ||||||
3. Canalplasty rate | ||||||
4. Surgical time | ||||||
Kaya et al. (2017) [19]/Turkey | RCT | GA, underlay, ET vs. GA, underlay, R-MT (n=13) | 13 (M:F=6:7) vs. 13 (M:F=6:7) | 36.17±3.61 (17–53) vs. 36.17±3.61 (17–53) | 1. Graft success rate | 6 mo |
2. Hearing outcomes | ||||||
3. Postoperative outcomes | ||||||
4. Surgical time | ||||||
Huang et al. (2016) [20]/Taiwan | Retrospective | GA, underlay, ET vs. GA, underlay, R-MT (n=50 ears) | 47 (M:F=17:30) vs. 48 (M:F=16:32) | 54.2±15.6 vs. 49.9±15.0 (13–82) | 1. Graft success rate | 6 mo |
2. Hearing outcomes | ||||||
3. Surgical time | ||||||
Kuo and Wu (2017) [24]/Taiwan | Retrospective | GA, underlay, ET vs. GA, underlay, R-MT (n=6) or E-MT (n=51) | 74 (M:F=27:47) vs. 57 (M:F=25:32) | 57.49 (16–86) vs. 55.72 (15–77) | 1. Graft success rate | 3–12 mo |
2. Hearing outcomes | ||||||
3. Surgical time |
EES, endoscopic ear surgery; MES, microscopic ear surgery; RCT, randomized controlled trial; LA, local anesthesia; EM, endoscopic myringoplasty; R, retroauricular approach; MM, microscopic myringoplasty; M, male; F, female; GA, general anesthesia; ET, endoscopic tympanoplasty; MT, microscopic tympanoplasty; E, endaural approach; SD, standard deviation; NA, not available.
Table 2.
Study/country | PTA calculation (frequency) |
EES vs. MES |
||
---|---|---|---|---|
Preoperative audiometry | Postoperative audiometry | Gain in ABG | ||
Jyothi et al. (2017) [9]/lndia | NA | Mean ABG (dB): 34.16 vs. 35.54 | Mean ABG (dB): 18 vs. 16 | Mean improvement of ABGs (dB): 16.16 (SD, 4.68) vs. 19.54 (SD, 3.45) |
Plodpai and Paje (2017) [10]/Thailand | 0.5, 1, 2, and 4 kHz | Median (range) ABG (dB): 25 (20-31) vs. 27 (16-30) | Median (range) ABG (dB): 13(5-18) vs. 15(10-19) | Median improvement of ABGs (dB)j 12 vs. 12 |
James (2017) [11]/Canada | NA | NA | NA | NA |
Nassif et al. (2015) [12]/Italy | 0.5, 1, 2, and 4 kHz | Median ABG (dB): 16.6 vs. 19.4 | Median ABG (dB): 6.6 vs. 6.2 | Median improvement of ABGs (dB): 9.4 vs. 11.2 |
Harugop et al. (2008) [13]/lndia | 0.5, 1, and 2 kHz | ABG <10dB:0vs. 0 | ABG <10 dB: 23 (46%) vs. 10(20%) | NA |
10dB<ABG<20dB: 20 (40%) vs. 20 (4%) | 10 dB<ABG<20 dB: 22 (44%) vs. 35 (70%) | |||
20 dB<ABG<30 dB: 28 (56%) vs. 30 (60%) | 20 dB<ABG<30 dB: 5 (10%) vs. 5 (10%) | |||
30 dB<ABG<40 dB: 2 (4%) vs. 0 | 30dB<ABG<40dB:0vs. 0 | |||
Lade et al. (2014) Bindia | NA | Mean ABG (dB): 28.5 (SD, 5.11) vs. 32.37 (SD, 5.80) | Mean ABGs (dB): 18.13 (SD, 7.11) vs. 16.87 (SD, 6.84) | Mean improvement of ABGs (dB): 10.37 (SD, 6.11) vs. 15.5 (SD, 6.32) |
Raj and Meher (2001) [15]/lndia | NA | ABG <10 dB: 2(10%) vs. 2(10%) | ABG <10 dB: 12(60%) vs. 11 (55%) | ABG <10 dB: 14(70%) vs. 16 (80%) |
10 dB<ABG<20 dB: 6 (30%) vs. 9 (45%) | 10 dB<ABG<20 dB: 6 (30%) vs. 6 (30%) | 10 dB<ABG<20 dB: 6 (30%) vs. 3 (15%) | ||
20 dB<ABG<30 dB: 10 (50%) vs. 7 (35%) | 20 dB<ABG<30 dB: 1 (5%) vs. 2 (10%) | 20 dB<ABG<30 dB: 0 vs. 1 (5%) | ||
30 dB<ABG<40 dB: 2 (10%) vs. 2 (10%) | 30 dB<ABG<40 dB: 1 (5%) vs. 1 (5%) | 30dB<ABG<40dB:0vs. 0 | ||
Lakpathi et al. (2016) [16]/lndia | 0.5, 1, and 2 kHz | ABG <10dB:0vs. 0 | ABG <10dB: 14 (46%) vs. 7 (25%) | NA |
10dB<ABG<20dB: 12 (40%) vs. 12 (40%) | 10 dB<ABG<20 dB: 13 (44%) vs. 19 (65%) | |||
20 dB<ABG<30 dB: 15 (50%) vs. 18 (60%) | 20 dB<ABG<30 dB: 3 (10%) vs. 3 (10%) | |||
30 dB<ABG<40 dB: 3 (10%) vs. 0 | 30dB<ABG<40dB:0vs. 0 | |||
Kumar et al. (2015) [17]/lndia | NA | Mean ABG (dB): 30 vs. 31.53 | Mean ABG (dB): 15 vs. 16.03 | Mean improvement of ABGs (dB): 15.03 vs. 13.96 |
Dundar et al. (2014) [18]/Turkey | 0.5, 1, 2, and 4 kHz | Mean ABG (dB): 20.40 (SD, 4.33) vs. 21.34 (SD, 3.90) | Mean ABG (dB): 8.12 (SD, 3.27) vs. 8.13 (SD, 2.43) | Mean improvement of ABGs (dB): 12.3 (SD, 3.8) vs. 13.2 (SD, 3.2) |
Kaya et al. (2017) [19]/Turkey | 0.5, 1, 2, and 4 kHz | Mean ABG (dB): 23.23 (SD, 6.79) vs. 24.89 (SD, 6.62) | Mean ABG (dB): 13.75 (SD, 3.37) vs. 15.00 (SD, 4.64) | Mean improvement of ABGs (dB): 9.48 (SD, 5.23) vs. 9.89 (SD, 2.79) |
Huang et al. (2016) [20]/Taiwan | 0.5, 1, and 2 kHz | Mean ABG (dB): 21.6 (SD, 11.2) vs. 21.4 (SD, 10.6) | Mean ABG (dB): 12.7 (SD, 8.8) vs. 13.1 (SD, 9.4) | Mean improvement of ABGs (dB): 8.9 (SD, 10.0) vs. 8.3 (SD, 10.0) |
Kuo and \Nu (2017) [24]ATaiwan | 0.5, 1, and 2 kHz | Mean ABG (dB): 22.48 vs. 26.7 | Mean ABG (dB): 11.79 vs. 18.7 | Mean improvement of ABGs (dB): 10.69 vs. 8 |