INTRODUCTION
MATERIALS AND METHODS
Study population
Treatment process
Blood tests
Obesity
Severity of initial facial paralysis
Recovery time
Statistical analysis
RESULTS
Table 1.
| Variable | Value |
|---|---|
| No. of patients | 51 |
| Male:female | 16:35 |
| Age (yr) | 39.7±20.1 |
| Recovery time (day)b) | 48.9±35.9 |
| Initial severity (H-B grade) | 3.8±0.9 |
| BMI (kg/m2) | 23.2±4.2 |
| Underlying disease | |
| Obesity:non-obesity | 16:35 |
| HTN:non-HTN | 11:40 |
| DM:non-DM | 7:44 |
| Blood laboratory test | |
| Neutrophil (%) | 65.9±14.4 |
| Lymphocyte (%) | 26.1±11.1 |
| Monocyte (%) | 4.5±2.0 |
| Eosinophil (%) | 1.7±1.7 |
| Basophil (%) | 0.4±0.3 |
| NLR | 3.8±3.7 |
| PLR | 171.3±116.9 |
| Platelet count (/mL) | 284,588.2±91,036.5 |
| WBC count (/mL) | 8,501.6±3,016.1 |
| HbA1c (%) | 5.7±0.7 |
| Electrodiagnostic test | |
| ENoG 5 days after onset (%) | 50.8±21.9 |
Values are presented as mean±standard deviation.
H-B grade, House-Brackmann grade; BMI, body mass index; HTN, hypertension; DM, diabetes mellitus; NLR, neutrophil lymphocyte ratio (absolute neutrophil count/absolute lymphocyte count); PLR, platelet to lymphocyte ratio (platelet count/absolute lymphocyte count); WBC, white blood cell; HbA1c, glycated hemoglobin; ENoG, electroneuronography.
Table 2.
| Variable | Mild to moderate palsy | Severe palsy | P-value |
|---|---|---|---|
| No. of patients | 39 | 12 | |
| Male:female | 10:29 | 6:6 | 0.157 |
| Age (yr) | 38.6±19.5 | 43.3±22.2 | 0.571 |
| Recovery time (day)b) | 39.1±28.9 | 78.6±41.3 | 0.002* |
| BMI (kg/m2) | 22.6±3.4 | 25.1±5.9 | 0.069 |
| Underlying disease | |||
| Obesity:non-obesity | 9:30 | 7:5 | 0.033* |
| HTN:non-HTN | 9:30 | 2:10 | 1.000 |
| DM:non-DM | 4:35 | 3:9 | 0.334 |
| Blood laboratory test | |||
| Neutrophil (%) | 63.8±14.4 | 72.9±12.4 | 0.053 |
| Lymphocyte (%) | 27.8±11.1 | 20.5±9.6 | 0.048* |
| Monocyte (%) | 4.6±2.1 | 4.1±1.9 | 0.506 |
| Eosinophil (%) | 1.9±1.8 | 1.0±0.9 | 0.098 |
| Basophil (%) | 0.5±0.3 | 0.3±0.2 | 0.112 |
| NLR | 3.5±3.8 | 4.8±3.2 | 0.048* |
| PLR | 143.2±100.4 | 195.9±160.0 | 0.807 |
| Platelet count (/mL) | 278,410.3±73,129.6 | 304,666.7±136,460.0 | 0.973 |
| WBC count (/mL) | 7,912.6±2,627.5 | 10,415.8±3,503.4 | 0.021* |
| HbA1c (%) | 5.7±0.7 | 5.9±0.7 | 0.154 |
| Electrodiagnostic test | |||
| ENoG (%) | 56.1±18.8 | 33.6±23.3 | 0.010* |
Values are presented as mean±standard deviation.
BMI, body mass index; HTN, hypertension; DM, diabetes mellitus; NLR, neutrophil to lymphocyte ratio (absolute neutrophil count/absolute lymphocyte count); PLR, platelet to lymphocyte ratio (platelet count/absolute lymphocyte count); WBC, white blood cell; HbA1c, glycated hemoglobin; ENoG, electroneuronography; H-B grade, House-Brackmann grade.
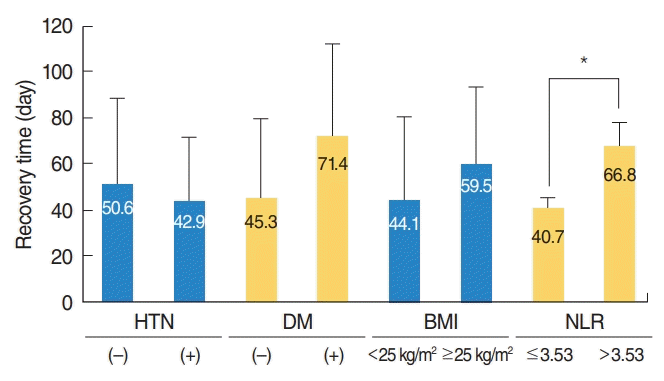
 | Fig. 1.Relationships between hypertension (HTN), diabetes mellitus (DM), body mass index (BMI), and neutrophil to lymphocyte ratio (NLR) and recovery time in patients with Bell’s palsy. Normal weight, BMI <25 kg/m2 ; obesity, BMI ≥25 kg/m2 and normal NLR, ≤3.53; high NLR, >3.53. *P<0.05. |
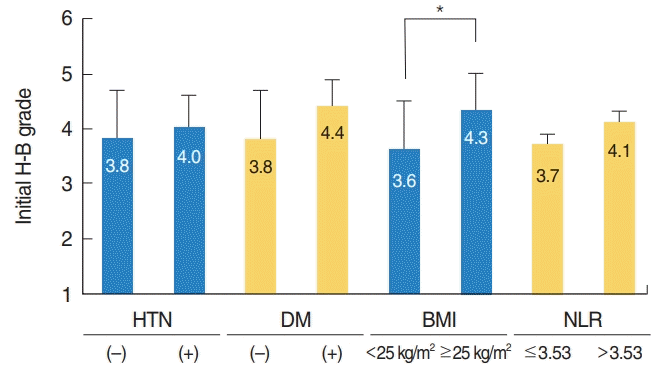
 | Fig. 2.Relationships between hypertension (HTN), diabetes mellitus (DM), body mass index (BMI), and neutrophil to lymphocyte ratio (NLR) and initial severity in patients with Bell’s palsy. H-B grade, House-Brackmann grade; normal weight, BMI <25 kg/m2 ; obesity, BMI ≥25 kg/m2 ; normal NLR, ≤3.53; high NLR, >3.53. *P<0.05. |


 PDF
PDF Citation
 Print
Print


 XML Download