Journal List > Clin Exp Otorhinolaryngol > v.12(1) > 1157725

Jeon, Cho, Park, Kim, Jeon, Jang, and Kim: In Vivo Vibration Measurement of Middle Ear Structure Using Doppler Optical Coherence Tomography: Preliminary Study

Abstract

Objectives

Doppler optical coherence tomography (DOCT) is useful for both, the spatially resolved measurement of the tympanic membrane (TM) oscillation and high-resolution imaging. We demonstrated a new technique capable of providing real-time two-dimensional Doppler OCT image of rapidly oscillatory latex mini-drum and in vivo rat TM and ossicles.

Methods

Using DOCT system, the oscillation of sample was measured at frequency range of 1–4 kHz at an output of 15 W. After the sensitivity of the DOCT system was verified using a latex mini-drum consisting of a 100 μm-thick latex membrane, changes in displacement of the umbo and contacted area between TM and malleus in normal and pathologic conditions.

Results

The oscillation cycles of the mini-drum for stimulus frequencies were 1.006 kHz for 1 kHz, 2.012 kHz for 2kHz, and 3.912 kHz for 4 kHz, which means that the oscillation cycle of the mini-drum become short in proportional to the frequency of stimuli. The oscillation cycles of umbo area and the junction area in normal TM for frequencies of the stimuli showed similar integer ratio with the data of latex mini-drum for stimuli less than 4 kHz. In the case of middle ear effusion condition, the Doppler signal showed a tendency of attenuation in all frequencies, which was prominent at 1 kHz and 2 kHz.

Conclusion

The TM vibration under sound stimulation with frequencies from 1 kHz to 4 kHz in normal and pathologic conditions was demonstrated using signal demodulation method in in vivo condition. The OCT technology could be helpful for functional and structural assessment as an optional modality.

INTRODUCTION

Laser Doppler vibrometry (LDV) is the gold standard method for obtaining noncontact vibration measurements in hearing research [1], but it has several drawbacks. LDV measurements require reflective microbeads be placed on the structure to enhance the signal-to-noise ratio. For small animals, microbeads are positioned through a small opening usually made in the cochlear bone. However, this opening can damage the function of the cochlea, thus reducing the likelihood of obtaining reliable results. Furthermore, LDV cannot provide a high-resolution depth-resolved cross-sectional map of structural and vibrational information because of the interference caused by the long coherence length of the laser.
Optical interferometry is ideally suited for precise measurements of sub-nanometer-level vibration [2]. There has been a growing interest in the field of otology to adopt Doppler optical coherence tomography (DOCT) and vibrometry for the study of hearing mechanisms. Lee et al. [3] analyzed the vibrations of tectorial membrane and basilar membrane within the unopened cochlea in vivo. In that study, cochlear amplification process was measured by depth resolved displacement measurements through the surrounding bone noninvasively. In addition, the resolution and sensitivity of OCT and Doppler techniques have been improved enough to provide reliable structural and functional data of the inner and middle ears [4]. DOCT was used in various studies on sound transduction in the inner ear [5-8].
LDV applied in many studies has shown to be a promising technique and as an exclusive tool for the diagnosis and differentiation of intact and diseased middle ears. But, it is usually a single point measurement of sound induced vibration at a point near the umbo of the tympanic membrane (TM). This method lacks information about the structural features of the TM, that is in-depth visualization is not available. Furthermore, LDV cannot provide a high-resolution depth resolved cross-sectional map of structural and vibrational information because of the interference caused by the long coherence length of laser.
Sound is collected by the external ear and sent to the cochlea via vibration of the TM and ossicles. Because the structure of the middle ear, which includes the TM and ossicles, makes it more accessible for an instrument that measures vibration than the inner ear, experiments on sound transmission have been performed on animals using LDV [9,10]. OCT is a promising modality for providing high-resolution images of the structure of the middle ear in three dimensions (>10 μm). Furthermore, phase-resolved OCT can quantify the vibration of the TM. Few studies have dealt with vibration in the middle ear, with most being ex vivo studies [2,11,12].
The recently developed graphics processing unit (GPU) allows very fast processing of OCT signals, in addition to executing parallel, general-purpose numerical solutions, thus surpassing the functionality of central processing units [4,13,14]. In this study, we estimated and visualized the two-dimensional (2D) and three-dimensional (3D) shapes of normal and abnormal in vivo TM vibrations in small animals with respect to sound stimuli of different frequencies in real-time using a GPU [14]. Furthermore, we reconstructed the sinusoidal waveforms of the stimuli using a signal demodulation-processing algorithm. Threedimensional images of the in vivo vibration pattern were reconstructed. To the best of our knowledge, the proposed DOCT technique can be considered as an ideal implementation for real-time in vivo measurements.

MATERIALS AND METHODS

DOCT system

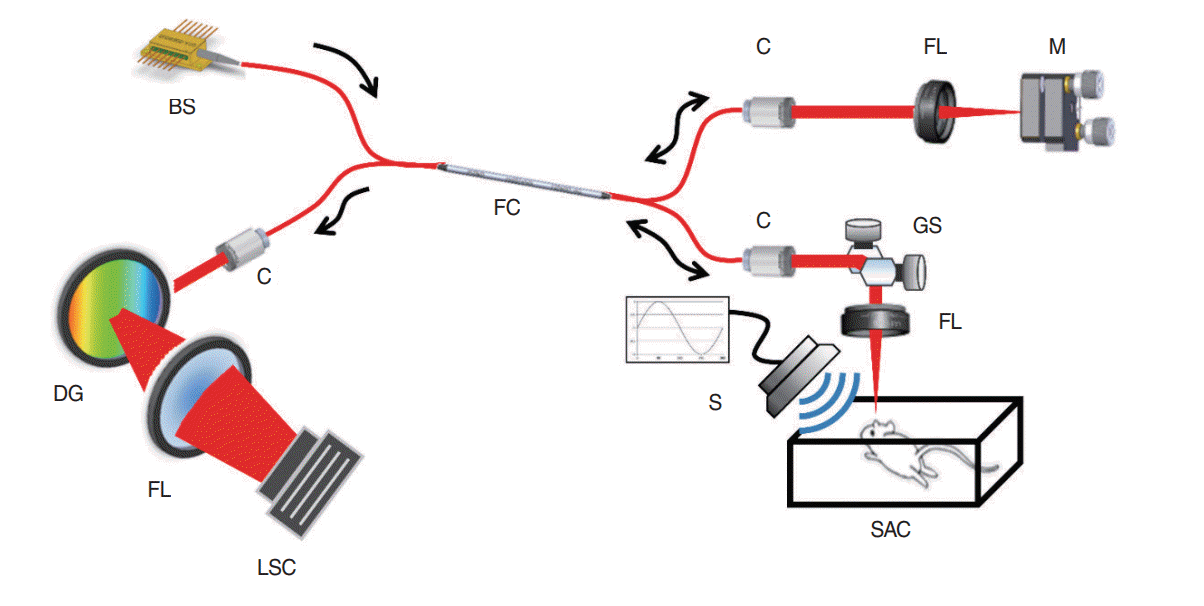
The schematic diagram of the DOCT system is shown in Fig. 1. The detector of the DOCT system was a 12-bit CMOS line scan camera (Sprint spL2048-140 km; Basler, Ahrensburg, Germany) with an effective scan rate of 70,000 lines/sec at 2048-pixel mode. The transmission-type diffraction grating (spatial frequency, 1,800 lines/mm; nominal angle of incidence and angle of diffraction, 46.05°; Wasatch Photonics, Durham, NC, USA) was adapted to enhance light efficiency in the detection path. A fiberbased interferometer was combined with a superluminescent diode (SLD; λ0=850 nm, Δλ=55 nm; Exalos, Schlieren, Switzerland) as the light source. We used SLDs for the optical source used in the OCT system. The source power is 14 mW and the final sample arm power is 7 mW which is exposed to the skin. This is by far less than the maximum permissible exposure of 500 mW, as stated in American National Standards Institute [15]. The light source was split into sample and reference paths, with the latter terminated by a stationary mirror. The sample path delivered light to a sample and collected light backscattered from different depths in the sample. B-mode scanning was performed using a galvanometer scanning mirror (GVS002; Thorlabs, Newton, NJ, USA) at the back focal plane of the objective lens in the sample path. In this paper, a GPU accelerated mode using a graphics card (GeForce GTX 480, 700-MHz clock rate, 480 CUDA processors; NVIDIA, Santa Clara, CA, USA) was used for real-time DOCT signal processing [14,16,17]. The axial and lateral resolutions of the system were approximately 4 μm and 12 μm, respectively, and the measured depth range was 2 mm. A pure tone was generated by a loudspeaker with the sound ranging in frequency from 20 Hz to 20 kHz at an output of 15 W.

Vibrography data analysis

The Doppler frequency shift generated by vibration of the sample was detected by a phase signal and the effect was calculated for each corresponding pixel of the M-mode image. We computed the phase difference between adjacent A-lines, which is proportional to the modulation of the difference in optical path induced by the acoustic stimulation. The phase information was extracted from real and imaginary values. The Doppler phase shift fd induced by a moving sample is expressed as
(1)
fd=fa2πtan-11M(N-1)m=1Mn=1N-1(Qm,nIm, m+1-Im,nQm, n+1)1M(N-1)m=1Mn=1N-1(Qm,nQm, m+1+Im,nIm, n+1)
where fa is the camera line period between successive A-lines and tan–1{(Qm,nIm,n+1–Im,nQm,n+1)/Qm,nQm,n+1+Im,nIm,n+1)} is the phase difference between successive A-lines [18]. M and N are the horizontal and vertical sizes of the averaging mask, respectively. In addition, I (in-phase) and Q (quadrature phase) are the result elements of the fast Fourier transform operation. The Doppler phase shift is continuously observed while the TM vibrates. The velocity v of the vibrating TM is expressed as
(2)
ν=λ0fd2ntcosθ
Where λ0 is the center wavelength, nt is the refractive index, and θ is the angle between the TM and the direction of the sample arm beam.
The Doppler signal was measured using the Kasai autocorrelation algorithm [19,20]. This method is efficient at calculating the phase change when there is noise and its fast processing makes real-time processing possible. The phase difference was marked in quadrants from –π to π by calculating the arctangent, and the extent of the phase difference was expressed as a color variation. Restoration of the phase signal was possible by segregating the red (R)/green (G)/blue (B) information in the region of interest of the image. Thus, the vibration velocity was calculated using the phase difference. Red, green, and blue are represented by 8 bit color, respectively. In the first quadrant, the color between B and Black is mapped. In the second quadrant, R changes from fixed B to map between B and magenta (M), color between R and M on the third quadrant, and color between R and black on the fourth quadrant. When the direction of Doppler effects is inversed, the color also becomes inverse color. In the post-processing, 3D-demodulation for pattern analysis was performed. Horizontal and vertical resolution information was obtained from the region of interest of the phase shift image, and R/G/B information was separated from each pixel. And the phase shift was calculated by the inverse color mapping.

Preliminary latex drum test and animal experiment

To test the sensitivity of the DOCT system, a latex drum was constructed by stretching a 100-μm-thick latex membrane over and attaching it to a 50-mm-diameter glass tube. Sound stimuli comprising sinusoidal signals of 1, 2, and 4 kHz from a functional generator were broadcast through the loudspeaker, causing the latex drum to vibrate. To minimize the effect of reflected sound, all procedures were performed in a 250×200×120-mm sound-proof chamber. A calibrated probe microphone was placed near the latex drum to record the sound pressure level at the surface of the latex drum. The OCT beam scanned the entire drum and detected the Doppler frequency shift caused by vibration.
Sprague Dawley rats (5 weeks old, 60 g) were anesthetized by intramuscular injection of a mixture of tiletamine-zolazepam (1.8 mg/100 g) and xylazine hydrochlorate (0.7 mg/100 g). After local injection of 2% lidocaine HCl and epinephrine (1:100,000), a postauricular skin incision was made, the auricle and cartilaginous external auditory canal were removed, and the bony external auditory canal was widened by drilling to expose the entire TM.
During in vivo experimental measurements of the TM and ossicles under normal conditions, the phase or displacement of the umbo and contact area between the TM and the ossicles was acquired using DOCT and 1-, 2-, and 4-kHz pure tone stimuli at 15 W in the sound-proof chamber. To simulate middle ear effusion (MEE), a pick was used to make a pinhole in the bulla, viscous liquid was injected through the pinhole, and the hole was sealed with bone wax. The same experiment was performed to evaluate the in vivo vibration of the TM and ossicles in the simulated effusion condition.
Our study was permitted by Institutional Animal Care and Use Committee of Kyungpook National University Hospital (No. 2014-12). All tests were performed within the guidelines of the Animal Care Ethics Committee of Kyungpook National University and the National Institutes of Health guidelines.

RESULTS

Preliminary result

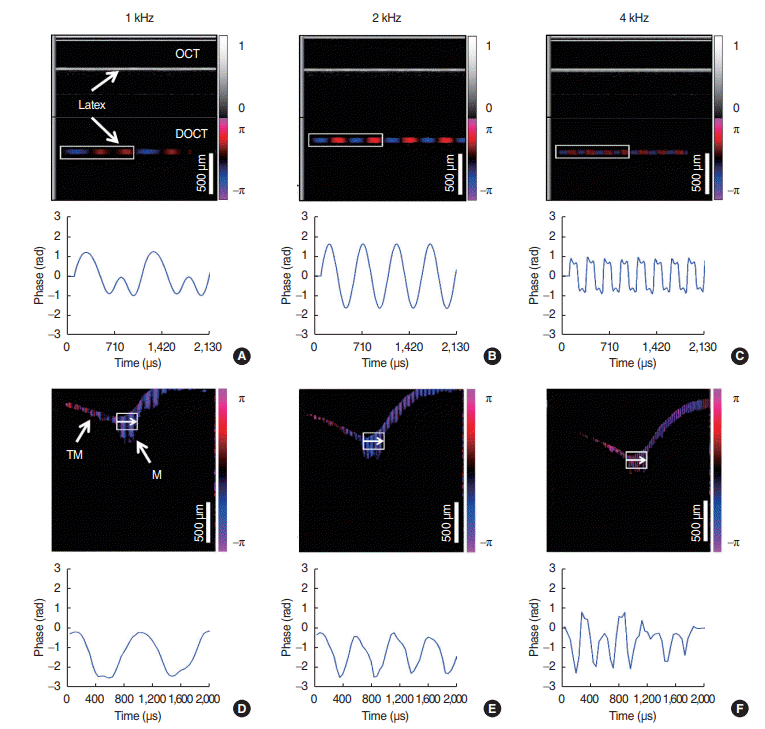
Fig. 2A-C shows the 2D images and the 2D phase signals from the latex drum of pure tone 1, 2, and 4 kHz stimuli at 15 W. The phase signal was acquired from analysis of the R/G/B information from the lateral line using the phase shift for demodulation processing and 2D phase mapping. Because the time gap between the A-lines was 14.2 μs, the oscillation cycles of the latex drum were 1.006, 2.012, and 3.912 kHz for the 1-, 2-, and 4-kHz stimuli, respectively. Thus, the oscillation cycle of the drum was shortened in proportion to the frequency of the stimulus. On the basis of these data, this DOCT could be able to analyze TM vibration shapes.

In vivo rat experiment

Fig. 2D-F shows the vibration pattern of the TM stimulated by the same frequencies used for the latex drum (1, 2, and 4 kHz) obtained by the DOCT. The umbo is most sensitive to vibration of the TM caused by sound stimuli [21,22], so the vibration pattern of the umbo accurately reflects the status of the middle ear. The oscillation cycles of the umbo were 0.893, 1.929, and 4.176 kHz for the 1-, 2-, and 4-kHz stimuli, respectively. The vibration shapes had an integer ratio similar to that of the latex drum.
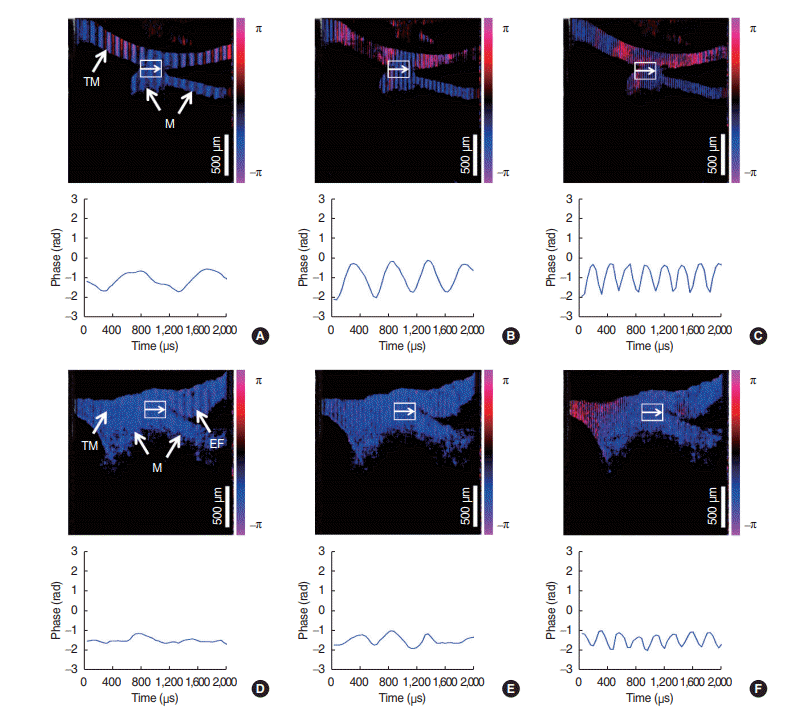
Fig. 3A-C shows the shape of vibration in the contact area between the TM and the malleus. The oscillation cycles of the contact area were 0.999, 1.472, and 4.176 kHz for the 1-, 2-, and 4-kHz stimuli, respectively, which showed similar pattern to those of the umbo. The results presented in Figs. 2 and 3 show that the 2D demodulation of the phase signal provided a change in phase with time.
The oscillation pattern of the contact area in the simulated effusion condition is shown in Fig. 3D-F. Compared with Fig. 3A-C, the TM and ossicles appear thick and the contact area between the malleus and the TM is not clear because of effusion. The Doppler signal tended toward attenuation at 4 kHz frequency but was prominent at 1 and 2 kHz.
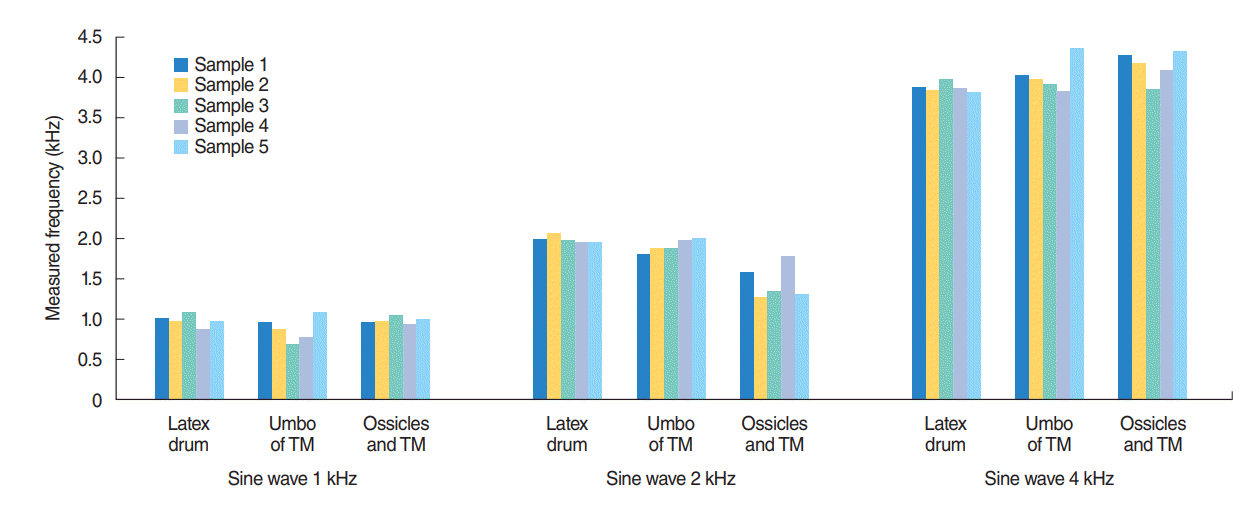
The errors from the mean of the results for the five samples were as follows: 0.006% (latex drum), –0.107% (umbo), and –0.001% (contact area) at 1 kHz, 0.006% (latex drum), –0.036% (umbo), and –0.264% (contact area) at 2 kHz, 0.022% (latex drum), 0.044% (umbo), and 0.044% (contact area) at 4 kHz, each.

Three-dimensional DOCT image analysis

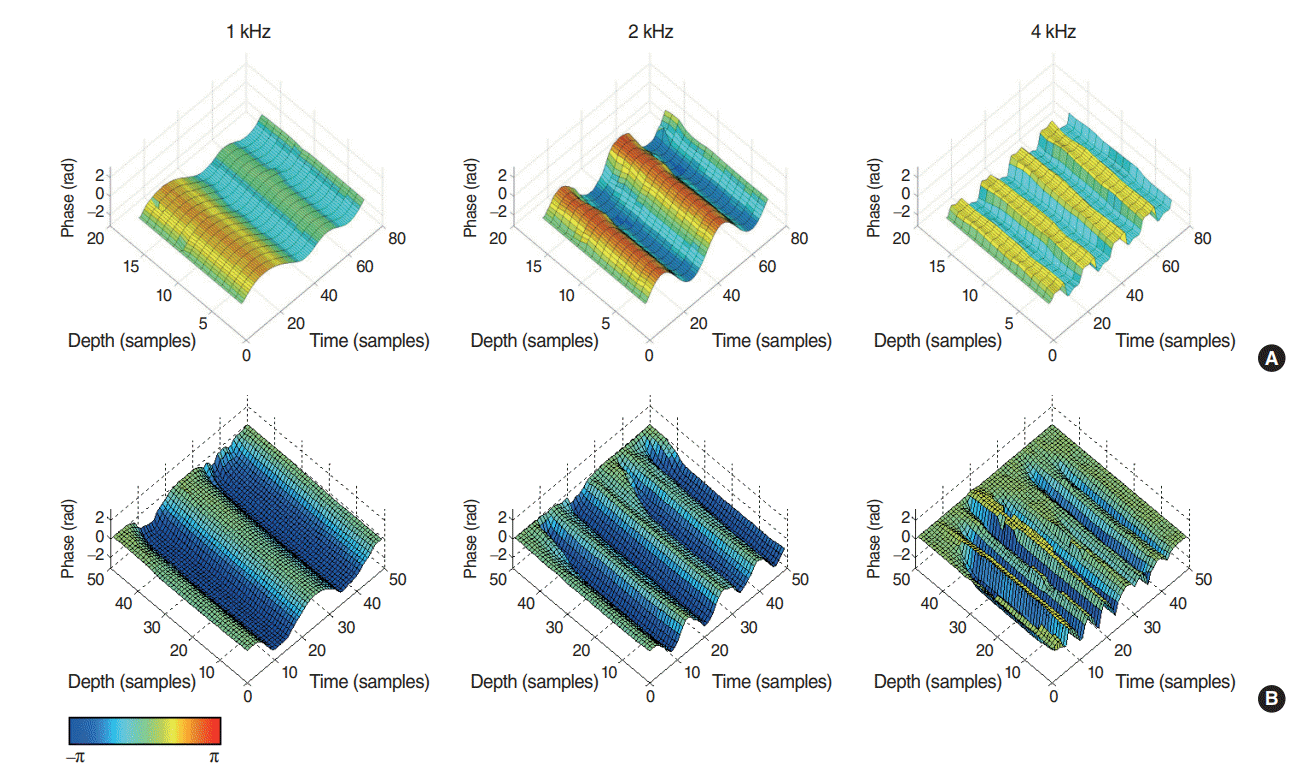
To gain a rigorous evaluation of the proposed method, we obtained 3D DOCT images of the area in the white boxes with arrows in Figs. 2 and 3. Fig. 4 shows the 3D reconstruction images for the latex drum and the in vivo normal TM of a rat. The 3D images revealed the changes of the oscillation pattern according to the frequencies of signals.
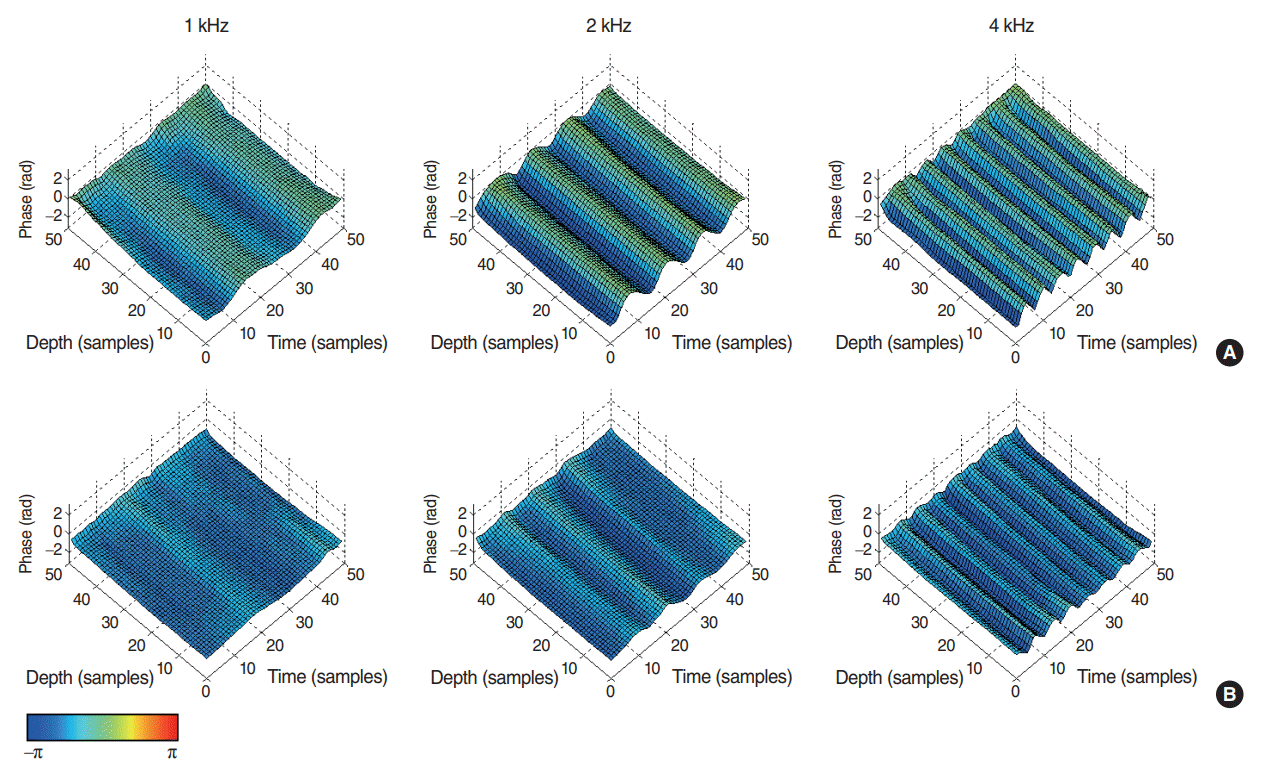
Our system performance was verified through the acquired 3D reconstruction phase shift images of the contact area between TM and malleus in normal TM and simulated effusion condition in vivo (Fig. 5). Compared with normal TM in vivo (Fig. 5A), the 3D Doppler signal tended toward attenuation at all frequencies but was prominent at 1 and 2 kHz in TM with simulated effusion condition (Fig. 5B).
The oscillating frequencies were compared among latex drum, umbo, and contact area in normal TM at 1, 2, and 4 kHz pure tone stimuli, each (Fig. 6). The results show the restoration pattern according to the stimulated frequency, which means that oscillating frequency follows the stimulated frequency.
These results suggest that the oscillation pattern provided more detailed information on the Doppler shift that the 3D phase pattern. The 3D phase pattern provides a more comprehensive view of the condition of the TM for identifying pathological features and making a diagnosis.

DISCUSSION

Inflammatory diseases of the middle ear are frequently accompanied by a pathological condition that causes morphological and functional changes to the structure of the middle ear, including the TM. In general, conventional diagnostic tools such as tympanometry, audiometry, otoscope examination, and LDV are used to evaluate the status of the TM. However, the TM and the tympanic cavity behind it cannot be visualized in depth and the oscillation of the TM cannot be spatially measured with these tools. In this study, we showed that DOCT could resolve the structure and motion of the TM and parts of the ossicular chain simultaneously under normal and MEE-simulated conditions. The results of this study support the possibility of using DOCT as an optimal diagnostic tool by simultaneously measuring TM and ossicular motion, as previously reported [2,23,24].
Recently, studies on the oscillation patterns of TM and ossicular motion have been performed using LDV [6-8,25-27] and stroboscopic holography [28,29]. Few studies have involved DOCT. Chang et al. [2] reconstructed the vibration of an ex vivo normal TM and ossicular chain under a pathological condition in three dimensions using a chinchilla model. Subhash et al. [11] suggested the efficiency of depth-resolved vibration imaging by measuring the motion of a normal TM, ossicular chain, and ossicular fixation using an ex vivo cadaveric temporal bone. Burkhardt et al. [12] analyzed the spatially resolved frequency response functions of the entire TM stimulated by sound of frequencies from 0.4 to 6.4 kHz. Different specific oscillation patterns and the presence of standing and traveling wavelike motions with respect to frequency were observed. In this study, the oscillation cycle was shortened in proportion to the frequency of the stimulus in the latex drum. This means that the frequency of the stimuli matches that of the latex drum vibration and the wavelength is inverse proportion to the time. Oscillation cycle also depends on material properties. While the latex drum has flat shape and constant thickness, TM has conical shape and bony connection, so the oscillation pattern could be heterogeneous within TM in vivo.
We analyzed the vibrational characteristics of the TM and malleus with respect to frequency and identified a reduced vibration pattern in the middle ear in a simulated effusion condition compared with the pattern of the middle ear under normal condition. Effusion and middle ear static pressure reduce the oscillation of the TM by decreasing middle ear compliance. The functional information about the TM acquired by DOCT can improve diagnostic accuracy. Vibration of the TM is affected by mass at high frequencies and by stiffness of the TM and the ossicular chain at low frequencies [22]. MEE increases the effect of mass and decreases the mobility of the TM at high frequencies. While most LDV studies on the mobility of the TM measured vibration in response to stimuli of frequencies ranging from 0.2 to 40 kHz [30-32], we used stimuli of frequencies between 1 and 4 kHz. Our results showed a similar pattern to those measured by LDV within this frequency range.
Vibration characteristics were analyzed using a signal demodulation method, in contrast with previous studies, and phase differences of the TM and malleus were visualized via 3D mapping. In addition, we performed in vivo animal experiments to reflect physiological conditions. The physiology of the middle ear was preserved when the effusion was induced by injecting a viscous liquid through a pinhole made in the bulla and then sealing it with bone wax.
There are some problems with the application of DOCT to the human TM that need to be resolved. The thickness of the human TM and the complicated structure of the tympanic cavity reduce the sensitivity of DOCT in measuring ossicular motion. In addition, the time for acquiring DOCT images and the underestimation of vibration not perpendicular to the optical beam are issues that need attention.
Recently, Chang et al. [2] reported the simultaneous 3D imaging of sound-induced motions of the TM and ossicles in a chinchilla model. In the present study, the oscillation pattern of the entire TM was preliminarily analyzed and reconstructed with 3D images using demodulation processing of DOCT. The amplitude decreased and the speed of the oscillation cycle increased as the frequency increased. In addition, the difference in oscillation between the free area and the junction of the TM with the malleus handle became apparent as the frequency increased. If substantial data on a normal TM are collected and the acquisition times are improved, this 3D TM reconstruction method could provide diagnostic clues about the displacement range so that a diseased ear can be clinically distinguished from a normal ear.
For the diagnosis of human TM, it is significant to develop the diagnostic sample arm to be of probe type which will also allow a free path for sound waves to travel in the ear that does not obstructing the optical path, without surgery is also essential. OCT has been advanced enough to be applicable for clinical use. We have performed a study to diagnose the vibration of the eardrum using DOCT to observe the surface of the eardrum with an otoscope and which is unlike the conventional method of relying on the information given by the patient in response to the sound they hear using headphones.
This preliminary study used a signal demodulation method to demonstrate TM vibration under sound stimulation at frequencies of 1, 2, and 4 kHz in a normal ear and an ear under simulated pathological condition in vivo and implemented 3D reconstruction of the TM vibration under sound stimulation. The difference between the oscillation pattern at low frequency and high frequency was identified, but further study is needed to validate our method and its results.
This study was performed to test the possibility of DOCT signal extraction. Especially, we focused on the 2D/3D OCT imaging and signal restoration in accordance to the difference of normal and abnormal cases. We will conduct detailed studies on abnormal models and further animal and human experiments [33,34].

HIGHLIGHTS

▪ Doppler optical coherence tomography is useful for the measurement of the tympanic membrane oscillation in vivo using signal demodulation method.
▪ The oscillation cycles in normal tympanic membrane for frequencies of the stimuli drum become short in proportional to the frequency of stimuli less than 4 kHz.
▪ Doppler signal showed a tendency of attenuation in all frequencies, which was prominent at 1 kHz and 2 kHz in fluid in middle ear condition.

Notes

No potential conflict of interest relevant to this article was reported.

ACKNOWLEDGMENTS

This research was supported by the Bio & Medical Technology Development Program of the National Research Foundation of Korea (NRF) funded by the Korean Government, MSIP (2017 M3A9E2065282), and “Development of Micro-surgical Apparatus Based on 3D Tomographic Operating Microscope” funded by the Ministry of Trade, Industry and Energy (MI, Korea; grant no. 10047943). Also, this study was supported by BK21 Plus project funded by the Ministry of Education, Republic of Korea (21A20131600011).

REFERENCES

1. Nuttall AL, Dolan DF, Avinash G. Laser Doppler velocimetry of basilar membrane vibration. Hear Res. 1991; Feb. 51(2):203–13.
crossref
2. Chang EW, Cheng JT, Roosli C, Kobler JB, Rosowski JJ, Yun SH. Simultaneous 3D imaging of sound-induced motions of the tympanic membrane and middle ear ossicles. Hear Res. 2013; Oct. 304:49–56.
crossref
3. Lee HY, Raphael PD, Park J, Ellerbee AK, Applegate BE, Oghalai JS. Noninvasive in vivo imaging reveals differences between tectorial membrane and basilar membrane traveling waves in the mouse cochlea. Proc Natl Acad Sci U S A. 2015; Mar. 112(10):3128–33.
crossref
4. MacDougall D, Farrell J, Brown J, Bance M, Adamson R. Long-range, wide-field swept-source optical coherence tomography with GPU accelerated digital lock-in Doppler vibrography for real-time, in vivo middle ear diagnostics. Biomed Opt Express. 2016; Oct. 7(11):4621–35.
crossref
5. Hong SS, Freeman DM. Doppler optical coherence microscopy for studies of cochlear mechanics. J Biomed Opt. 2006; Sep-Oct. 11(5):054014.
crossref
6. Seidman MD, Standring RT, Ahsan S, Marzo S, Shohet J, Lumley C, et al. Normative data of incus and stapes displacement during middle ear surgery using laser Doppler vibrometry. Otol Neurotol. 2013; Dec. 34(9):1719–24.
crossref
7. Aarnisalo AA, Cheng JT, Ravicz ME, Hulli N, Harrington EJ, Hernandez-Montes MS, et al. Middle ear mechanics of cartilage tympanoplasty evaluated by laser holography and vibrometry. Otol Neurotol. 2009; Dec. 30(8):1209–14.
crossref
8. Ball GR, Huber A, Goode RL. Scanning laser Doppler vibrometry of the middle ear ossicles. Ear Nose Throat J. 1997; Apr. 76(4):213–8.
crossref
9. Dong W, Varavva P, Olson ES. Sound transmission along the ossicular chain in common wild-type laboratory mice. Hear Res. 2013; Jul. 301:27–34.
crossref
10. Kunimoto Y, Hasegawa K, Arii S, Kataoka H, Yazama H, Kuya J, et al. Sequential multipoint motion of the tympanic membrane measured by laser Doppler vibrometry: preliminary results for normal tympanic membrane. Otol Neurotol. 2014; Apr. 35(4):719–24.
11. Subhash HM, Nguyen-Huynh A, Wang RK, Jacques SL, Choudhury N, Nuttall AL. Feasibility of spectral-domain phase-sensitive optical coherence tomography for middle ear vibrometry. J Biomed Opt. 2012; Jun. 17(6):060505.
crossref
12. Burkhardt A, Kirsten L, Bornitz M, Zahnert T, Koch E. Investigation of the human tympanic membrane oscillation ex vivo by Doppler optical coherence tomography. J Biophotonics. 2014; Jun. 7(6):434–41.
13. Zhang K, Kang JU. Real-time 4D signal processing and visualization using graphics processing unit on a regular nonlinear-k Fourier-domain OCT system. Opt Express. 2010; May. 18(11):11772–84.
crossref
14. Jeong H, Cho NH, Jung U, Lee C, Kim JY, Kim J. Ultra-fast displaying Spectral Domain Optical Doppler Tomography system using a Graphics Processing Unit. Sensors (Basel). 2012; 12(6):6920–9.
crossref
15. American National Standards Institute. American national standard for safe use of lasers: standard Z1361-2007. Orlando (FL): Laser Institute of America;2007.
16. Cho NH, Jung U, Kim S, Jung W, Oh J, Kang HW, et al. High speed SD-OCT system using GPU accelerated mode for in vivo human eye imaging. J Opt Soc Korea. 2013; Feb. 17(1):68–72.
crossref
17. Cho NH, Park K, Wijesinghe RE, Shin YS, Jung W, Kim J. Development of real-time dual-display handheld and bench-top hybrid-mode SD-OCTs. Sensors (Basel). 2014; Jan. 14(2):2171–81.
18. Yang V, Gordon M, Qi B, Pekar J, Lo S, Seng-Yue E, et al. High speed, wide velocity dynamic range Doppler optical coherence tomography (Part I): system design, signal processing, and performance. Opt Express. 2003; Apr. 11(7):794–809.
crossref
19. Makita S, Fabritius T, Yasuno Y. Quantitative retinal-blood flow measurement with three-dimensional vessel geometry determination using ultrahigh-resolution Doppler optical coherence angiography. Opt Lett. 2008; Apr. 33(8):836–8.
crossref
20. Ahn YC, Jung W, Chen Z. Quantification of a three-dimensional velocity vector using spectral-domain Doppler optical coherence tomography. Opt Lett. 2007; Jun. 32(11):1587–9.
crossref
21. Ravicz ME, Rosowski JJ, Merchant SN. Mechanisms of hearing loss resulting from middle-ear fluid. Hear Res. 2004; Sep. 195(1-2):103–30.
crossref
22. Gan RZ, Dai C, Wood MW. Laser interferometry measurements of middle ear fluid and pressure effects on sound transmission. J Acoust Soc Am. 2006; Dec. 120(6):3799–810.
crossref
23. Nakajima HH, Pisano DV, Roosli C, Hamade MA, Merchant GR, Mahfoud L, et al. Comparison of ear-canal reflectance and umbo velocity in patients with conductive hearing loss: a preliminary study. Ear Hear. 2012; Jan-Feb. 33(1):35–43.
crossref
24. Rosowski JJ, Nakajima HH, Merchant SN. Clinical utility of laser-Doppler vibrometer measurements in live normal and pathologic human ears. Ear Hear. 2008; Jan. 29(1):3–19.
crossref
25. Arechvo I, Lasurashvili N, Bornitz M, Kevanishvili Z, Zahnert T. Laser Doppler vibrometry of the middle ear in humans: derivation dependence, variability, and bilateral differences. Medicina (Kaunas). 2009; 45(11):878–86.
crossref
26. Goode RL. Middle ear transmission disorders by laser-Doppler vibrometry. Acta Otolaryngol. 1994; Nov. 114(6):679–81.
27. Stasche N, Foth HJ, Hormann K, Baker A, Huthoff C. Middle ear transmission disorders: tympanic membrane vibration analysis by laser-Doppler-vibrometry. Acta Otolaryngol. 1994; Jan. 114(1):59–63.
28. Niehorster DC, Cheng JC, Li L. Optimal combination of form and motion cues in human heading perception. J Vis. 2010; Sep. 10(11):20.
29. Cheng JT, Hamade M, Merchant SN, Rosowski JJ, Harrington E, Furlong C. Wave motion on the surface of the human tympanic membrane: holographic measurement and modeling analysis. J Acoust Soc Am. 2013; Feb. 133(2):918–37.
crossref
30. Guan X, Li W, Gan RZ. Comparison of eardrum mobility in acute otitis media and otitis media with effusion models. Otol Neurotol. 2013; Sep. 34(7):1316–20.
crossref
31. Zhang X, Guan X, Nakmali D, Palan V, Pineda M, Gan RZ. Experimental and modeling study of human tympanic membrane motion in the presence of middle ear liquid. J Assoc Res Otolaryngol. 2014; Dec. 15(6):867–81.
crossref
32. Dai C, Gan RZ. Change of middle ear transfer function in otitis media with effusion model of guinea pigs. Hear Res. 2008; Sep. 243(1-2):78–86.
crossref
33. Carr JA, Valdez TA, Bruns OT, Bawendi MG. Using the shortwave infrared to image middle ear pathologies. Proc Natl Acad Sci U S A. 2016; Sep. 113(36):9989–94.
crossref
34. Monroy GL, Pande P, Shelton RL, Nolan RM, Spillman DR Jr, Porter RG, et al. Non-invasive optical assessment of viscosity of middle ear effusions in otitis media. J Biophotonics. 2017; Mar. 10(3):394–403.
crossref

Fig. 1.
Schematic diagram of the Doppler optical coherence tomography system. BS, broadband source; C, collimator; DG, diffraction grating; FL, focusing lens; LSC, line scan camera; FC, fiber coupler; M, mirror; GS, galvanometer scanner; S, speaker; SAC, sound-absorbing chamber.
ceo-2018-00185f1.tif
Fig. 2.
Correspond DOCT two-dimensional images and extracted phase signals of stimulated 1-kHz, 2-kHz, and 4-kHz pure tone stimuli in latex drum (A-C) and umbo of tympanic membrane (TM) (D-F). Solid rectangular box: extracted phase; white box with arrow: region of interest for signal demodulation. OCT, optical coherence tomography; DOCT, Doppler optical coherence tomography; TM, tympanic membrane; M, malleus.
ceo-2018-00185f2.tif
Fig. 3.
Two-dimensional images and phase signals of pure tone 1-kHz, 2-kHz, and 4-kHz sine wave stimuli at 15 W: contact area between tympanic membrane and ossicles in normal tympanic membrane (TM) (A-C) and simulated effusion condition (D-F). Solid rectangular box: extracted phase; white box with arrow: region of interest for signal demodulation. TM, tympanic membrane; M, malleus; EF, effusion.
ceo-2018-00185f3.tif
Fig. 4.
Three-dimensional reconstruction images of the detected phase shift (area in the white boxes in Fig. 2) on (A) the latex drum and (B) the umbo stimulated by1-kHz, 2-kHz, and 4-kHz pure tone stimuli.
ceo-2018-00185f4.tif
Fig. 5.
Three-dimensional reconstruction images of the detected phase shift (area in the white boxes in Fig. 3) on the contact area between tympanic membrane (TM) and malleus in (A) normal TM and (B) simulated effusion condition stimulated by 1-kHz, 2-kHz, and 4-kHz pure tone stimuli.
ceo-2018-00185f5.tif
Fig. 6.
Comparison in latex mini drum, umbo and ossicles by 1, 2, and 4 kHz frequency for each rats. TM, tympanic membrane.
ceo-2018-00185f6.tif
TOOLS
Similar articles