INTRODUCTION
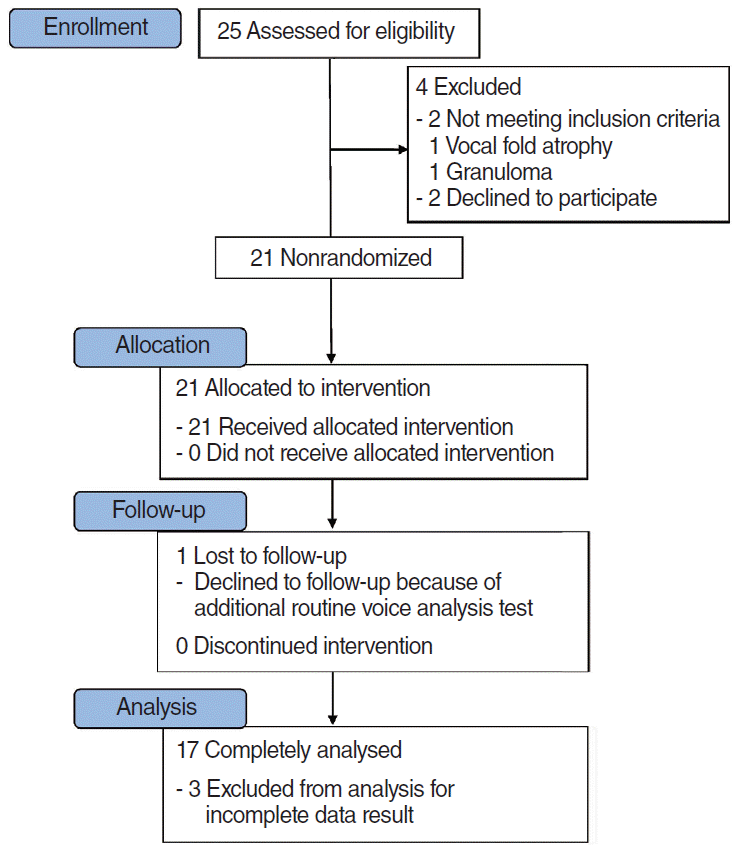 | Fig. 1.Consort flow diagram. A common reason for declining trial participation at enrollment and follow-up was that long travel distances made patients unwilling to return to the hospital for the 1-year follow-up visit. Chronic vocal fold scar is a clinical diagnosis, and 2 patients were found at stroboscopy to have vocal fold disease where fibroblast growth factor injection is not indicated. Three patients were excluded for incomplete voice evaluation data result. |
MATERIALS AND METHODS
Ethics statement
Animal model of chronic vocal fold scar and FGF injection
Real-time PCR of ECM gene expression in the vocal fold
Table 1.
Histology of the FGF-injected vocal fold
Prospective human clinical trial of FGF injection in patients with chronic vocal fold scarring
Patients
FGF injection
Objective and subjective voice analysis
Statistical analyses
RESULTS
Real-time PCR of ECM gene expression in the vocal fold
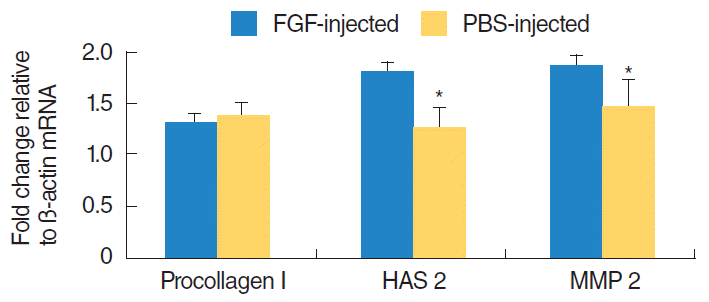 | Fig. 3.Normalized mRNA expression ratios of procollagen type I, hyaluronic acid synthase 2 (HAS 2), and matrix metalloproteinase 2 (MMP 2). The results are expressed as the fold change in target gene mRNA expression relative to mRNA expression of the housekeeping gene, β-actin. Each sample was tested in duplicate. HAS 2 and MMP 2 expression increased significantly in the FGF-injected group vs. PBS-injected group. The error bars represent the 95% confidence intervals of the mean. FGF, fibroblast growth factor; PBS, phosphate-buffered saline. *P<0.05 in a Mann-Whitney U-test. |
Histology of the FGF-injected vocal fold in a rabbit model
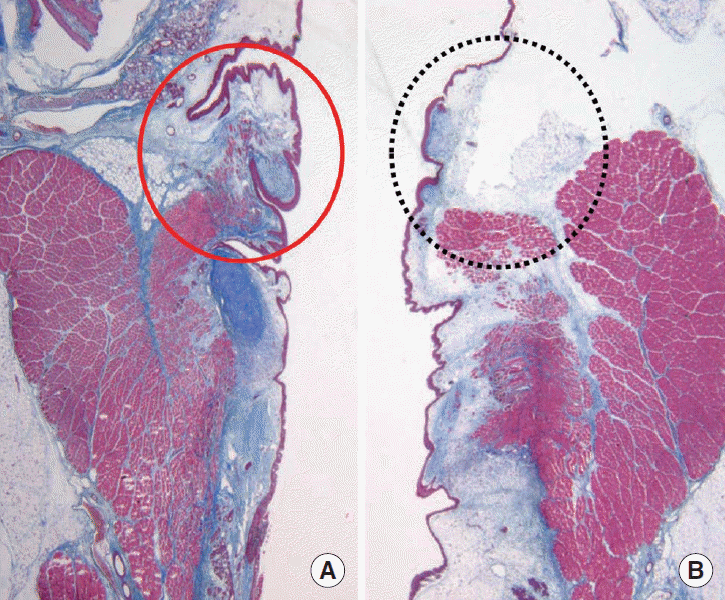 | Fig. 4.Masson’s trichrome staining of the vocal folds injected with (A) phosphate-buffered saline (PBS; 0.1 mL) and (B) fibroblast growth factor (FGF; 10 μg / 0.1 mL). Injection was performed 3 months after the scar-inducing injury. Coronal sections (6-μm thick) were prepared from the laryngeal tissues of 12 rabbits euthanized 6 months after scar formation. The FGF-injected fold (black dotted circle) shows greater vocal fold volume without an increase in the density of blue stained collagen (×20) than PBS-injected fold (red circle). |
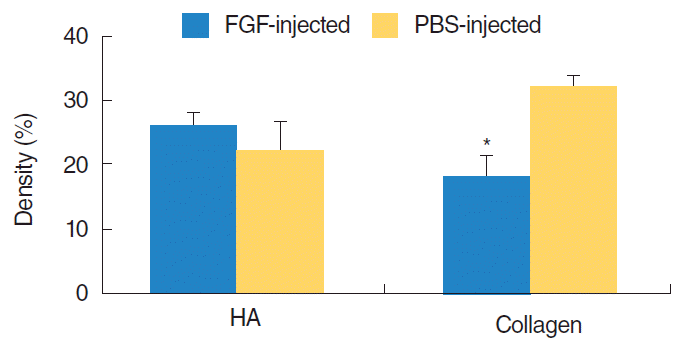 | Fig. 5.Histological image analysis of hyaluronic acid (HA) and relative collagen density in the FGF-injected group vs. the PBS-injected group. The relative density of collagen was significantly lower whereas that of HA was not significantly higher in the FGF-injected group vs. PBS-injected groups. FGF, fibroblast growth factor; PBS, phosphate-buffered saline. *P<0.05 in a Mann-Whitney U-test. |
Voice analysis data after FGF injection in patients with chronic vocal fold scarring
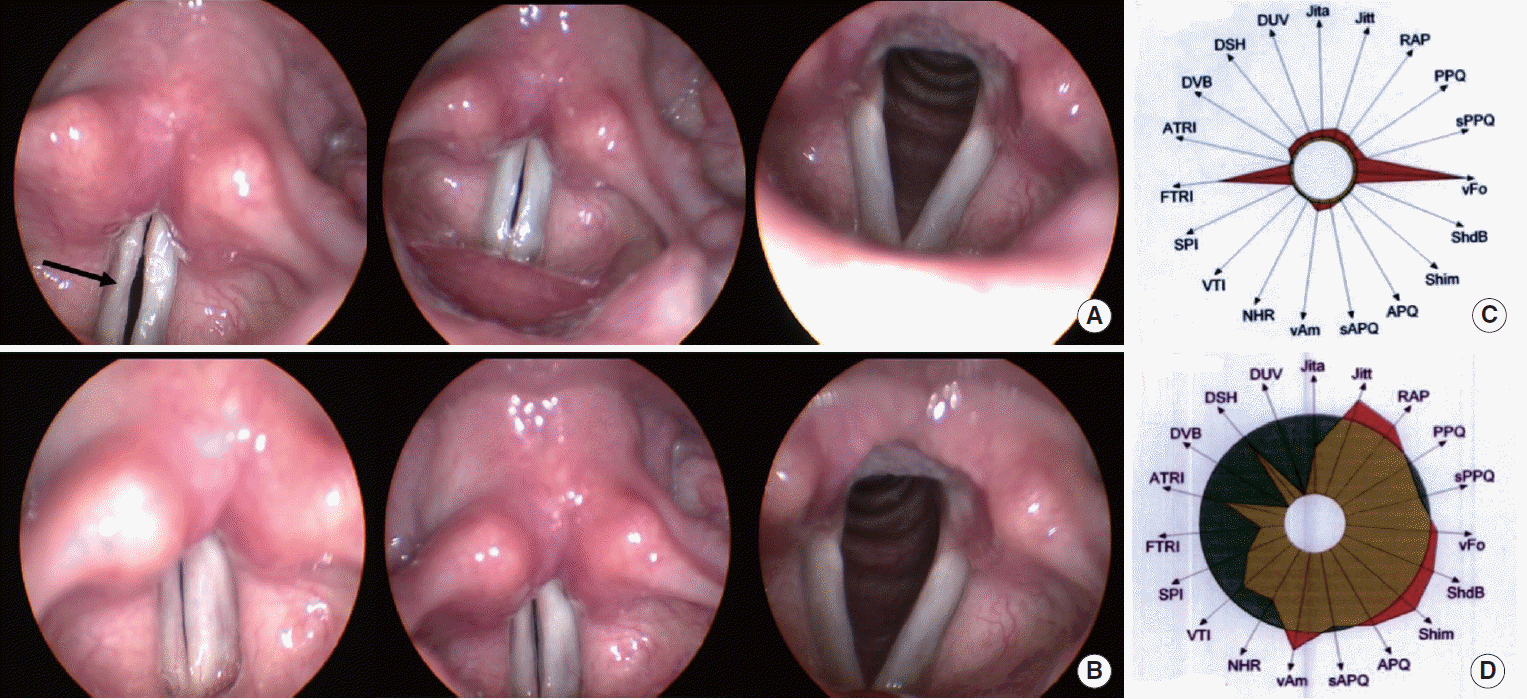 | Fig. 6.Representative stroboscopic findings and Multi-Dimensional Voice Program (MDVP) diagrams of a patient who received fibroblast growth factor (FGF) injection. (A) Preoperative findings, demonstrating a chronic vocal focal scar with minimal glottis gap on the right vocal fold that impairs mucosal vibration (Glottal closure grade 2, Mucosal wave grade 1). The arrow highlights the scar. (B) 12 Months after injection. Vocal scar disappeared resulting in complete glottal closure and improved glottal vibratory function (Glottal closure grade 3, Mucosal wave grade 3). Glottal closure and the mucosal wave were graded on a four-point scale. 0=severe glottis gap, no wave; 1=moderate glottis gap, obvious decreased mucosal wave; 2=mild glottis gap, slightly decreased mucosal wave; and 3=complete closure, full wave. Before (C) and after (D) FGF injection, the MDVP diagram showed improved objective voice parameters including Jitt, Shim, and NHR. Jita, absolute jitter (μs); Jitt, jitter percent (%); RAP, relative average perturbation (%); PPQ, pitch perturbation quotient (%); sPPQ, smoothed pitch perturbation quotient (%); vF0, fundamental frequency variation (%); ShdB, shimmer in dB (dB); Shim, shimmer percent (%); APQ, amplitude perturbation quotient (%); sAPQ, smoothed amplitude perturbation quotient (%); vAm, peak-amplitude variation (%); NHR, noise to harmonic ratio; VTI, Voice Turbulence Index; SPI, Soft Phonation Index; FTRI, F0-Tremor Intensity Index (%); ATRI, Amplitude Tremor Intensity Index (%); DVB, degree of voice breaks (%); DSH, degree of sub-harmonics (%); DUV, degree of voiceless (%). |
Table 2.
Table 3.
| Characteristic | Baseline (SD) |
Duration after FGF injection (SD) |
||
|---|---|---|---|---|
| 3 Mo | 6 Mo | 12 Mo | ||
| Jitter (%) | 3.19±2.30 | 1.97±2.06a) | 2.39±3.04 | 1.85±2.22 |
| Shimmer (%) | 8.27±4.45 | 3.87±3.62a) | 6.36±3.71 | 7.14±7.57 |
| NHR (%) | 0.22±0.10 | 0.26±0.19 | 0.19±0.14 | 0.22±0.17 |
| MPT (sec) | 8.18 (2.67) | 9.67 (2.64)a) | 10.30 (1.00)b) | 10.80 (0.50)c) |
| VR (Hz) | 197.93 (60.21) | 325.05 (81.35)a) | 278.90 (38.55)b) | 297.05 (66.06)c) |
| GRABAS | 6.35 (2.45) | 1.76 (1.15)a) | 1.71 (1.25)b) | 1.33 (1.03)c) |
| VHI-10 | 21.94 (8.47) | 12.29 (8.15)a) | 12.71 (9.34)b) | 3.17 (2.64)c) |
| Glottic closure | 1.12 (0.60) | 2.87 (0.35)a) | 2.71 (0.49)b) | 2.80 (0.45)c) |
| Mucosal wave | 1.12 (0.60) | 2.40 (0.63)a) | 2.29 (0.95)b) | 2.40 (0.55)c) |
Baseline, baseline voice data; SD, standard deviation; NHR, noise-to-harmonics ratio; MPT, maximum phonation time; VR, voice range profile; GRABAS, sum of grade, roughness, breathiness, asthenia, strain scale; VHI, Korean version of Voice Handicap Index-10; glottic closure, grades of glottis closure; mucosal wave, grades of glottic mucosal wave.


 PDF
PDF Citation
 Print
Print


 XML Download