Abstract
Objectives
Voice and speech alterations after total thyroidectomy may be associated with other extralaryngeal factors, such as neck muscle dysfunction and neck scar contracture. We evaluated the acoustic characteristics of oral vowel sounds and changes in hyoid bone movement before and after thyroidectomy.
Methods
Twenty-nine female patients undergoing total thyroidectomy were included. Fundamental frequencies (Fo), formants and vowel space areas were evaluated before surgery and 7 days and 3 months after surgery to acoustically analyze the oral vowel sounds. Videofluoroscopic images were taken at the same times to evaluate hyoid bone movement.
Results
The Fo levels of seven vowels decreased significantly after surgery. The vowel formant changes the F1 of vowel /[e]/ decreased significantly from baseline at 3 months postoperatively, and the F3 of vowel /[i]/ decreased significantly from baseline 7 days postoperatively. The change in the vowel space area was not observed. The Y coordinate of the vowels /[i]/ and /[e]/ decreased significantly from baseline 7 days postoperatively due to changes in hyoid movement.
Thyroid surgery is becoming more common with the increased incidence of thyroid diseases. Accordingly, voice problems and their management in patients who have undergone thyroidectomy are important. The cricothyroid and neck muscles can be damaged during thyroidectomy, resulting in changes in muscle contraction, relaxation, and tension levels, which will change vertical movements of the larynx [1,2]. The voice symptoms observed in patients who have undergone thyroidectomy include vocal cord fatigue and decreases in fundamental frequency, bandwidth, and intensity [3-5]. These voice changes are not only caused by laryngeal neural damages but also by non-neural damage. In a study on phonatory function after thyroidectomy without neural damage, subjects experienced more pain when they sang high-bandwidth rather than low-bandwidth songs. However, the frequency of their pain attacks decreased over time [6]. Thus, voice changes without neural damage can develop temporarily due to thyroidectomy or arytenoid cartilage damage [7,8].
The formant is the peak energy from a selective increase in a sound source due to vocal tract resonance. Formants with language spectrum information are numbered from the lowest frequency to the highest frequency, such as the first and second formants (F1 and F2). The three lowest formants are essential parameters to explain vowel characteristics [9,10]. F1 usually changes according to the superior-inferior position of the tongue. A tongue high up in the mouth produces a low F1 frequency. F2 changes according to the anteroposterior position of the tongue. A tongue in front produces a high F2 frequency [11]. This means that the F1 and F2 frequencies determine the features of vowels and the vowel space areas, which can also be determined by the shapes of individual vocal tracts. The vowel space area can be used as an exponent of vowel accuracy, and refers to the overall combined capability of the tongue and the chin [12]. Vowel triangle charts and vowel charts are often used to evaluate the vowel space area. A difference in the area can be expressed in greater detail using as many vowels as possible, due to the possibility of similar areas among vowels with separate articulation points. Therefore, studies on seven vowel angles are required [11-13].
Anterior and vertical movement of the hyoid bone and larynx contributes to protect the airway and transport a bolus to the esophagus. The exact effects of hyoid and laryngeal elevation on voice and speech remain unclear. Because pitch is mainly affected by major physiological factors, such as tension and vocal fold length, and subglottal pressure during normal phonation, it is actually very difficult to evaluate the pure effect of hyoid and laryngeal elevation on pitch control. The neck muscles on both sides assist in drawing the hyoid bone and larynx upward, particularly the thyroid cartilage, and the larynx and trachea tilt forward when the pitch is higher, indicating laryngeal upward pulling and forward bending. However the extent of hyoid bone elevation is assumed to be within physiological limits because there are a considerable number of muscles that can influence movements of the hyoid bone and larynx [14]. The cricoid and thyroid cartilages move upward together, but the thyroid cartilage moves more cranially than the cricoid cartilage because the cricoid cartilage is relatively fixed to adjacent connective tissue compared with the thyroid cartilage. This causes restricted upward movement of the cricoid cartilage. The hyoid bone and the thyroid cartilage move more antero-vertically than the cricoid cartilage. This results in increasing vocal fold length and tension and explains the dominant effect of laryngeal elevation compared with cricothyroid muscle activity for raising pitch [15].
In this study, we evaluated the effects of damage during thyroidectomy on voice changes. The fundamental frequency, formant, and hyoid bone position during pronunciation of seven vowels before and after thyroidectomy were compared. Our results may be useful as basic voice disturbance data for voice management in patients who have undergone thyroidectomy.
A prospective study was designed to evaluate changes in oral vowel sounds and hyoid bone movement before and after thyroidectomy. We selected 29 female patients (mean age, 52 years) who had undergone a total thyroidectomy for thyroid cancer. All patients had normal voice function before surgery. Exclusion criteria included >60-year-of-age, vocal fold paralysis, history of voice or speech disorder, previous neck surgery, and laryngeal disorders. All patients received a total thyroidectomy with central neck dissection and had papillary carcinoma pathologically. The strap muscles were dissected and retracted to the lateral side from the midline during thyroid surgery but were not cut. The recurrent laryngeal nerve was identified and protected on the affected side. Because the external branches of the superior laryngeal nerve were not exposed routinely, the superior thyroid artery and vein were ligated very carefully, close to the thyroid capsule to avoid nerve injury. When this nerve was not readily identifiable, no further dissection was pursued to avoid inadvertent nerve injury. Movement of the vocal folds was observed postoperatively by laryngoscopic examination. No patient showed a motion limitation of the vocal folds during phonation, and no laryngeal pathologies related to general anesthesia were observed. The oral vowel sounds and hyoid bone movement analyses were performed before surgery and 7 days and 3 months after surgery.
The oral vowels, /a/, /i/, /u/, /e/, /o/, /ߍ/, and /ա/, were recorded three times consecutively for approximately five seconds at a casual pitch and loudness, with their mouth 5 cm away from the microphone. The most stable portion of the pronounced vowel, excluding the first and last portions, was extracted for analyses using the voice analysis software Praat (v5.3.60, Netherland; http://www.praat.org). The normality test or the Kolmogorov-Smirnov test shows a P>0.05 for all vowels, assuming a normal distribution. Linear mixed modeling was used for vowels which satisfied the normal distribution assumption, to investigate the difference between the baseline frequency according to the time of the thyroidectomy, and the fundamental frequency when the stable vowel phase was determined. A post-hoc or the Bonferroni test was performed after the non-parametric test to investigate differences among the three groups according to test time. Fundamental frequency (Fo), F1, and F2 were analyzed using the voice in the middle phase of the seven vowels. Fo was analyzed at the 45 Hz narrow band, and the formant was analyzed at the 150 Hz wide band. Mixed linear models were used to investigate the formant changes according to the time of the thyroidectomy for the normally distributed data, and Friedman’s test was used for data not normally distributed.
A normality test was performed to investigate normality of the vowel space area data distribution according to test time. As result, P>0.05 was detected for the Kolmogorov-Smirnov test, indicating a normal distribution. Linear mixed modelling was performed to investigate the difference in the seven vowel space areas among the test times. Accordingly, the seven vowel formant space areas were calculated using the seven-vowel angle equation of the paragon connected to the points on the coordinate suggested by Beyer [16].
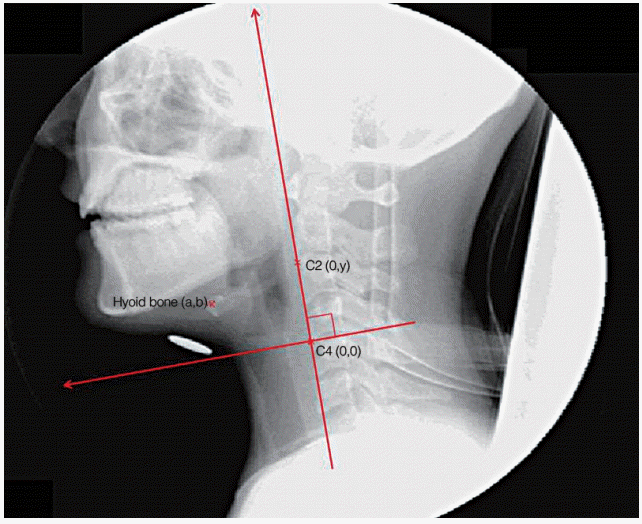
Images of the hyoid bone position during relevant vowel sounds were analyzed using Max TRAQ 2D Standard ver. 2.4.0.3 (Innovision Systems Inc., Columbiaville, MI, USA). The Y-axis was determined as the line between C4 and C2, and the X-axis was made from C4 as the point of origin at a right angle. The hyoid bone position during each vowel sound was calculated on the X and Y coordinates, with C4 as the origin. The hyoid bone reference point was the center of the hyoid bone (Fig. 1). A normality test was performed to confirm the normal distribution of the hyoid bone X and Y coordinate and vowel data. Mixed linear models were used to investigate the differences in these variables according to test time. Friedman’s test was performed to investigate the difference according to test time. The Bonferroni test was used as a post-hoc test.
The IBM SPSS ver. 20.0 (IBM Co., Armonk, NY, USA) was used for statistical processing. A normality test was conducted to confirm the normal distribution of the data. A mixed linear model was used to investigate differences in the fundamental frequencies; vowel formants 1 and 2; the vowel space area; and the X and Y coordinates of the hyoid bone according to the time of the thyroidectomy. Friedman’s test was used for data not distributed normally to investigate the difference according to the test time. The significance level was set at 0.0167 (=0.05/3) using a post-hoc or the Bonferroni test.
The value of /a/ decreased from 195.17 at baseline to 187.56 at 7 days postoperatively; that of /i/ decreased from 204.56 to 195.72 and 192.78 at 7 days and 3 months postoperatively, respectively; that of /u/ decreased from 207.333 to 191.83 and 190.78, respectively; that of /e/ decreased from 205.56 to 191.00 and 187.83, respectively; that of /o/ decreased from 208.17 to 193.44 and 192.33, respectively; that of /ߍ/ decreased from 206.67 to 188.33 and 187.94, respectively; and that of /ա/ decreased from 217.39 to 195.17 and 192.89, respectively. The baseline frequencies (f0) of all seven vowels differed significantly (P<0.05). In the post-hoc test, /a/ significantly differed from baseline to 7 days postoperatively. Significant differences were observed for all other vowels from baseline to 7 days and 3 months postoperatively. The vowels /e/ and /i/ showed the largest decreases in the fixed-effect estimates from f0 to 7 days and 3 months postoperatively, and the vowel /ߍ/ showed the lowest decrease. This result indicates that the f0 of all the seven vowels decreased; the f0 of vowel /a/ decreased significantly from baseline to 7 days postoperatively; and the f0 of vowels /i/, /u/, /e/, /o/, /ߍ/, and /ա/ decreased from baseline to 7 days and 3 months postoperatively (Table 1).
The post-hoc Bonferroni test was conducted to investigate the difference in the F1 of vowel /e/ according to the time of surgery. A significant difference was observed (P=0.006), as F1 decreased from 599.72 at baseline to 560.67 at 3 months postoperatively. The change in F1 was attributed to the change in the mouth opening limitation after surgery. No significant differences were observed for the other vowels (Table 2, Fig. 2).
The Y coordinates of the vowels /i/ and /e/ at 3 days postoperatively decreased significantly from baseline (P<0.05). The mean Y coordinate of the hyoid bone for vowel /i/ at baseline was 20.17 mm; that 7 days postoperatively was 17.53 mm; and that 3 months postoperatively was 18.86 (all P<0.05). The mean Y coordinate of the hyoid bone for vowel /e/ at baseline was 21.12 mm; that 7 days postoperatively was 18.08 mm; and that 3 months postoperatively was 19.41 mm, all of which were significant decreases 7 days postoperatively. The mean Y coordinates of /i/ and /e/ differed significantly (P<0.05), according to the time of the test. The X coordinate for /u/ was significant according to Friedman’s test, but no significant difference was observed according to the Bonferroni test (Table 4, Fig. 4).
Most of acoustic data after thyroidectomy are using sustained vowels. Phonation time and pitch pertubations are typically not significantly changed before thyroidectomy. These results suggested that the recurrent and superior laryngeal nerves were not damaged during surgery. Generally the phonation time and pitch pertubations are affected by the status of recurrent laryngeal nerve, and the fundamental frequency of sustained vowel is affected by the superior laryngeal nerve. On the running speech analysis, SFo has been implicated as one of the parameters of speech production signaling dysphonia or laryngeal pathology. The change of speaking frequency range may also explain the characteristic of monotonic voice of unilateral vocal fold paralysis or impairment of extralaryneal frame function. Hong et al. [17] suggested that it may be associated with the external frame dysfunction of the larynx, such as laryngotracheal fixation by scar-impairing vertical movement or by malfunction of the strap muscles after surgery temporarily, but not with vocal fold paralysis. These results emphasize the importance of the extralaryngeal mechanism for pitch control. In this study, changes in the Fo and formant of vowels after thyroidectomy were analyzed, and changes in hyoid bone movements that decisively affected formation of vowel sounds were investigated. The Fo differed significantly for all vowels, and a post-hoc test showed that /a/ differed significantly between baseline and 7 days postoperatively. In addition, significant differences were observed between baseline and 7 days postoperatively and between baseline and 3 months postoperatively for all other vowels.
The three lowest formant frequencies are extracted in a typical acoustic phonetical analysis and named F1 and F2. Determining their location and intensity is important. The high vowels /i/ and /u/ have a common low frequency F1, whereas the low vowels /a/ and /æ/ form a comparatively high-frequency band in F1. In other words, the F2 frequency band varies in the anteroposterior aspects of vowel articulation and shows a relationship between articulation and sound. The initial three formants, F1 and F2, are associated with the vowel articulation areas. The F1 frequency is inversely associated with tongue height, and the F2 frequency is associated with tongue advancement. This means that high vowels have a low F1 frequency, and more tongue advancement results in a greater F2. The F1 frequency is usually determined by tongue height, and the F2 frequency is determined by tongue advancement. Based on this association between articulation and sound, articulation can be interpreted using the vowel formant frequency acoustic data. Thus, the tongue moves higher with a decrease in the F1 frequency and the tongue moves forward with an increase in the F2 frequency. Nevertheless, this articulation-sound association is only speculation. In our study, the mean F1 of vowel /e/ decreased significantly from baseline to 3 months postoperatively (from 599.72 to 560.67). This change in F1 was attributed to the change in the mouth opening limitation.
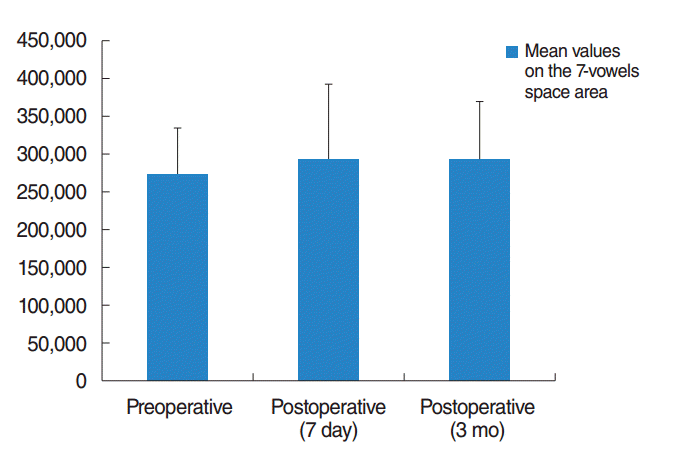
Three- or four-vowel spaces were typically calculated in previous studies. Beyer [16] suggested an equation for calculating the area of a polygon made of lines that connect coordinate points. This equation was used in this study to calculate the space areas of the seven vowel formants. The vowel formant pattern determines the vowel tone and reflects the articulation arrangements. F1 usually changes according to tongue height, and F2 changes according to tongue advancement [9]. The F1 and F2 frequencies determine the vowel features and the vowel space area according to the shape of the individual vocal tract. The vowel space area can be expressed as an exponent of vowel accuracy [12], and the difference can be expressed in greater detail when more vowels are used. In this study, the space area of the seven vowel formants was calculated using the area equation of the polygon of the lines that connect the points on the coordinate, as suggested by Beyer [16]. As a result, we found no differences in the seven-vowel space area from baseline to 7 days and 3 months postoperatively.
The mandible and hyoid bone are connected to the geniohyoid and genioglossus muscles. The superior cornu of the thyroid cartilage is connected through the hyoid bone. The inferior cornu of the thyroid cartilage is involved in articulation, in association with the cricoid cartilage [18,19]. The geniohyoid muscle contributes to correct vowel articulation through tongue movements. The mylohyoid muscle is involved in tongue lifting and the cricothyroid muscle is involved in reducing pitch [20]. In this study, the vowels /i/ and /e/ decreased significantly in the Y coordinate from baseline to 7 days postoperatively. This result was attributed to the effects of the surgical wound around the larynx on the vertical movement range of the hyoid bone, which closely coordinates with laryngeal components, including the thyroid and cricoid cartilages.
In conclusion, we compared changes in Fo, formant, vowel space area, and hyoid bone position after surgery using the following seven vowels. The Fo, formants and hyoid bone movements were changed significantly, but the vowel space area was not changed, after thyroidectomy. Even though this study has some limitations, our outcomes could be useful for clinical voice treatment. Further studies with a larger sample size may be needed to investigate differences among various age and sex groups. And it may be needed to enhance the reliability and applicability of the data for treating and managing patients who have undergone thyroidectomy.
▪ Changes in oral vowel sounds were prospectively examined in 29 female patients undergoing total thyroidectomy.
▪ The Fo level significantly decreased after thyroidectomy.
▪ Changes in the vowel space area was not observed.
▪ The changes appeared to result from early postoperative changes in hyoid movement.
ACKNOWLEDGMENTS
This paper was supported by Fund of Institute for Medical Science, Chonbuk National University-Chonbuk National University Hospital, Jeonju, Korea.
REFERENCES
1. Williams RG, Lesser TH, Foster M, Griffith G. Altered laryngeal function following thyroidectomy. Clin Otolaryngol Allied Sci. 1989; Aug. 14(4):281–3.
2. Sonninen A, Hurme P, Laukkanen AM. The external frame function in the control of pitch, register, and singing mode: radiographic observations of a female singer. J Voice. 1999; Sep. 13(3):319–40.
3. Sinagra DL, Montesinos MR, Tacchi VA, Moreno JC, Falco JE, Mezzadri NA, et al. Voice changes after thyroidectomy without recurrent laryngeal nerve injury. J Am Coll Surg. 2004; Oct. 199(4):556–60.
4. Bone SL, Vertigan AE, Eisenberg RL. Auditory-perceptual voice characteristics in pre-operative patients undergoing thyroid or parathyroid surgery. Folia Phoniatr Logop. 2012. 64(2):87.
5. Hong KH, Kim YK. Phonatory characteristics of patients undergoing thyroidectomy without laryngeal nerve injury. Otolaryngol Head Neck Surg. 1997; Oct. 117(4):399–404.
6. Lombardi CP, Raffaelli M, De Crea C, D’Alatri L, Maccora D, Marchese MR, et al. Long-term outcome of functional post-thyroidectomy voice and swallowing symptoms. Surgery. 2009; Dec. 146(6):1174–81.
7. Santosh M, Rajashekhar B. Perceptual and acoustic analysis of voice in individuals with total thyroidectomy: pre-post surgery comparison. Indian J Otolaryngol Head Neck Surg. 2011; Jan. 63(1):32–9.
8. Keilmann A, Hulse M. Dysphonia after thyroidectomy without lesion of the recurrent nerve. Folia Phoniatr. 1992. 44(6):261.
9. Kent RD. Anatomical and neuromuscular maturation of the speech mechanism: evidence from acoustic studies. J Speech Hear Res. 1976; Sep. 19(3):421–47.
10. Raphael EJ. Tongue position in rounded and unrounded front vowel pairs. Lang Speech. 1979; Jan. 22(1):37–48.
11. Vilkman E, Aaltonen O, Laine U, Raimo I. Intrinsic pitch of vowels: a complicated problem with an obvious solution? In: Gauffin J, Hammarberg B, editors. In : Gauffin J, Hammarberg B, editors. Vocal fold physiology. San Diego: Sigular Publishing Group;1991. p. 59–65.
12. Vilkman E, Aaltinen O, Raimo I, Arajarvi P, Oksanen H. Articulatory hyoid-laryngeal changes vs. cricothyroid muscle activity in the control of intrinsic Fo of vowels. J Phon. 1989; Jan. 17:193–203.
13. Ohala J. Speculation on pitch regulation. Phonetica. 1977; 34:310–2.
14. Erickson D, Liberman M, Niimi S. The geniohyoid and the role of the strap muscle. Haskins Lab Status Rep Speech Res. 1977; Jan-Mar. SR-49:103–10.
15. Hong KH, Kim HK, Kim YH. The role of the pars recta and pars oblique of cricothyroid muscle in speech production. J Voice. 2001; Dec. 15(4):512–8.
16. Beyer WH. CRC standard mathematical tables. 28th ed. Boca Raton, FL: CRC Press;1987.
17. Hong KH, Yang YS, Lee HD, Yoon YS, Hong YT. The effect of total thyroidectomy on the speech production. Clin Exp Otorhinolaryngol. 2015; Jun. 8(2):155–60.
18. Nam HS, Beom J, Oh BM, Han TR. Kinematic effects of hyolaryngeal electrical stimulation therapy on hyoid excursion and laryngeal elevation. Dysphagia. 2013; Dec. 28(4):548–56.
Table 1.
Variable | a | i | u | e | o | ᴧ | ɯ |
---|---|---|---|---|---|---|---|
Preoperative | 195.17* | 204.56* | 207.33* | 205.56* | 208.17* | 206.67* | 217.39* |
Postoperative | |||||||
7 day | 187.56* | 195.72* | 191.83* | 191.00* | 193.44* | 188.33* | 195.17* |
3 mo | 222.67 | 192.78* | 190.78* | 187.83* | 192.33* | 187.94* | 192.89* |
Table 2.
Variable |
a |
i |
u |
e |
o |
ᴧ |
ɯ |
|||||||
---|---|---|---|---|---|---|---|---|---|---|---|---|---|---|
F1 | F2 | F1 | F2 | F1 | F2 | F1 | F2 | F1 | F2 | F1 | F2 | F1 | F2 | |
Preoperative | 859 | 1,412 | 371 | 2,576 | 451 | 946 | 599* | 2,255 | 499 | 832 | 629 | 1,109 | 442 | 1,438 |
Postoperative | ||||||||||||||
7 day | 889 | 1,397 | 337 | 2,525 | 435 | 926 | 702 | 2,231 | 489 | 840 | 638 | 1,065 | 432 | 1,398 |
3 mo | 857 | 1,412 | 339 | 2,554 | 459 | 909 | 560* | 2,217 | 489 | 857 | 657 | 1,091 | 442 | 1,409 |
Table 3.
Variable | Mean | Standard deviation | Standard error |
---|---|---|---|
Preoperative | 273,715.87 | 63,780.47 | 15,033.20 |
Postoperative | |||
7 day | 291,840.76 | 103,843.14 | 24,476.06 |
3 mo | 293,664.35 | 77,807.53 | 18,339.41 |
Table 4.
Variable |
a |
i |
u |
e |
o |
ᴧ |
ɯ |
|||||||
---|---|---|---|---|---|---|---|---|---|---|---|---|---|---|
X | Y | X | Y | X | Y | X | Y | X | Y | X | Y | X | Y | |
Preoperative | 34.5 | 19.3* | 36.7 | 20.2 | 37.3 | 19.4 | 36.0 | 21.1* | 36.1 | 19.0 | 36.2 | 18.6 | 38.0 | 19.9 |
Postoperative | ||||||||||||||
7 day | 35.3 | 17.5* | 36.4 | 17.5 | 36.8 | 17.2 | 36.0 | 18.1* | 36.3 | 17.3 | 36.0 | 17.3 | 37.6 | 17.8 |
3 mo | 34.5 | 18.8 | 36.5 | 18.9 | 36.6 | 18.2 | 35.8 | 19.4 | 36.1 | 18.8 | 35.5 | 18.5 | 36.9 | 19.4 |