INTRODUCTION
MATERIALS AND METHODS
Study population
Demographic characteristics
Rhinologic symptoms and physical examination
Diagnosis of CRS
EuroQol 5-dimension (EQ-5D)
Statistical analysis
RESULTS
General characteristics
Table 1.
Values are presented as mean±SE or proportions (SE).
Continuous variable was tested with t-test using the SURVEYREG, categorical variable was tested with Rao-Scott chi-square test using the SURVEYFREQ procedures in SAS ver. 9.3 (SAS Institute., Cary, NC, USA) to reflect the study weights.
BMI, body mass index; EQ-5D, EuroQol 5-dimension; VAS, visual analog scale.
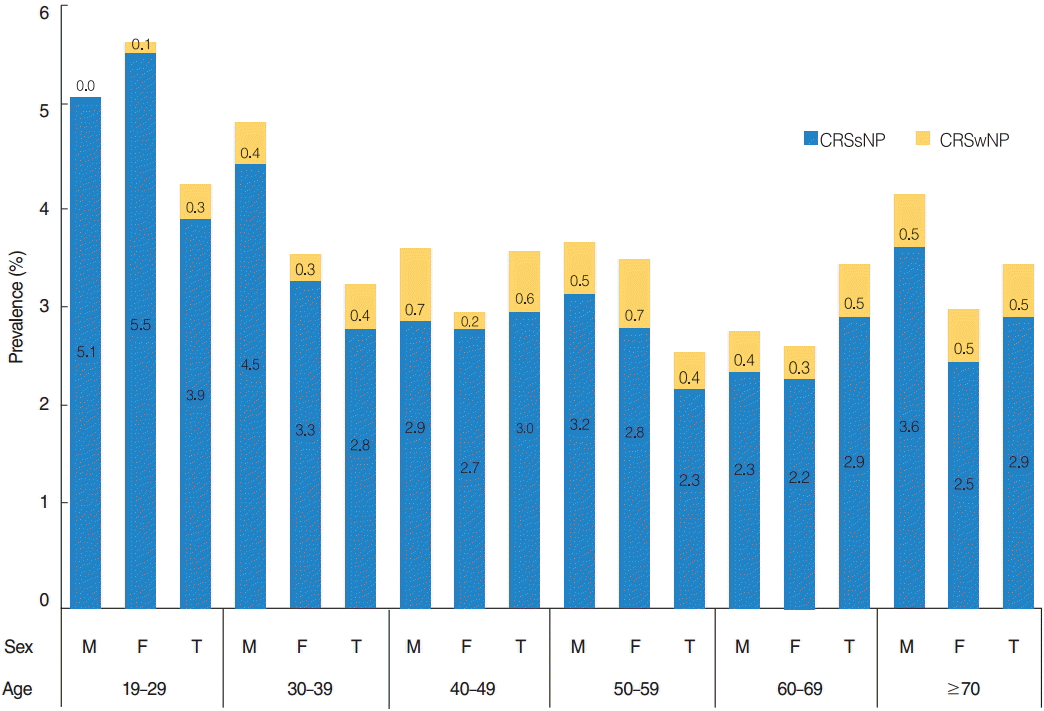
Gender differences in prevalence of CRSwNP or CRSsNP
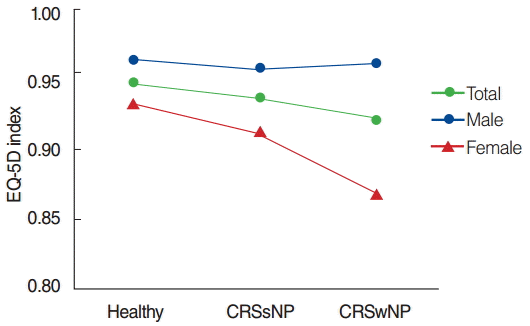
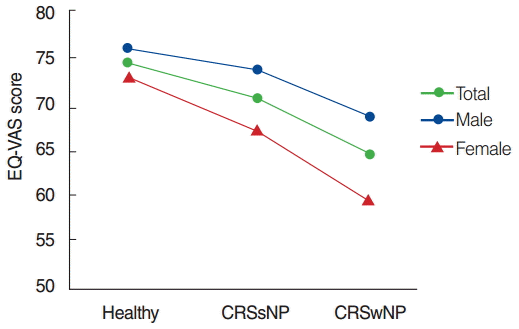
Differences in HRQoL among healthy, CRSwNP, and CRSsNP subjects
Multiple logistic regression analysis with confounder adjustment
Table 2.
| Variable |
CRS |
||
|---|---|---|---|
| Model 1 | Model 2 | Model 3 | |
| QoL dimension | |||
| Mobility | 1.490 (1.121–1.982)* | 1.581 (1.148–2.177)* | 1.571 (1.127–2.189)* |
| Self-care | 1.458 (0.923–2.302) | 1.484 (0.918–2.400) | 1.440 (0.897–2.313) |
| Usual activities | 1.878 (1.344–2.625)* | 1.863 (1.302–2.665)* | 1.823 (1.275–2.608)* |
| Pain/discomfort | 1.594 (1.262–2.013)* | 1.587 (1.233–2.043)* | 1.530 (1.185–1.976)* |
| Anxiety/depression | 1.986 (1.507–2.618)* | 2.096 (1.555–2.825)* | 2.121 (1.563–2.877)* |
| EQ-5D Index | |||
| Healthy | 73.1±0.2 | 73±0.2 | 73±0.2 |
| CRS | 68.4±0.9 | 68.1±1.0 | 68.1±1.0 |
| P-value | <0.001* | <0.001* | <0.001* |
| EQ-VAS | |||
| Healthy | 0.934±0.001 | 0.932±0.001 | 0.932±0.001 |
| CRS | 0.911±0.004 | 0.907±0.005 | 0.908±0.005 |
| P-value | <0.001* | <0.001* | <0.001* |
Values are presented as multivariate-adjusted odds ratio (95% confidence interval) or mean±SE.
Model 1, adjusted for age, body mass index (BMI), smoking status, alcohol use status and exercise status; Model 2, adjusted for age, BMI, smoking status, alcohol use status, exercise status, region of residence, income, education and marital status; Model 3, adjusted for age, BMI, smoking status, alcohol use status, exercise status, region of residence, income, education, marital status, allergic rhinitis, asthma and atopic dermatitis.
Multiple logistic regression analysis was analyzed with SURVEYLOGISTIC procedures.
CRS, chronic rhinosinusitis; EQ-5D, EuroQol 5-dimension; QoL, quality of life; VAS, visual analog scale.
Table 3.
| Varaible |
Male |
Female |
||||
|---|---|---|---|---|---|---|
| Model 1 | Model 2 | Model 3 | Model 1 | Model 2 | Model 3 | |
| QoL dimension | ||||||
| Mobility | 1.379 (0.892–2.131) | 1.532 (0.939–2.498) | 1.602 (0.940–2.732) | 1.595 (1.071–2.375)* | 1.634 (1.059–2.524)* | 1.579 (1.026–2.430)* |
| Self-care | 1.290 (0.561–2.967) | 1.428 (0.595–3.426) | 1.238 (0.515–2.972) | 1.618 (0.903–2.899) | 1.562 (0.862–2.830) | 1.630 (0.875–3.037) |
| Usual activities | 1.671 (0.960–2.907) | 1.905 (1.033–3.513)* | 1.735 (0.926–3.248) | 2.073 (1.341–3.204)* | 1.853 (1.204–2.851)* | 1.883 (1.22–2.906)* |
| Pain/discomfort | 1.363 (0.959–1.937) | 1.314 (0.903–1.912) | 1.313 (0.892–1.933) | 1.806 (1.297–2.514)* | 1.837 (1.33–2.538)* | 1.727 (1.245–2.395)* |
| Anxiety/depression | 1.422 (0.84–2.406) | 1.558 (0.857–2.832) | 1.428 (0.776–2.629) | 2.346 (1.638–3.359)* | 2.442 (1.689–3.53)* | 2.604 (1.787–3.797)* |
| EQ-5D index | ||||||
| Healthy | 0.95±0 | 0.95±0 | 0.95±0 | 0.92±0 | 0.92±0 | 0.92±0 |
| CRS | 0.94±0.01 | 0.94±0.01 | 0.94±0.01 | 0.88±0.01 | 0.88±0.01 | 0.88±0.01 |
| P-value | 0.075 | 0.064 | 0.077 | <0.001* | <0.001* | <0.001* |
| EQ-VAS | ||||||
| Healthy | 74.7±0.2 | 74.7±0.2 | 74.6±0.3 | 72±0.2 | 71.9±0.3 | 71.9±0.3 |
| CRS | 71.9±1.3 | 71.3±1.4 | 71.4±1.4 | 65.2±1.1 | 65.4±1.3 | 65.4±1.3 |
| P-value | 0.021* | 0.013* | 0.021* | <0.001* | <0.001* | <0.001* |
Values are presented as multivariate-adjusted odds ratio (95% confidence interval) or mean±SE.
Multiple logistic regression analysis was analyzed with SURVEYLOGISTIC procedures.
Model 1, adjusted for age, body mass index (BMI), smoking status, alcohol use status and exercise status; Model 2, adjusted for age, BMI, smoking status, alcohol use status, exercise status, region of residence, income, education and marital status; Model 3, adjusted for age, BMI, smoking status, alcohol use status, exercise status, region of residence, income, education, marital status, allergic rhinitis, asthma and atopic dermatitis.
CRS, chronic rhinosinusitis; EQ-5D, EuroQol 5-dimension; QoL, quality of life; VAS, visual analog scale.


 PDF
PDF Citation
 Print
Print


 XML Download