Abstract
In neurosurgical procedures that may cause visual impairment in the intraoperative period, the monitoring of flash visual evoked potential (VEP) is clinically used to evaluate visual function. Patients are unconscious during surgery under general anesthesia, making flash VEP monitoring useful as it can objectively evaluate visual function. The flash stimulus input to the retina is transmitted to the optic nerve, optic chiasm, optic tract, lateral geniculate body, optic radiation (geniculocalcarine tract), and visual cortical area, and the VEP waveform is recorded from the occipital region. Intraoperative flash VEP monitoring allows detection of dysfunction arising anywhere in the optic pathway, from the retina to the visual cortex. Particularly important steps to obtain reproducible intraoperative flash VEP waveforms under general anesthesia are total intravenous anesthesia with propofol, use of retinal flash stimulation devices using high-intensity light-emitting diodes, and a combination of electroretinography to confirm that the flash stimulus has reached the retina. Relatively major postoperative visual impairment can be detected by intraoperative decreases in the flash VEP amplitude.
The shape, color, placement, and movement of an object are identified by perceiving light (visual information) with the sensory cells of the retina, and converting this light to a membrane potential. At least 80% of necessary external information is obtained visually, making visual function the most important sense for perceiving the quality and quantity of this information. Accordingly, impaired visual function causes significant difficulties in performing normal activities.
Surgeries that pose a risk of visual impairment in the intraoperative period include neurosurgical procedures, particularly tumorectomy at the optic chiasm of pituitary adenomas, craniopharyngiomas, tuberculum sellae meningiomas, and other tumors; the removal of brain tumors from the optic pathway and structures in its vicinity such as the optic nerve, optic radiation, and occipital lobe; and internal carotid artery aneurysm clipping, which poses a risk of impeding blood flow to the ophthalmic artery. Monitoring intraoperative flash visual evoked potentials (VEPs) assesses the functionality of the optic pathway from the retina to the visual cortical area, and allows visual impairment to be avoided or minimized. Patients are unconscious during surgery under general anesthesia, making flash VEP monitoring useful as it can objectively evaluate visual function.
In 1973, Wright et al. [1] reported the first case in which flash VEP monitoring was used during surgery under general anesthesia for an intraorbital tumor. The clinical use of flash VEP monitoring under general anesthesia for preservation of visual function was subsequently investigated, but no clear utility was observed. This was because the potential obtained under general anesthesia, using the evoked potential measurement equipment available at that time, was unstable and showed poor reproducibility that weakened the relationship between changes in the potential and postoperative visual function. Intraoperative flash VEP monitoring eventually stopped being used in clinical settings around 1990 as an intraoperative tool [23]; however, several recent breakthroughs have rekindled its use under general anesthesia. The first was the spread of total intravenous anesthesia using propofol, which reduced VEP suppression by anesthetics. This was followed by the development of light-emitting diodes (LEDs) with strong illuminance; photostimulation devices using LEDs allowed the retina to be more strongly photostimulated. In 2010, Sasaki et al. [4] and Kodama et al. [5] reported the high reproducibility and utility of intraoperative flash VEP monitoring. The authors reported that reproducible flash VEP recording was possible in 93.5% (187/200 eyes) and 97.2% (103/106 eyes) of cases, respectively, and that flash VEP was even useful in clinical settings because it could be recorded with remarkably higher reproducibility compared to previous methods [45]. They also reported a strong relationship between intraoperative changes in potential and postoperative visual function.
VEP is obtained from the visual cortex by applying photostimulus to the retina, which is exposed to flash stimulation or pattern reversal stimulation [6] (Fig. 1). The neurons of the visual cortex are highly sensitive to visual stimuli by graphics with contours and contrast. Pattern reversal stimulation involving black and white lattices exchanging position at regular intervals was developed using this principle, and is excellent for effectively stimulating neurons of the visual cortex. However, pattern reversal stimulation cannot be performed under general anesthesia; therefore, flash stimulation is performed, whereby a strong light is delivered to the retina. Previously, VEP waveforms resulting from flash stimulation were complex, varied markedly among individuals, and posed problems regarding compatibility with optic nerve function [27]. However, recent improvements in stimulation devices and the development of improved anesthesia methods have enabled the recording of stable waveforms [4589]. When performing flash stimulation, it is possible to photostimulate the retina with up to 20,000 lux of illuminance using an LSF-101 II flash stimulation device (Unique Medical Co., Ltd., Tokyo, Japan), which uses LEDs [48].
To understand VEP, knowledge regarding the anatomy and physiology of the optic pathway is required. That is, it is important to know which parts of the optic pathway can be damaged by surgical manipulations and what symptoms will develop as a result. The optic pathway by which visual information is transmitted travels from the retina to the optic nerve, optic chiasm, optic tract, lateral geniculate body, optic radiation, and visual cortex of the occipital lobe. Visual images (light information) are converted into nerve signals in the retina and are transmitted to the brain via the optic nerve.
Light that enters the eye is sensed by the photoreceptor cells (rods and cones) present in the retina, after which it is converted into nerve signals and subjected to complex processing by various nerve cells in the retina until the information is finally transmitted from ganglion cells in the center of the retina to the optic nerve. The retina is formed by seven layers from the interior to the exterior: the ganglion cell layer, inner plexiform layer, inner nuclear layer, outer plexiform layer, outer nuclear layer, photoreceptor layer, and pigmented epithelial layer. The photostimulus that reaches the retinal surface stimulates primary neurons (photoreceptor cells) in the outer nuclear layer and photoreceptor layer, and this stimulation is transmitted to secondary neurons (bipolar and horizontal cells) and tertiary neurons (ganglion and amacrine cells), which transmit the information from the optic nerve—the axons of the ganglion cells—to the central nervous system.
Light information input into the nasal retina propagates to the contralateral lateral geniculate body by intersecting at the optic chiasm. Meanwhile, light information input to the temporal retina propagates to the ipsilateral lateral geniculate body. The lateral geniculate body contains almost no neurons that receive information from both eyes. The synthesis of information from the left and right eyes first occurs in the cerebral cortex. The visual cortex that receives information from the lateral geniculate body corresponds to Brodmann areas 17, 18, and 19 of the occipital lobe. A large part of the primary visual cortex of the human brain (Brodmann area 17) is embedded in the medial aspect of the occipital lobe. The conduction pathway to Brodmann area 17 reaches this area from the lateral geniculate body via the optic radiation. Information conduction pathways to Brodmann areas 18 and 19 contain input from Brodmann area 17 [10], direct input from the lateral geniculate body bypassing the optic radiation [11], and input from the superior colliculus and pulvinar of the thalamus bypassing the lateral geniculate body [12]. In addition, hemispherical coupling occurs between neurons in Brodmann areas 18 and 19 via the corpus callosum [13].
Various visual impairments occur depending on the type of damage that occurs in the optic pathway (Fig. 2). For example, damage to areas of the optic pathway occurs on the eyeball side of the optic chiasm (retina and optic nerve) and monocular visual field defects occur on the damaged side. Bitemporal hemianopia occurs following damage to the optic chiasm. Damage to anywhere in the optic pathway after the optic chiasm results in homonymous visual field defects on the opposite side, and damage to the anterior temporal lobe is associated with homonymous superior quadrantanopia. When damage to the temporal lobe is extensive, the visual field defect spreads to the lower quarter and homonymous hemianopia develops where the upper part is strongly deficient. Homonymous inferior quadrantanopia or homonymous hemianopia where the lower part is strongly deficient develops in cases of damage to the parietal lobe. Cortical blindness is caused by bilateral damage to the area above the lateral geniculate body (bilateral damage to the occipital lobe cortex and optic radiation). Complete destruction of Brodmann area 17 on both sides results in total blindness.
Because patients are unable to cooperate under general anesthesia, flash stimulation-induced VEP is the only method capable of objectively evaluating visual function. The recent use of a high-intensity LED flash stimulation device (LSF-101 II; Unique Medical Co., Ltd., Tokyo, Japan), which was developed in Japan, has enabled the stable and reproducible recording of flash VEP waveforms under general anesthesia [48]. High-intensity LEDs are embedded in the flash stimulation pad, and the small disc shape and silicone properties of the pad make it both flexible and lightweight. Illuminance can be set up to 20,000 lux, and different light emission times and cycles can be chosen. The flash stimulation pad is placed over both eyelids with the eyes closed and fixed with cornea-protecting tape or another fixative to prevent it from dislodging. Covering the pad with a light-shielding sheet is an effective means of preventing light, such as surgical lighting, from entering when performing flash stimulation. Flash stimulation can be performed at a frequency of less than 4 Hz, but is generally performed at around 1 Hz. When the frequency exceeds 5 Hz, the sinusoidal steady-state VEP is recorded, and when the stimulation frequency is further increased, the amplitude gradually decreases until a waveform is unobtainable (threshold frequency). While methods for evaluating visual function using the amplitude, phase, and threshold frequency of the sinusoidal VEP are available, there have been no studies on steady-state VEP using high-intensity LED flash stimulation devices. Therefore, such studies are required. The flash stimulation is set to an intensity that is slightly higher than that at which the VEP amplitude is attenuated by decreasing the stimulation intensity from 20,000 lux to perform maximum stimulation. When flash stimulating the retina, it is necessary to confirm that the flash stimulus has reached the retina by taking electroretinogram (ERG) recordings at the same time as the flash VEP recordings [459].
The mechanical settings for flash VEP recording are presented in Table 1. Recording electrodes are placed 4 cm above the external occipital protuberance (Oz; International 10–20 System) and 4 cm to the left and right of Oz (O1 and O2, respectively; International 10–20 System; Fig. 3) in most adults. Needle electrodes are capable of more stable recording than sealed electrodes. A reference electrode with unipolar induction is best and is placed at relatively inert positions such as the earlobe (A1 and A2; International 10–20 System), mastoid process, or forehead (Fz; International 10–20 System) [6]. Bipolar induction such as Oz–O1 is avoided due to the inversion of polarity and interference between electrodes. VEPs are measured and recorded by an evoked potential inspection device, and are processed by averaging because potentials are extremely small.
ERG must be recorded while monitoring flash VEPs [459]. Flash stimulation-induced ERG can be easily recorded using electrodes placed anywhere around the eyes, after which the ERG is processed by the same averaging as the VEPs. ERG monitoring is particularly important during frontal craniotomy. Dislodgment of the flash stimulation pad over the eyes as a result of turning the skin flap on the forehead during craniotomy can stop the flash stimulus from reaching the retina. Under such conditions, attenuation of the VEP waveform can be mistaken as a result of surgical manipulation (false positivity) if the level of light intensity input to the retina is not checked by ERG, and dislodgment of the flash stimulation pad is not noticed.
Flash stimulation-induced VEPs are evaluated by examining the peak-to-peak amplitude between negative wave near 75 ms (N75) and positive wave near 100 ms (P100) (Fig. 4). When the peak-to-peak distance between N75 and P100 decreases by at least 50% from the reference amplitude, this is reported to the surgeon as a significant change in the VEP [459]. However, as the VEP amplitude is low, at least two or more recordings of the same waveform must be confirmed to verify reproducibility. The continuous disappearance of VEP waveforms can be interpreted as the onset of severe postoperative visual impairment. However, flash stimulation-induced VEP waveforms and peak latency markedly differ among individuals; therefore judgments regarding decreases in amplitude that are insufficient to cause waveform disappearance must be made carefully. Hemianopia caused by intraoperative manipulations can be detected based on sudden decreases in VEPs; however, according to one report, such decreases cannot be detected in quadrantanopia [5]. Thus, additional detailed studies on monitoring flash stimulationinduced VEPs under general anesthesia are required because alarm points linked to improving prognosis have not been investigated in a sufficient number of cases.
Fig. 5 shows a typical VEP waveform obtained by flash stimulation [14]. At least seven components can be seen after flash stimulation. The first three components amplify gradually, but the first two of these three have small amplitudes. While the first two components are often indistinguishable when buried in background noise, the third component is the waveform that can be confirmed in all of the cases. These three initial components are described as early components, while the subsequent 4th–7th components are described as late components. The proper evoked potential induced by flash stimulation covers these early and late components. The rhythmic after discharge after the proper evoked potential is considered non-specific to flash stimulation. Early components are relatively stable in the same individual and differ little between the left and right, which is why they are easy to apply clinically. Many points regarding late components remain unclear and are considered the result of activity in cortical areas other than the optic pathway of the visual cortex traveling from the lateral geniculate body. The amplitude of VEP waveforms is approximately 5–20 µV, and the first to third waveforms are recorded with maximum amplitude and shortest latency at the occipital region. The first to third waveforms are considered to represent the action potentials of the primary visual cortex and relay zone [1516]. Meanwhile, the fifth waveform reaches its maximum amplitude and shortest latency in the parietal region. Fig. 6 shows a standard Gaussian curve for the mean latencies of the main positive peaks of affected and healthy eyes in a patient with unilateral optic neuritis. In pattern-reversal stimulation, the difference in distribution of latencies between the healthy and affected eyes is clear; however, in flash stimulation, the distribution of latencies is wider between the healthy and affected eyes, with a large degree of overlap. Therefore, it becomes difficult to use latency to evaluate waveforms in the monitoring of flash stimulation-induced VEPs. Flash stimulation-induced VEP waveforms under general anesthesia are evaluated using the peak-to-peak amplitude between the third and fourth waveforms (i.e., between N75 and P100).
In patients with severe visual impairment prior to surgery, VEP waveforms have low reproducibility and are difficult to record. In patients with blindness or severe visual field defects in their preoperative visual function, it is difficult to obtain a stable VEP waveform because the optic nerve cannot be sufficiently stimulated by flash stimulation. Kodama et al. [5] reported that stable intraoperative VEP monitoring is possible in cases with preoperative visual acuity using the Landolt ring ≥ 0.4. Therefore, the suitability of intraoperative VEP monitoring must be determined in accordance with the preoperative visual function to perform highly reliable VEP monitoring.
Due to the effects of hypothermia on VEPs, caution is required during general anesthesia when changes in body temperature are prone to occur. Synaptic transmission is more susceptible to the effects of hypothermia than axial propagation. A drop in temperature by 1℃ reduces peripheral conduction by 5% and central conduction by 15% [1718]. Therefore, the optic pathway, which is a polysynaptic pathway, is considered sensitive to hypothermia. Compared to VEP latency at 37℃, latency at 33℃ is extended by 10–20%. Decreases in body temperature gradually cause the VEP amplitude to attenuate and latency to extend, and waveforms completely disappear at 25–27℃ [19].
In hypocapnia, changes occur in pH, the concentration of ionized calcium, and the ion balance of nerve membranes that promote the stimulation of neurons. This results in acceleration of the conduction velocity of the somatosensory evoked potential [20]. Even during VEP monitoring, general anesthesia should be managed to avoid any major changes in partial pressure of carbon dioxide in the blood.
Compared to the spinal cord and subcortex, the cerebral cortex has a high metabolic rate that gives it a low tolerance to hypoxia [21]. Furthermore, decreases in the mean blood pressure that go beyond the scope of autoregulation affect the evoked potential because the transport of oxygen to neurons is reduced. The optic pathway includes the occipital lobe cortex, and VEP amplitude is decreased and latency is extended under conditions of extreme hypoxia and hypotension.
Blood is diluted by maintenance of normovolemia using crystalloid and/or colloid replacement for intraoperative hemorrhage. Excessive hemodilution can change VEPs. Hematocrit below 15% extends VEP latency and reduces VEP amplitude, but VEPs have also been reported to recover by returning the hematocrit to 22% [22].
A control ERG is recorded prior to turning over the skin flap on the forehead. If the LED flash stimulation electrode is dislodged from its position due to turning of the skin flap, the illuminance that reaches the retina becomes insufficient and flash VEP monitoring becomes difficult. If the ERG amplitude decreases due to turning the skin flap, the flap is adjusted and returned to a position where the retina can be stimulated with sufficient illuminance. Intraoperative flash VEPs should be recorded once ERG constancy has been confirmed.
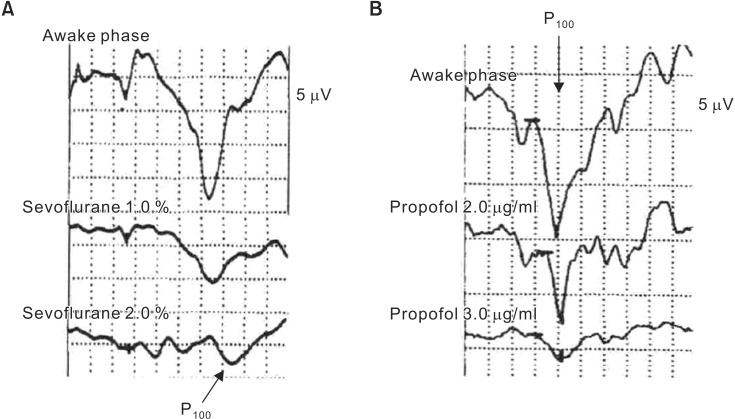
In some cases, flash VEPs change not as a result of damage to the optic pathway or ischemia but due to the anesthetics. Anesthetics that do not affect flash VEP waveforms must be chosen to allow highly reliable VEP monitoring [23]. As anesthetics suppress synaptic transmission, reactions from polysynaptic pathways are easily suppressed. The optic pathway that is subjected to flash VEP monitoring is strongly influenced by anesthetics because it passes through three synapses, including the lateral geniculate body, as it travels from the retina to the visual cortical area. The effects of various anesthetics on flash VEPs are summarized in Table 2. All inhaled anesthetic gases suppress flash VEPs by extending flash VEP latency and reducing flash VEP amplitude in a concentration-dependent manner, even at low concentrations [2425] (Fig. 7). Nitrous oxide causes marked attenuation of the amplitude [26] and the disappearance of waveforms when combined with an inhaled anesthetic gas [27]. Among intravenous anesthetics, only propofol has a small suppressive effect on flash VEPs, while other intravenous anesthetics are not suitable for intraoperative flash VEP monitoring because they markedly suppress flash VEPs even at low concentrations. Thiopental extends the latency and attenuates the amplitude in a dose-dependent manner, and causes waveforms to disappear at a dose of 6 mg/kg [28]. Ketamine only causes a slight extension in latency but markedly attenuates amplitude [29]. The opioids fentanyl and remifentanil have no effects on flash VEPs at normal clinical doses. However, there may be a need for caution when administering fentanyl in a single large dose (10–60 µg/kg), according to a report on the amplitude decreasing by up to a maximum of 30% [30]. Muscle relaxants can be used because they have no effects on flash VEP. Care should be taken when selecting an anesthetic and its method of administration because flash VEPs are greatly influenced by anesthetics. Therefore, the anesthetic method suitable for flash VEP monitoring under general anesthesia is total intravenous anesthesia with propofol, a narcotic (fentanyl or remifentanil), and a muscle relaxant. However, even propofol suppresses the VEP when administered in large doses, which is why the depth of anesthesia must be regulated by a bispectral index monitor or another device.
Surgeries that pose a risk of visual impairment include neurosurgical procedures, spinal surgery performed in the prone position, cardiovascular surgery, and infrequently, robot-assisted prostate surgery with the head tilted downward. Neurosurgical procedures in particular include tumorectomy at the optic chiasm of pituitary adenomas, craniopharyngiomas, tuberculum sellae meningiomas, and other tumors; the removal of brain tumors from the optic pathway and structures in its vicinity such as the optic nerve, optic radiation, and occipital lobe; and internal carotid artery aneurysm clipping, which poses a risk of impeding blood flow to the ophthalmic artery. The mechanisms by which visual impairment occur include physical damage to the optic pathway as a result of surgical manipulations and impeded blood flow as a result of inappropriate aneurysm clipping. Intraoperative flash VEP monitoring allows dysfunction arising anywhere in the optic pathway, from the retina to the visual cortex, to be detected and visual impairment to be avoided or minimized. Patients are unconscious during surgery under general anesthesia, which makes flash VEP monitoring that is capable of objectively evaluating visual function useful. Particularly important steps to obtain reproducible flash VEP waveforms are total intravenous anesthesia with propofol, use of a high-intensity LED flash stimulation device, and ERG monitoring. If even one of these steps is missing, highly reliable flash VEPs cannot be monitored. When the flash VEP amplitude decreases markedly during surgery (the peak-to-peak distance between N75 and P100 decreases by > 50% compared to the control), a warning is issued to the surgeon once a false-positive change has been excluded. The presence or absence of a false-positive flash VEP decrease is checked by first verifying if the retina is being stimulated with sufficient illuminance. If the ERG is decreasing, the stimulation intensity is raised to adjust the amplitude so that it is at the same level as the control ERG. If the ERG is inadequately restored by adjusting the flash stimulation intensity, the position of the flash stimulation pad is adjusted by asking the surgeon to adjust the turned-over skin flap. If a sufficient ERG amplitude is obtained, the anesthetics and body temperature are checked. Then the anesthesiologist is asked if a propofol bolus has been administered or the sustained dose has been increased. It is important to keep the patient warm before surgery with a blanket to prevent a decrease in body temperature. Once all of the above have been confirmed, a warning is issued to the surgeon.
While it was once difficult to record stable flash VEP waveforms under general anesthesia, recent developments, including propofol anesthesia, retinal flash stimulation devices using high-intensity LEDs, and a combination with ERG monitoring to confirm that the flash stimulus has reached the retina, have made it easy to obtain reproducible flash VEP waveforms under general anesthesia. Relatively major postoperative visual impairment can be detected by intraoperative decreases in the flash VEP amplitude. In the future, flash VEPs may be used in clinical settings as part of routine monitoring in various procedures that could cause postoperative visual impairment, such as surgeries in the prone position or with the head tilted downward, as well as in neurosurgical procedures.
References
1. Wright JE, Arden G, Jones BR. Continuous monitoring of the visually evoked response during intra-orbital surgery. Trans Ophthalmol Soc U K. 1973; 93:311–314. PMID: 4526452.
2. Cedzich C, Schramm J. Monitoring of flash visual evoked potentials during neurosurgical operations. Int Anesthesiol Clin. 1990; 28:165–169. PMID: 2197231.

3. Neuloh G. Time to revisit VEP monitoring? Acta Neurochir (Wien). 2010; 152:649–650. PMID: 20146073.

4. Sasaki T, Itakura T, Suzuki K, Kasuya H, Munakata R, Muramatsu H, et al. Intraoperative monitoring of visual evoked potential: introduction of a clinically useful method. J Neurosurg. 2010; 112:273–284. PMID: 19199497.

5. Kodama K, Goto T, Sato A, Sakai K, Tanaka Y, Hongo K. Standard and limitation of intraoperative monitoring of the visual evoked potential. Acta Neurochir (Wien). 2010; 152:643–648. PMID: 20127123.

6. American Clinical Neurophysiology Society. Guideline 9B: Guidelines on visual evoked potentials. J Clin Neurophysiol. 2006; 23:138–156. PMID: 16612231.
7. Cedzich C, Schramm J, Fahlbusch R. Are flash-evoked visual potentials useful for intraoperative monitoring of visual pathway function? Neurosurgery. 1987; 21:709–715. PMID: 3696406.

8. Sato A. Interpretation of the causes of instability of flash visual evoked potentials in intraoperative monitoring and proposal of a recording method for reliable functional monitoring of visual evoked potentials using a light-emitting device. J Neurosurg. 2016; 125:888–897. PMID: 26894463.

9. Kamio Y, Sakai N, Sameshima T, Takahashi G, Koizumi S, Sugiyama K, et al. Usefulness of intraoperative monitoring of visual evoked potentials in transsphenoidal surgery. Neurol Med Chir (Tokyo). 2014; 54:606–611.

10. Sesma MA, Casagrande VA, Kaas JH. Cortical connections of area 17 in tree shrews. J Comp Neurol. 1984; 230:337–351. PMID: 6520238.

11. Geisert EE. The projection of the lateral geniculate nucleus to area 18. J Comp Neurol. 1985; 238:101–106. PMID: 4044901.

12. Celesia GG, Archer CR, Kuroiwa Y, Goldfader PR. Visual function of the extrageniculo-calcarine system in man: relationship to cortical blindness. Arch Neurol. 1980; 37:704–706. PMID: 7436812.
13. Cusick CG, MacAvoy MG, Kaas JH. Interhemispheric connections of cortical sensory areas in tree shrews. J Comp Neurol. 1985; 235:111–128. PMID: 3989001.

14. Ciganek L. The EEG response (evoked potential) to light stimulus in man. Electroencephalogr Clin Neurophysiol. 1961; 13:165–172. PMID: 13693643.
15. Whittingstall K, Wilson D, Schmidt M, Stroink G. Correspondence of visual evoked potentials with FMRI signals in human visual cortex. Brain Topogr. 2008; 21:86–92. PMID: 18841455.

16. Whittingstall K, Stroink G, Schmidt M. Evaluating the spatial relationship of event-related potential and functional MRI sources in the primary visual cortex. Hum Brain Mapp. 2007; 28:134–142. PMID: 16761265.

17. Russ W, Sticher J, Scheld H, Hempelmann G. Effects of hypothermia on somatosensory evoked responses in man. Br J Anaesth. 1987; 59:1484–1491. PMID: 3501304.

18. Zeitlhofer J, Steiner M, Bousek K, Fitzal S, Asenbaum S, Wolner E, et al. The influence of temperature on somatosensory-evoked potentials during cardiopulmonary bypass. Eur Neurol. 1990; 30:284–290. PMID: 2269321.

19. Russ W, Kling D, Loesevitz A, Hempelmann G. Effect of hypothermia on visual evoked potentials (VEP) in humans. Anesthesiology. 1984; 61:207–210. PMID: 6331776.

20. Ledsome JR, Cole C, Sharp-Kehl JM. Somatosensory evoked potentials during hypoxia and hypocapnia in conscious humans. Can J Anaesth. 1996; 43:1025–1029. PMID: 8896854.

21. Kobrine AI, Evans DE, Rizzoli HV. Relative vulnerability of the brain and spinal cord to ischemia. J Neurol Sci. 1980; 45:65–72. PMID: 6766991.

22. Nagao S, Roccaforte P, Moody RA. The effects of isovolemic hemodilution and reinfusion of packed erythrocytes on somatosensory and visual evoked potentials. J Surg Res. 1978; 25:530–537. PMID: 102873.

23. Banoub M, Tetzlaff JE, Schubert A. Pharmacologic and physiologic influences affecting sensory evoked potentials: implications for perioperative monitoring. Anesthesiology. 2003; 99:716–737. PMID: 12960558.
24. Chi OZ, Field C. Effects of isoflurane on visual evoked potentials in humans. Anesthesiology. 1986; 65:328–330. PMID: 3752582.

25. Kameyama Y. Effect of isoflurane and sevoflurane on evoked potentials and EEG. Masui. 1994; 43:657–664. PMID: 8015151.
26. Sebel PS, Flynn PJ, Ingram DA. Effect of nitrous oxide on visual, auditory and somatosensory evoked potentials. Br J Anaesth. 1984; 56:1403–1407. PMID: 6498051.

27. Sebel PS, Ingram DA, Flynn PJ, Rutherfoord CF, Rogers H. Evoked potentials during isoflurane anaesthesia. Br J Anaesth. 1986; 58:580–585. PMID: 3707793.

28. Chi OZ, Ryterband S, Field C. Visual evoked potentials during thiopentone-fentanyl-nitrous oxide anaesthesia in humans. Can J Anaesth. 1989; 36:637–640. PMID: 2582563.

29. Hou WY, Lee WY, Lin SM, Liu CC, Susceto L, Sun WZ, et al. The effects of ketamine, propofol and nitrous oxide on visual evoked potential during fentanyl anesthesia. Ma Zui Xue Za Zhi. 1993; 31:97–102. PMID: 7934693.
30. Chi OZ, McCoy CL, Field C. Effects of fentanyl anesthesia on visual evoked potentials in humans. Anesthesiology. 1987; 67:827–830. PMID: 3674492.

Fig. 1
Retinal stimulation methods for VEP monitoring. The retina is stimulated by (A) pattern reversal stimulation or (B) flash stimulation. Flash stimulation-induced VEP monitoring is the only method capable of evaluating visual function under general anesthesia.
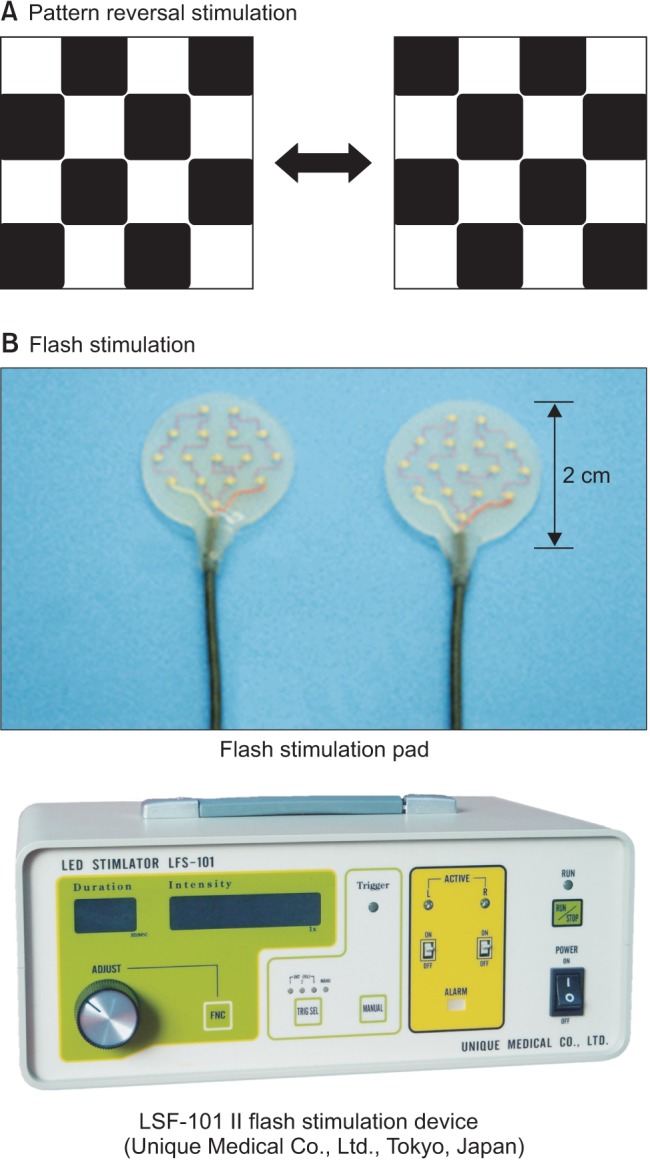
Fig. 2
Various types of visual impairment due to damage to areas of the optic pathway. The visual field defect portion is shown in black.
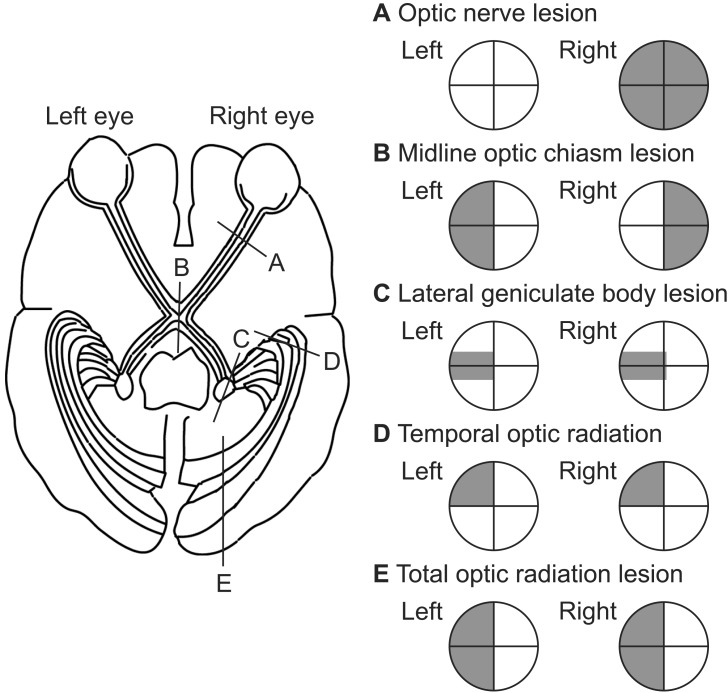
Fig. 3
Recording electrode locations for VEP monitoring. VEP is recorded from occipital scalp electrodes (O1, O2, Oz; International 10–20 System). The mid-occipital electrode (Oz) is placed above the external occipital protuberance (inion) calculated as 10% of the distance between the inion and nasion, which is 4 cm in most adults. The lateral occipital electrodes (O1 and O2) are placed 4 cm to the left and right of Oz.
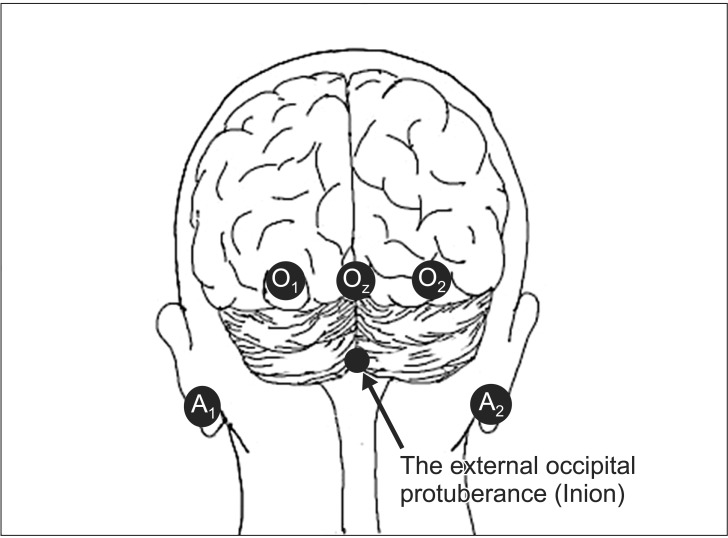
Fig. 4
Flash VEP waveform. Flash VEP is evaluated by examining the peak-to-peak amplitude between negative wave near 75 ms (N75) and positive wave near 100 ms (P100). A significant decrease in flash VEP is defined as a decrease in peak-to-peak distance between N75 and P100 by at least 50% from the reference amplitude.
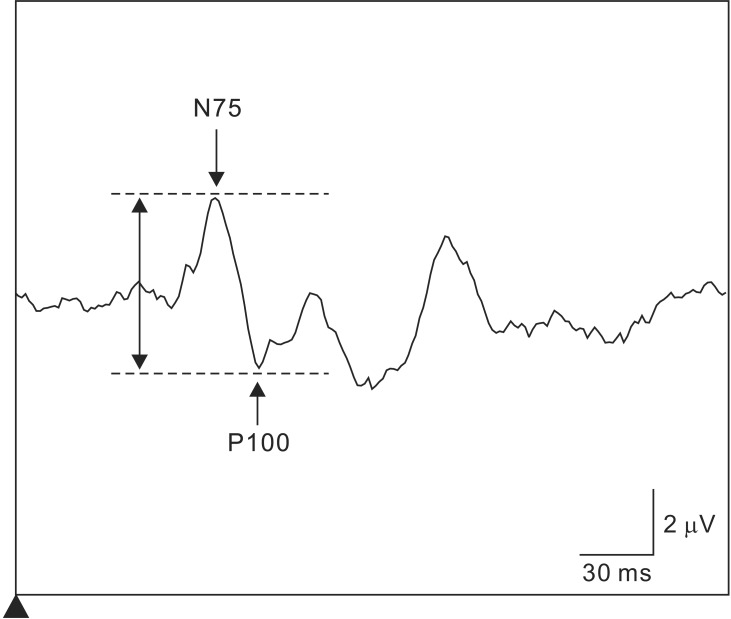
Fig. 5
Schematic diagram of VEP waveform induced by flash stimulation. Upward is negative (Partial modification from Electroenceph Clin Neurophysiol 1961; 13: 165-72).
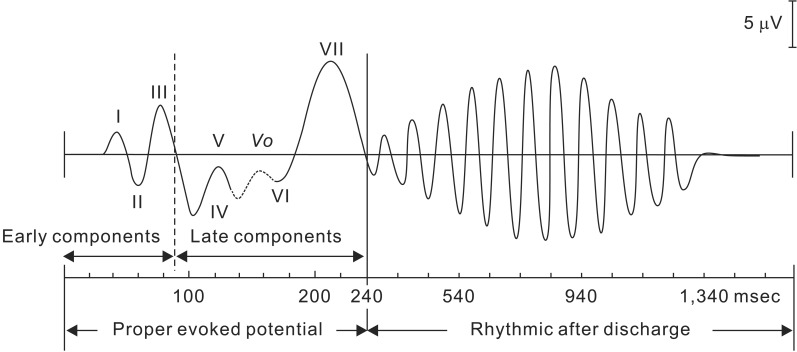
Fig. 6
Comparison of the average latency of major positive vertices of VEP induced by flash stimulation and pattern reversal stimulation (Partial modification from Evoked Potentials in Clinical Testing, Churchill Livingston, 1982, p188).
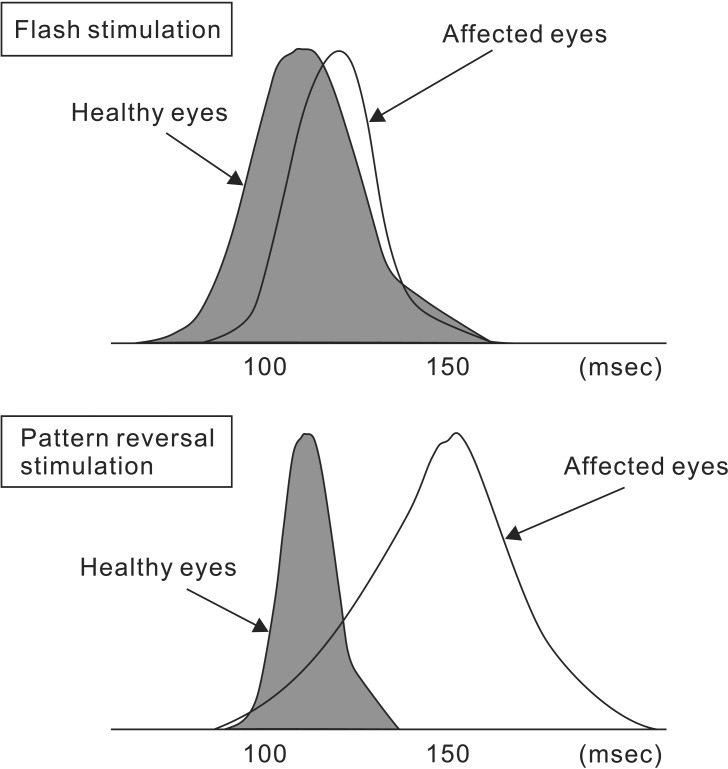
Fig. 7
Effects of sevoflurane and propofol on flash VEP waveform. (A) Sevoflurane markedly suppresses flash VEP waveform by extending VEP latency and reducing VEP amplitude in a concentration-dependent manner, even at low concentrations. (B) Propofol has less suppressive effects on the flash VEP waveform. However, even propofol suppresses the flash VEP when administered in high doses (Partial modification from Masui 2006; 55: 692-8).


 PDF
PDF Citation
 Print
Print


 XML Download