Abstract
Background
Methods
Results
ACKNOWLEDGMENTS
Notes
Funding Statement
Clinical monitors were provided by Edwards Lifesciences and Pulsion Medical systems for the duration of the study, while disposables were purchased by the researchers. Further support was provided solely by institutional and/or departmental sources.
Author Contributions
Amon Heijne (Conceptualization; Data curation; Formal analysis; Methodology; Resources; Visualization; Writing – original draft; Writing – review & editing)
Piet Krijtenburg (Conceptualization; Data curation; Investigation; Methodology; Validation; Writing – original draft; Writing – review & editing)
Andre Bremers (Data curation; Investigation; Resources; Supervision; Validation; Writing – original draft; Writing – review & editing)
Gert Jan Scheffer (Conceptualization; Investigation; Supervision; Writing – original draft; Writing – review & editing)
Ignacio Malagon (Conceptualization; Methodology; Supervision; Validation; Visualization; Writing – original draft; Writing – review & editing)
Cornelis Slagt (Conceptualization; Investigation; Methodology; Supervision; Writing – original draft; Writing – review & editing)
References
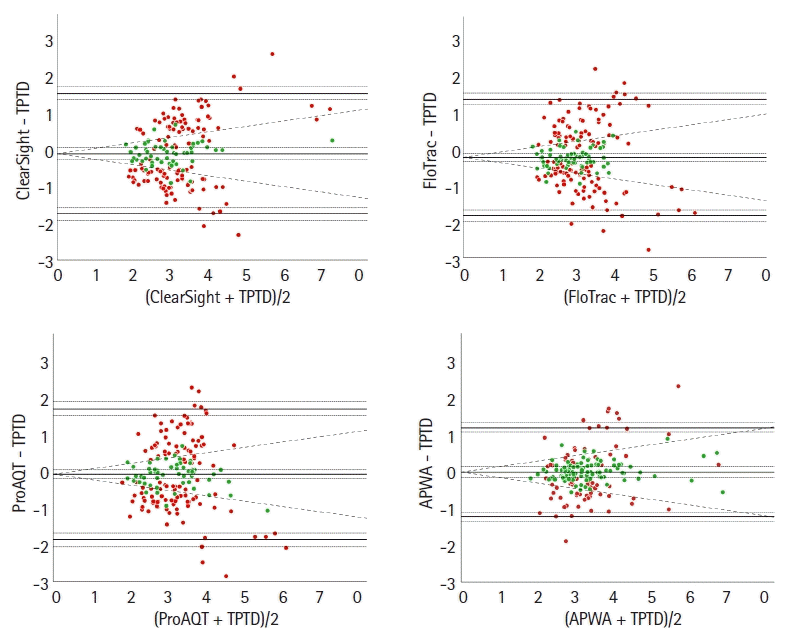
Fig. 1.

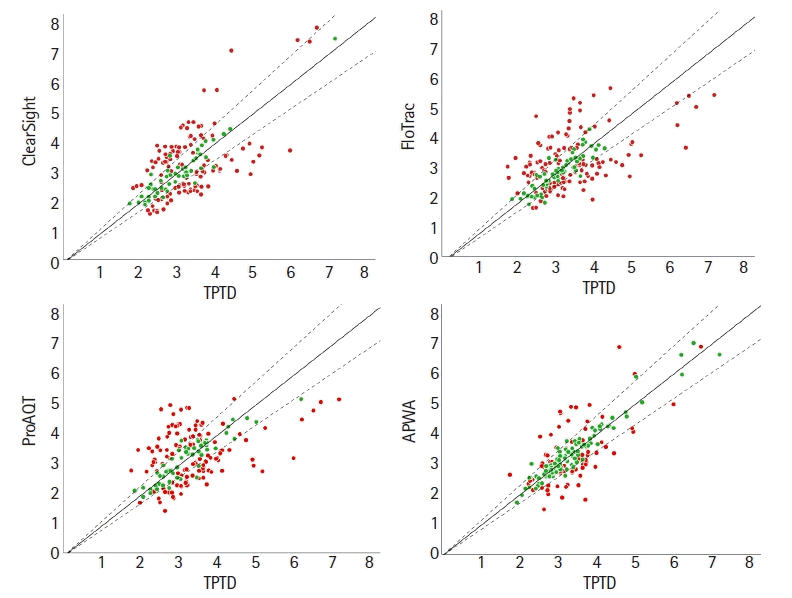
Fig. 2.

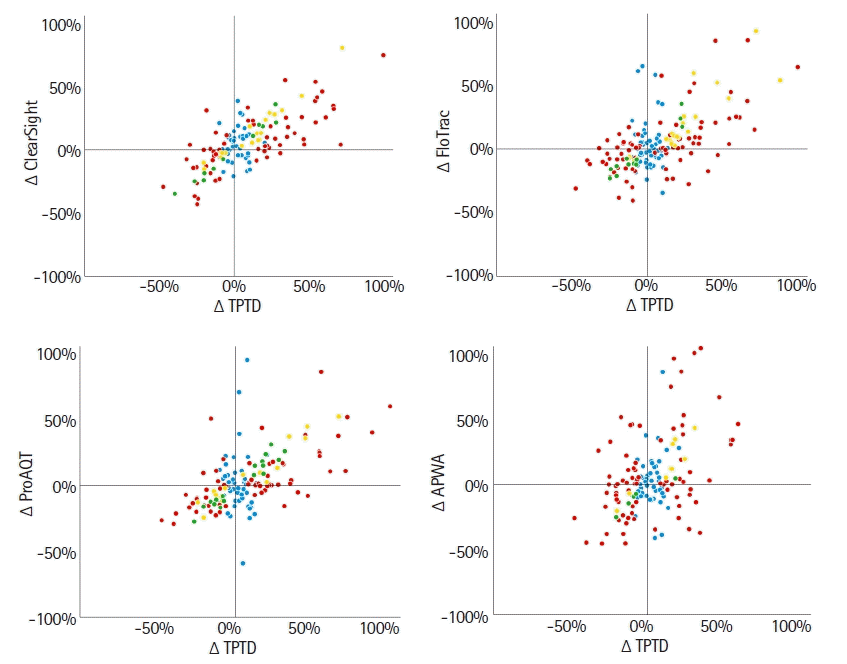
Fig. 3.

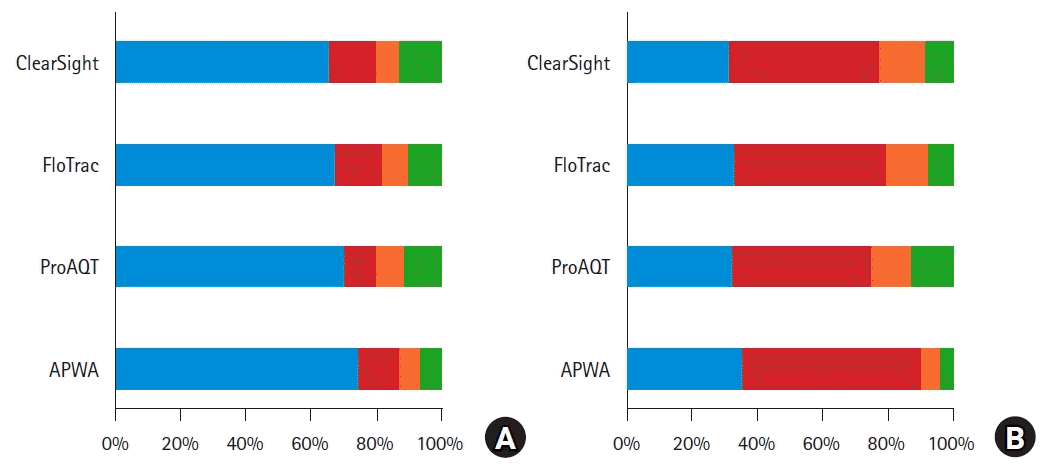
Fig. 4.

Table 1.
Values are presented as mean ± SD, median (Q1, Q3), or number of patients. Four patients were considered inoperable and did not receive HIPEC treatment. Cumulative norepinephrine dose and fluid balance are taken into account from the start of surgery to T7. ASA PS: American Society of Anesthesiologists physical status, CRS: cytoreductive surgery, HIPEC: hyperthermic intraperitoneal chemotherapy.
Table 2.
Patient No. of 12, 14, 15, 24 were considered inoperable and did not receive HIPEC treatment. BMI: body mass index, ASA PS: American Society of Anesthesiologists physical status, CRS: cytoreductive surgery, mito: mitomycin, ox: oxaliplatin, cis: cisplatin, HIPEC: hyperthermic intraperitoneal chemotherapy.
Table 3.
| T1 | T2 | T3 | T4 | T5 | T6 | T7 | T8 | T9 | Overall | |
|---|---|---|---|---|---|---|---|---|---|---|
| Blood temperature (°C) | 35.8 (35.6, 36.0) | 35.7 (35.5, 35.9) | 35.8 (35.5, 36.0) | 35.9 (35.6, 36.1) | 37.5* (37.3, 37.8) | 37.0* (36.6, 37.4) | 36.5* (36.3, 36.8) | 37.2* (36.8, 37.6) | 37.2* (37.0, 37.5) | |
| Systemic vascular resistance index (dyne∙sec/cm5∙m2) | 2168 (1901, 2434) | 1664* (1460, 1867) | 1729* (1559, 1899) | 1805 (1546, 2064) | 1468† (1312, 1625) | 1474† (1340, 1607) | 1508* (1383, 1633) | 1841 (1638, 2043) | 1598* (1425, 1771) | |
| Bias (L/min/m2) | ||||||||||
| ClearSight | −0.1 (−0.5, 0.3) | −0.2 (−0.6, 0.2) | −0.3 (−0.7, 0.2) | 0.1 (−0.5, 0.6) | 0.0 (−0.7, 0.7) | −0.1 (−0.6, 0.5) | −0.2 (−0.6, 0.1) | 0.1 (−0.4, 0.5) | −0.2 (−0.5, 0.2) | −0.1 (−0.3, 0.0) |
| FloTrac | −0.1 (−0.3, 0.1) | −0.1 (−0.4, 0.3) | 0.0 (−0.3, 0.4) | 0.1 (−0.3, 0.5) | −0.3 (−0.7, 0.1) | −0.5 (−0.8, −0.1) | −0.5 (−0.9, −0.2) | −0.2 (−0.5, 0.1) | −0.6 (−0.9, −0.3) | −0.2 (−0.3, −0.1) |
| ProAQT | 0.3 (0.0, 0.6) | −0.1 (−0.4, 0.3) | −0.3 (−0.6, 0.0) | −0.1 (−0.4, 0.3) | −0.5 (−0.9, −0.1) | −0.4 (−0.7, 0.0) | −0.4 (−0.8, −0.1) | 0.4 (0.0, 0.9) | 0.4 (0.1, 0.8) | −0.1 (−0.2, 0.0) |
| APWA | −0.2 (−0.6, 0.1) | −0.1 (−0.6, 0.4) | −0.2 (−0.6, 0.3) | −0.2 (−0.7, 0.3) | 0.1 (−0.3, 0.5) | 0.0 (−0.4, 0.4) | 0.2 (−0.2, 0.6) | 0.0 (−0.5, 0.5) | −0.1 (−0.2, 0.1) | |
| TPTD | 0.0 (−0.2, 0.2) | 0.0 (−0.3, 0.3) | 0.0 (−0.4, 0.4) | 0.0 (−0.4, 0.4) | 0.0 (−0.4, 0.4) | 0.0 (−0.4, 0.4) | 0.0 (−0.4, 0.4) | 0.0 (−0.3, 0.3) | 0.0 (−0.4, 0.4) | 0.0 (−0.1, 0.1) |
| Limits of agreement (L/min/m2) | ||||||||||
| ClearSight | ±1.5 (1.1, 2.1) | ±2.0 (1.5, 2.8) | ±1.6 (1.2, 2.3) | ±1.7 (1.3, 2.4) | ±1.8 (1.3, 2.6) | ±1.7 (1.3, 2.4) | ±1.8 (1.3, 2.6) | ±1.4 (1.0, 2.5) | ±1.7 (1.2, 2.8) | ±1.6 (1.5, 1.8) |
| FloTrac | ±1.1 (0.8, 1.5) | ±1.8 (1.4, 2.5) | ±1.7 (1.3, 2.4) | ±1.9 (1.5, 2.7) | ±1.4 (1.1, 2.0) | ±1.6 (1.2, 2.2) | ±1.8 (1.3, 2.5) | ±1.4 (1.0, 2.0) | ±1.8 (1.3, 2.7) | ±1.6 (1.5, 1.8) |
| ProAQT | ±1.2 (0.9, 1.8) | ±1.8 (1.4, 2.5) | ±2.0 (1.5, 2.8) | ±1.5 (1.1, 2.1) | ±1.5 (1.1, 2.2) | ±1.8 (1.3, 2.5) | ±2.0 (1.5, 2.7) | ±1.7 (1.2, 2.7) | ±1.9 (1.3, 3.0) | ±1.8 (1.6, 2.0) |
| APWA | ±1.3 (1.0, 1.8) | ±1.4 (1.1, 1.9) | ±1.0 (0.7, 1.4) | ±1.4 (1.1, 2.0) | ±1.1 (0.9, 1.6) | ±0.9 (0.7, 1.3) | ±1.0 (0.7, 1.5) | ±1.4 (1.1, 2.1) | ±1.2 (1.1, 1.3) | |
| TPTD | ±0.4 (0.3, 0.6) | ±0.5 (0.4, 0.7) | ±0.5 (0.4, 0.7) | ±0.5 (0.4, 0.8) | ±0.6 (0.4, 0.8) | ±0.5 (0.4, 0.7) | ±0.5 (0.4, 0.6) | ±0.4 (0.3, 0.5) | ±0.5 (0.4, 0.8) | ±0.4 (0.4, 0.4) |
| Repeatability coefficient (L/min/m2) | ||||||||||
| ClearSight | 0.4 (0.3, 0.6) | 0.5 (0.4, 0.7) | 0.4 (0.3, 0.5) | 0.3 (0.2, 0.4) | 0.2 (0.2, 0.3) | 0.3 (0.3, 0.5) | 0.2 (0.2, 0.3) | 0.5 (0.3, 0.8) | 0.5 (0.3, 0.8) | 0.4 (0.3, 0.4) |
| FloTrac | 0.3 (0.3, 0.5) | 0.3 (0.3, 0.5) | 0.3 (0.2, 0.4) | 0.5 (0.4, 0.7) | 0.2 (0.2, 0.3) | 0.5 (0.3, 0.6) | 0.6 (0.5, 0.8) | 0.4 (0.3, 0.5) | 0.3 (0.2, 0.4) | 0.4 (0.3, 0.4) |
| ProAQT | 0.5 (0.4, 0.8) | 0.5 (0.4, 0.7) | 0.5 (0.4, 0.7) | 0.4 (0.3, 0.6) | 0.2 (0.1, 0.3) | 0.5 (0.3, 0.6) | 0.3 (0.2, 0.5) | 0.6 (0.4, 0.9) | 0.5 (0.4, 0.9) | 0.4 (0.4, 0.5) |
| APWA | 0.5 (0.3, 0.6) | 0.4 (0.3, 0.5) | 0.5 (0.4, 0.8) | 0.4 (0.3, 0.6) | 0.4 (0.3, 0.6) | 0.5 (0.4, 0.8) | 0.4 (0.3, 0.6) | 0.6 (0.5, 0.9) | 0.5 (0.4, 0.5) | |
| TPTD | 0.4 (0.3, 0.6) | 0.5 (0.4, 0.7) | 0.5 (0.4, 0.7) | 0.6 (0.4, 0.8) | 0.6 (0.4, 0.8) | 0.5 (0.4, 0.7) | 0.5 (0.4, 0.7) | 0.4 (0.3, 0.6) | 0.6 (0.4, 0.9) | 0.5 (0.4, 0.5) |
| Percentage error (%) | ||||||||||
| ClearSight | 58 (43, 84) | 60 (46, 84) | 52 (40, 72) | 52 (39, 74) | 51 (38, 76) | 50 (37, 71) | 53 (39, 77) | 45 (30, 77) | 49 (34, 77) | 50 (45, 56) |
| FloTrac | 42 (33, 58) | 53 (40, 75) | 53 (40, 74) | 59 (45, 84) | 43 (32, 62) | 48 (37, 68) | 55 (42, 78) | 43 (32, 62) | 54 (39, 79) | 50 (46, 56) |
| ProAQT | 45 (33, 65) | 53 (40, 74) | 63 (48, 88) | 45 (34, 66) | 47 (34, 68) | 54 (41, 76) | 59 (45, 83) | 49 (34, 77) | 50 (35, 79) | 54 (49, 60) |
| APWA | 39 (29, 54) | 44 (33, 60) | 31 (23, 44) | 43 (32, 61) | 32 (24, 45) | 28 (21, 39) | 30 (22, 44) | 40 (29, 59) | 36 (32, 40) | |
| TPTD | 17 (13, 23) | 14 (11, 20) | 15 (12, 21) | 17 (13, 24) | 16 (12, 23) | 15 (11, 21) | 13 (10, 18) | 11 (8, 16) | 15 (11, 21) | 12 (11, 13) |
Values are presented as mean (95% CI). Bland-Altman analysis at each predefined time-point (T1-T9). Bland-Altman analysis at each predefined time-point as follows: T1: after induction of general anesthesia but before surgical incision, T2: 30 minutes after the start of cytoreductive surgery (CRS), T3: 30 minutes before the end of CRS (in consultation with the surgeon or halfway iv chemotherapy), T4: after CRS, before the start of the hyperthermic intraperitoneal chemotherapy (HIPEC) procedure, T5: halfway through HIPEC, T6: after the end of chemotherapy perfusion, T7: at the end of surgery but still in the operating room, T8: approximately six hours postoperatively in the intensive care unit (ICU), T9: approximately 12 hours postoperatively in the ICU. LoA: limits of agreement, RC: repeatability coefficient, PE: percentage error, APWA: arterial pressure waveform analysis by PiCCO, TPTD: transpulmonary thermodilution. The temperature during T5-T9 are significantly higher compared to T1-T4,


 PDF
PDF Citation
 Print
Print


 XML Download