Introduction
Materials and Methods
Data collection
Table 1.
From Silber et al. [8].
Statistical analysis
Results
Table 2.
| Variable | Total series (n = 57) |
Complications in ICU |
P value | |
|---|---|---|---|---|
| No (n = 29) | Yes (n = 28) | |||
| Age (yr) | 61 (52, 67) | 64 (58, 66) | 60 (50, 67.5) | 0.297* |
| Current tumor | 0.610† | |||
| Primary | 41 (72) | 20 (69) | 21 (75) | |
| Relapsed | 16 (28) | 9 (31) | 7 (25) | |
| Carcinomatosis type | 0.849† | |||
| Colorectal | 2 (4) | 1 (3) | 1 (4) | |
| Ovarian | 47 (82) | 24 (83) | 23 (82) | |
| Endometrial | 2 (4) | 1 (3) | 1 (4) | |
| Pseudomyxoma | 1 (2) | 1 (3) | 0 (0) | |
| Primary | 4 (7) | 2 (7) | 2 (7) | |
| Gastric | 1 (2) | 0 (0) | 1 (4) | |
| Neoadjuvant treatment | 21 (37) | 8 (28) | 13 (46) | 0.141† |
| Carcinomatosis index | 0.469† | |||
| 1–10 | 26 (46) | 11 (38) | 15 (54) | |
| 11–20 | 20 (35) | 12 (41) | 8 (29) | |
| +20 | 11 (19) | 6 (21) | 5 (18) | |
| CA125 | 174 (51, 800) | 174 (58, 1280) | 177.5 (50, 500) | 0.672* |
Table 3.
| Variable | Total series (n = 57) |
Complications in ICU |
P value | |
|---|---|---|---|---|
| No (n = 29) | Yes (n = 28) | |||
| Digestive anastomosis | 39 (68) | 20 (69) | 19 (68) | 0.928† |
| Lymphadenectomy | 47 (82) | 25 (86) | 22 (79) | 0.451† |
| HIPEC | 19 (33) | 10 (34) | 9 (32) | 0.849† |
| Duration (min) | 480 (400, 600) | 540 (410, 600) | 458 (375, 585) | 0.230* |
| Visceral resections | 48 (84) | 25 (86) | 23 (82) | 0.673† |
| Number of resections | 4 (3, 6) | 4 (3, 6) | 4 (2.5, 5) | 0.519* |
| Blood loss (ml) | 0.451† | |||
| 0–1000 | 7 (12) | 5 (17) | 2 (7) | |
| 1000–2000 | 20 (35) | 8 (28) | 12 (43) | |
| 2000–3000 | 25 (44) | 14 (48) | 11 (39) | |
| +3000 | 5 (9) | 2 (7) | 3 (11) | |
| Cytoreduction | 0.172† | |||
| CC-0 | 49 (86) | 25 (86) | 24 (86) | |
| CC-1 | 4 (7) | 3 (10) | 1 (4) | |
| CC-2 | 3 (5) | 0 (0) | 3 (11) | |
| CC-3 | 1 (2) | 1 (3) | 0 (0) | |
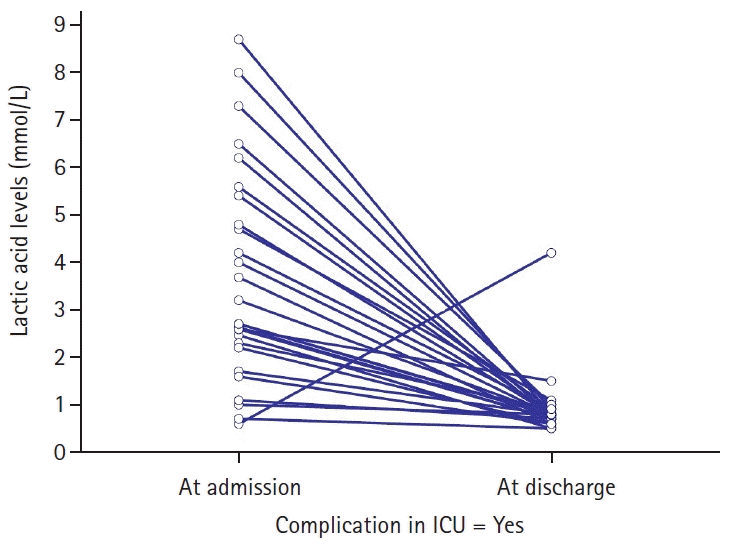
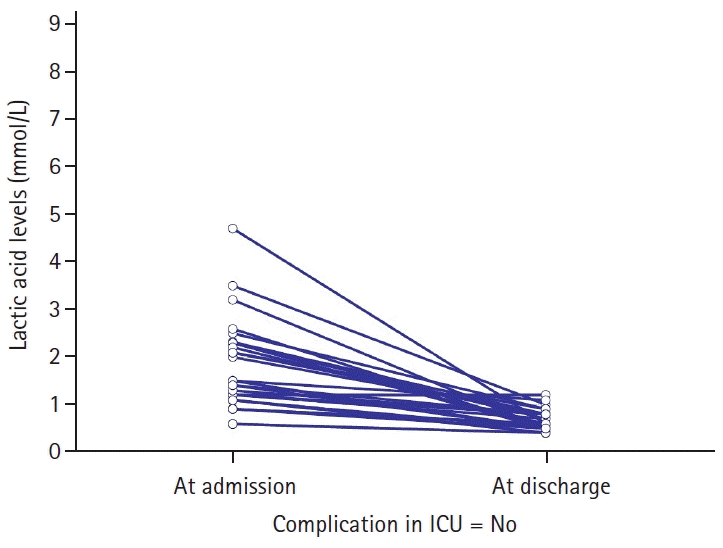
| Lactic acid level at ICU admission (mmol/L) | 2.3 (1.2, 3.2) | 1.4 (1.1, 2.3) | 2.7 (2.25, 5.1) | < 0.001* |
| Lactic acid level at ICU discharge (mmol/L) | 0.8 (0.6, 0.8) | 0.6 (0.5, 0.8) | 0.8 (0.7, 0.9) | 0.020* |
| Noradrenaline (μg/kg/min) | 0.3 (0.15, 0.6) | 0.2 (0.1, 0.4) | 0.3 (0.28, 0.8) | 0.021* |
| Clavien-Dindo | 0.002† | |||
| No complication | 11 (19) | 10 (35) | 1 (4) | |
| Grade I | 2 (4) | 0 (0) | 2 (7) | |
| Grade II | 19 (33) | 11 (38) | 8 (29) | |
| Grade III | 19 (33) | 8 (27) | 11 (39) | |
| Grade IV | 2 (4) | 0 (0) | 2 (7) | |
| Grade V (death) | 4 (7) | 0 (0) | 4 (14) | |
| Complications in ward | 31 (54) | 18 (62) | 13 (46) | 0.240† |
| Accumulated complications by patient (ICU + ward) | 1 (0, 2) | 1 (0, 2) | 1 (0, 2) | 0.599* |
| Death in ICU | 4 (7) | 4 (14) | 0.035 | |
| Death in ward | 0 (0) | 0 (0) | 0.99 | |
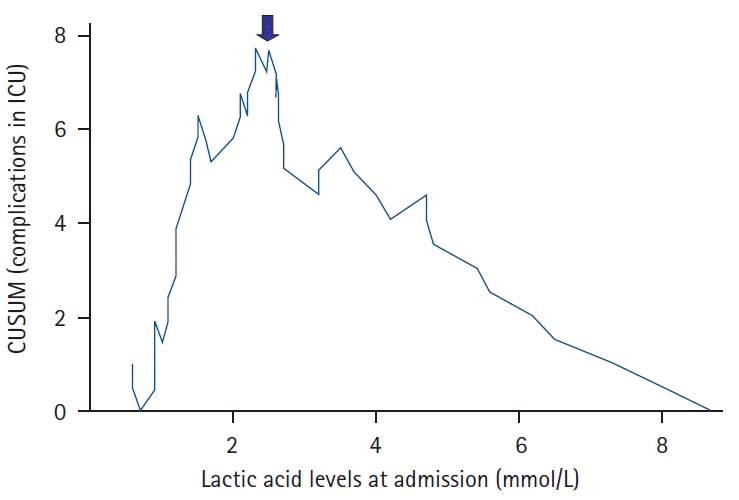
 | Fig. 3.Cumulative sum curve (CUSUM) for complications. The arrow points to the most discriminating cutoff point of lactic acid level with respect to the presence of complications from each value of lactic acid level. ICU: intensive care unit. |
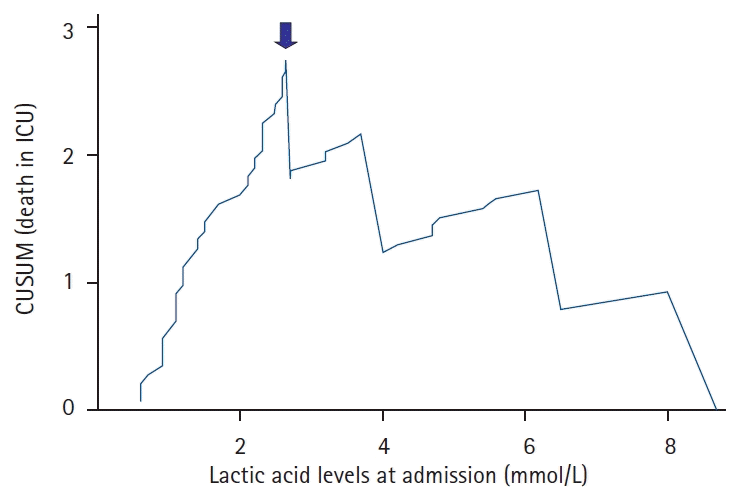
 | Fig. 4.Cumulative sum curve (CUSUM) for death. The arrow points to the most discriminating cutoff point of lactic acid level with respect to death from each value of lactic acid level. ICU: intensive care unit. |
Table 4.
Table 5.
Values are presented as mean ± SD or frequency (%). CPI: carcinomatosis peritoneal index [11].


 PDF
PDF Citation
 Print
Print


 XML Download