Introduction
Materials and Methods
Statistical analysis
Results
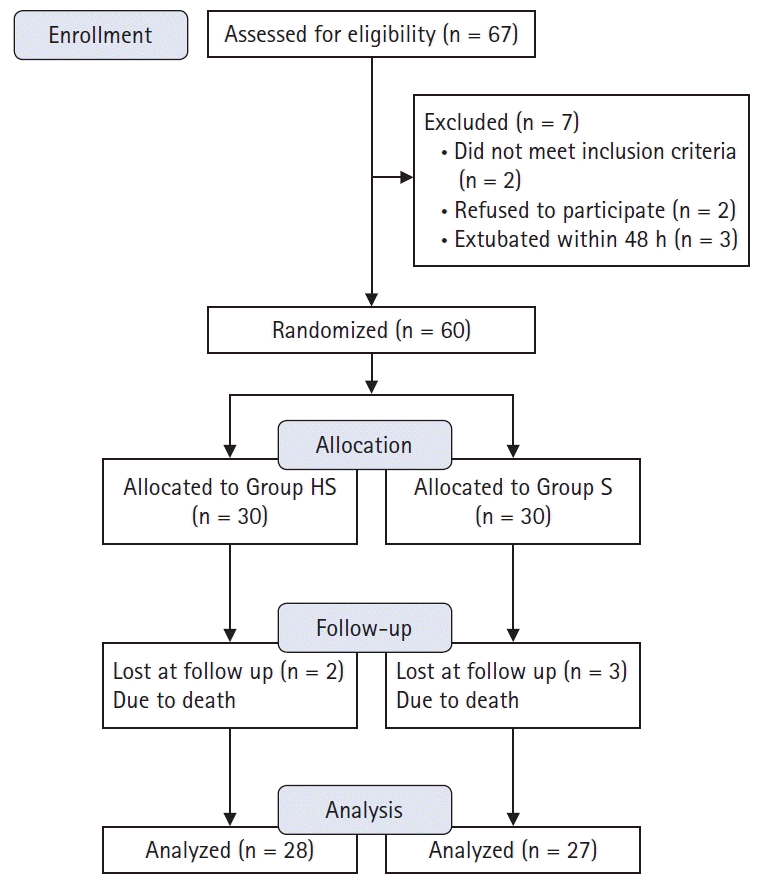
 | Fig. 1.CONSORT flow diagram. Group HS: heparin and salbutamol group, Group S: salbutamol only group. |
Table 1.
Values are presented as mean ± SD or a frequency as appropriate. Group HS: heparin and salbutamol group, Group S: salbutamol only group.
BMI: body mass index, Hb: hemoglobin, PLT: platelet count, APTT: activated partial thromboplastin time, FEV1: forced expiratory volume in first second % of predicted, FEV1/FVC: ratio between forced expiratory volume in first second and forced vital capacity, SO2: arterial oxygen saturation, PaCO2: partial pressure of CO2 in arterial blood, PaO2: partial pressure of O2 in arterial blood, pH: decimal logarithm of the reciprocal of the hydrogen ion activity, COPD: chronic obstructive pulmonary disease. All spirometry values were taken when the patient first presented in the emergency room.
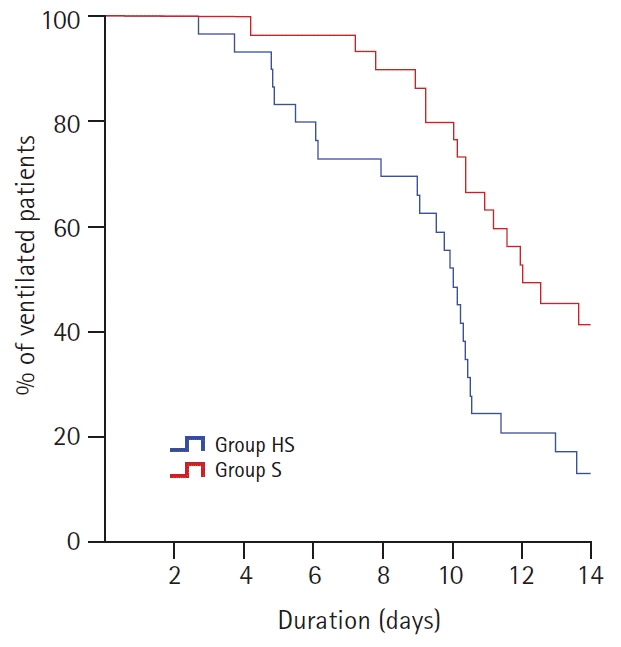
 | Fig. 2.The survival curve showed that the percentage of ventilated patients in the Group HS was lower than the Group S during the 14 days (P = 0.009). Group HS: heparin and salbutamol group, Group S: salbutamol only group. |
 | Fig. 3.(A) PaCO2 levels showed no evidence of difference in both groups (P = 0.075). (B) PaO2/FiO2 ratios (P = 0.069) showed no evidence of difference between groups. Group HS: heparin and salbutamol group, Group S: salbutamol only group. |
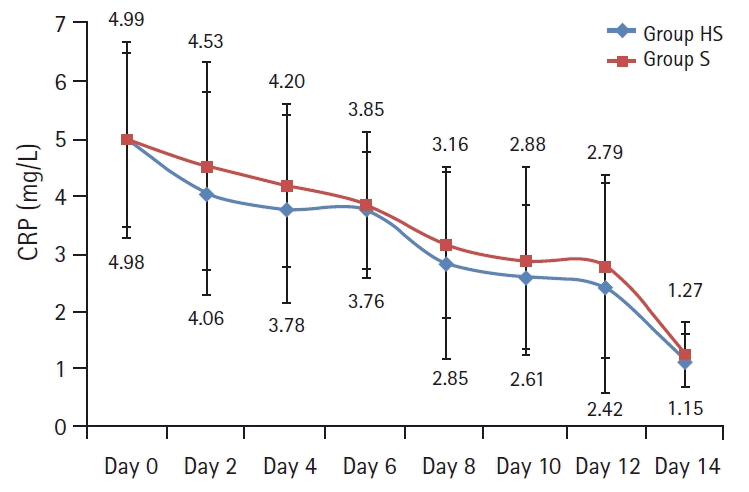
 | Fig. 4.Rate of decrease of the CRP levels in both groups showed no evidence of difference and is presented by a line graph with error bars. An RMANOVA was used for the analysis; Group effect (P = 0.185). Group HS: heparin and salbutamol group, Group S: salbutamol only group. CRP: C-reactive protein, RMANOVA: repeated-measures analysis of variance. |
Table 2.
| Group HS (n = 28) | Group S (n = 27) | P value | |
|---|---|---|---|
| Ventilator free days | 4.7 ± 3.3 | 2.4 ± 2.6 | 0.007* |
| Number of doses of nebulization withheld/patient | 5.8 ± 2.2 | 4.8 ± 1.4 | 0.064 |
| Blood transfusion | 9 | 7 | 0.612 |
| APTT Max (s) | 39.5 ± 2.5 | 39.1 ± 1.0 | 0.407 |
| APTT elevation (s) | 0.9 ± 1.8 | 0.2 ± 0.9 | 0.053 |
| APTT Max ≥ 40.0 (s) | 13 | 9 | 0.322 |
| Double APTT | 0 | 0 | -- |
| HIT | 0 | 0 | -- |
| Death | 2 | 3 | 0.669 |
Discussion
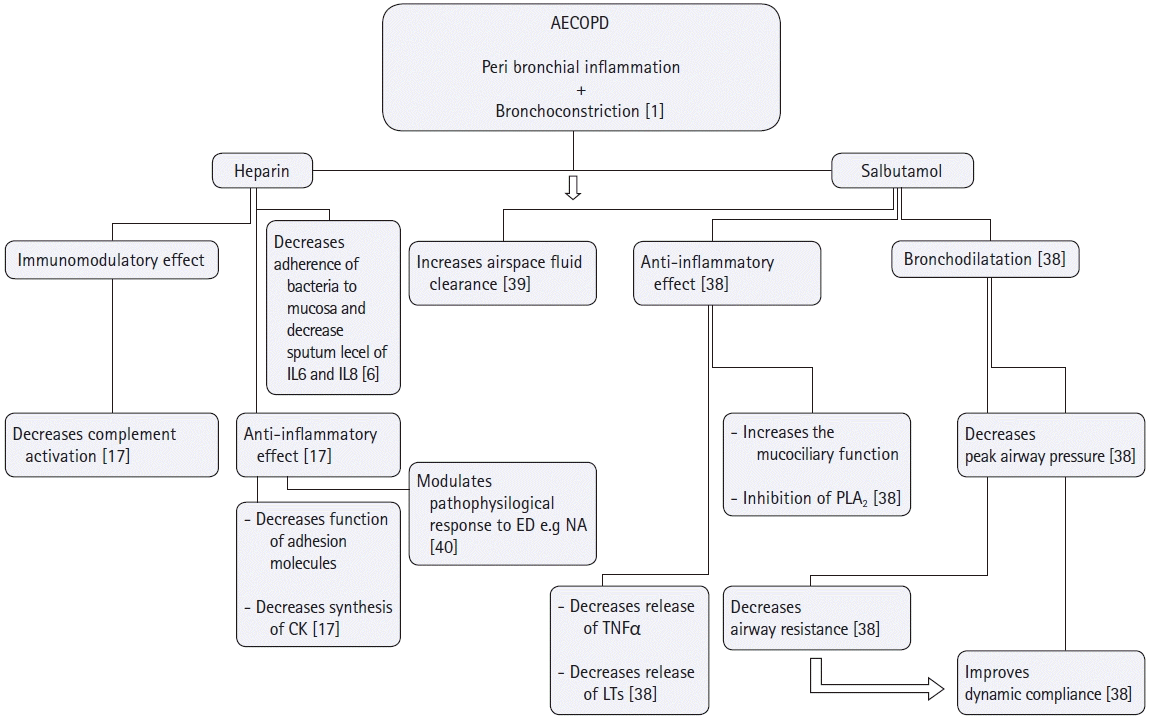
 | Fig. 5.Possible roles of heparin and salbutamol nebulization in targeting the pathophysiology of AECOPD. Main targets of heparin and salbutamol in the management of AECOPD are to hit its two pathological components; peribronchial inflammation and bronchoconstriction. As for heparin, it prevents the adhesion of Pseudomonas aeruginosa, Burkholderia cepacia, Burkholderia pseudomalleior Legionella pneumophilato bronchial mucosa and decrease sputum levels of IL-6 and IL-8 confirming its anti-inflammatory action. Heparin's anti-inflammatory effect is exerted also by other mechanisms; i) Heparin preparations have been shown to inhibit chemokine synthesis, as well as chemokine function (a cytokine that regulates the extravasations of cells from blood stream to tissues), ii) Heparin inhibits adhesion molecules (which with cytokines are essential for the extravasations of neutrophils to tissues), iii) Animal studies highlighted the effect of low molecular weight heparin on the modulation of pathophysiologic response to endotoxins by decreasing neutrophils adhesion, solubilization of TNF-α receptors and regulation of thromoboxane A2 biosynthesis. Salbutamol on the other hand through its bronchodilator effect improves dynamic compliance secondary to the decrease of peak airway pressure, it also possesses a unique anti-inflammatory effect by inhibiting the mast cell release to histamine and its inhibitory effect on phospholipase A2 subsequently decreasing the microvascular permeability and enhancing the air space fluid clearance. AECOPD: acute exacerbation chronic obstructive pulmonary disease, IL-6: Interleukin 6, IL-8: Interleukin 8, CK: cytokines, ED: endotoxins, NA: neutrophil aggregation, TNFα: tissue necrosis factor α, LTs: Leukotrienes, PLA2: Phospholipase A2. |


 PDF
PDF Citation
 Print
Print


 XML Download