Introduction
Materials and Methods
Sample size selection and statistical analyses
Results
Table 1.
| Variable | Median [IQR] | Kendall’s τb† | Two-sided P value‡ |
|---|---|---|---|
| Male | 0 [0, 1] | –0.19 | 0.34 |
| Age | 72 [68, 76] | 0.16 | 0.99 |
| Duration of surgery | 16 [13, 27] | –0.13 | 0.49 |
| Minutes in recovery room | 18 [14, 23] | –0.14 | 0.46 |
| Days from July 1, 2018 | 44 [32, 86] | –0.30 | 0.13 |
| Duration of phone call (min) | 3 [3, 4] | 0.27 | 0.19 |
| Fentanyl (μg) | 25 [25, 50] | –0.50 | 0.024 |
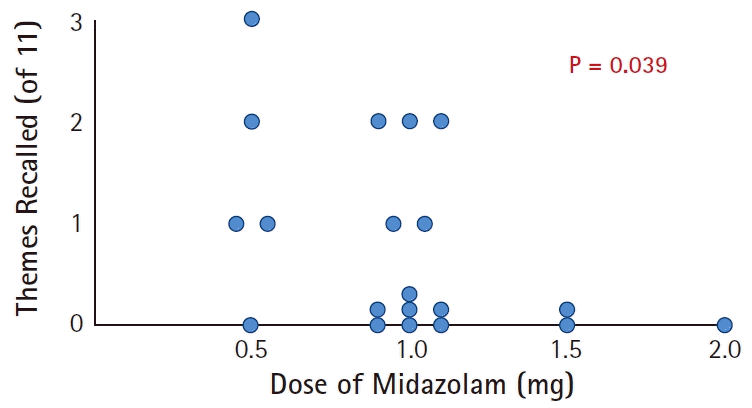
| Midazolam (mg) | 1.0 [0.75, 1.0] | –0.43 | 0.039 |
| ISAS score | 2.91 [2.05, 2.91] | 0.12 | 0.56 |
| ‘I felt pain’ | 3 [–1, 3] | 0.07 | 0.75 |
| ‘I felt pain during surgery’ | 3 [–1, 3] | 0.10 | 0.66 |
| ‘I was too cold or too hot’ | 3 [3, 3] | –0.39 | 0.10 |
| Fentanyl to ISAS started (min) | 32 [28, 34] | 0.17 | 0.38 |
| Midazolam to ISAS started (min) | 32 [29, 34] | 0.11 | 0.56 |
| Midazolam to phone call (h) | 24.4 [21.8, 26.0] | –0.08 | 0.67 |
* ISAS: Iowa Satisfaction with Anesthesia Scale, with the overall score and its components each ranging from –3 (agree strongly) to +3 (disagree strongly).
† The Kendall’s τb were calculated between the numbers in the first column and the number of themes among the 11 Iowa Satisfaction with Anesthesia Scale items potentially recalled. The n = 20 patients for all rows. Fig. 1, the abstract, and the Results include the findings from the 8th row. Specifically, ‘patients who received less midazolam recalled more themes (Kendall’s τb = 0.43, P = 0.039).’ All P values are two-sided and exact (StatXact-11). The latter is important because there were few different categories of numbers of themes recalled: 0, 1, 2, or 3 (see Results). In addition, in the first row, there are only two values of the potential predictor being tested.
 | Fig. 1.Observed relationship among the 20 patients between the dose of midazolam and the number of the 11 themes recalled in the Iowa Satisfaction with Anesthesia Scale. The midazolam was administered a median of 32 min (25th percentile 29 min, 75th percentile 34 min) before the questions were asked. The patients were asked to recall the items in the scale during the phone call made the next morning. We treated any response related to the theme of the item to be recall. |


 PDF
PDF Citation
 Print
Print


 XML Download