

 PDF
PDF Citation
 Print
Print


Introduction
Neutrophils are the first cells to join the immune defense system of the body to protect against invading pathogens [1]. Under non-infectious conditions, neutrophils are functionally quiescent with short lifespans of 6–12 h, and the number of neutrophils is kept constant through apoptosis. When neutrophils become activated under infectious conditions, the functionality of neutrophils markedly increases with prolonged survival. This process is advantageous in most infectious conditions. However, massive and uncontrolled secretion of pro-inflammatory cytokines may cause host tissue injury in an excessive inflammatory condition, such as severe sepsis [2].
The melanocortin 1 receptor (MC1R) is a G protein-coupled receptor involved in normal pigmentation of skin and hair. MC1Rs are primarily located on the surface of melanocytes, which produce a pigment called melanin. MC1Rs have been also detected on various immune cells other than melanocyte, including neutrophils, monocytes, and dendritic cells [3–5]. Although the active functions of MC1R in immune cells, especially for neutrophils, have not been previously elucidated in detail, including the signaling pathway and impact on cell survival, some preclinical investigations indicate activation of MC1R could be a new strategy to control inflammatory disorders with a collective reduction of the major molecules involved in the inflammatory process. Therefore, a selective agonist of MC1R has emerged as a promising candidate for down-regulating the excessive inflammatory condition, and the development of the ideal drug with receptor selectivity according to the intended indication has been desired.
The compound BMS-470539 is a recently synthesized small-molecule agonist of human and murine MC1R, and a few studies have assessed the roles of this compound until now. BMS-470539 is highly selective to MC1R, with weak or no activity at other subtypes of melanocortin receptors [6]. In addition to selectivity, BMS-470539 has favorable pharmacokinetic properties, with a prolonged half-life relative to the nonselective melanocortin, Nle4-D-Phe7-MSH (1.7 h vs. 20 min) [7]. BMS-470539 was reported to inhibit pro-inflammatory cytokine accumulation and leukocyte infiltration and adhesion in mice [8,9]. Through these in vivo studies, however, it is not clear which cells are directly involved in mediating the anti-inflammatory action of BMS-470539.
The purpose of the present study was to investigate the anti-inflammatory effect of BMS-470539 on lipopolysaccharide (LPS)-stimulated human neutrophils with its intracellular signaling pathway, and to investigate whether BMS-470539 modulates apoptosis of LPS-stimulated human neutrophils.
Go to : 
Materials and Methods
For isolation of neutrophils, the peripheral blood of healthy volunteers was used under a protocol approved by the Chonnam National University Hospital Institutional Review Board (IRB no. CNUH-2012-048) and written informed consent was obtained from all volunteers. Dextran (6%) was added and erythrocytes were sedimented under gravity for 45 min at room temperature. Then leukocyte-enriched pellets were collected by centrifugation at 1,100 rpm for 6 min and re-suspended in platelet-poor plasma. Next, leukocyte-enriched plasma was centrifuged with a Percoll gradient (3 ml, 42–51%) at 1,100 rpm for 20 min. Neutrophils were found at the 42–51% Percoll layer interface. Red blood cells (RBC) were removed by RBC Lysis Buffer, and neutrophils were collected by centrifugation at 3,000 rpm for 5 min. Finally, neutrophils were re-suspended in RPMI 1640 with 10% Fetal bovine serum and 1% streptomycin and penicillin (Mediatech, USA).
For the measurement of pro-inflammatory cytokines, isolated human neutrophils were cultured with or without 055:B5 Escherichia coli LPS (100 ng/ml) in 24-well plates, and they were treated with BMS-470539 (1, 10, and 100 µM). The levels of tumor necrosis factor alpha (TNF-α), interkleukin (IL)-6, and IL-1β in neutrophils were measured using enzyme-linked immunosorbent assay (ELISA) kits (R & D Systems, USA), according to the manufacturer’s instructions.
Phosphorylation of mitogen-activated protein kinases (MAPKs) was determined as follows: neutrophils (5 x 10⁶/ml) were incubated for 30 min with or without LPS (100 ng/ml) in 24-well plates, and they were treated with BMS-470539 (100 µM). Intracellular levels of phosphorylated p38 MAPK, extracellular signal-regulated kinases 1/2 (ERK1/2) and c-Jun N-terminal kinase (JNK) were measured in cultured neutrophils using SimpleStep ELISA Kit (Abcam, UK), according to manufacturer’s instructions. Separately, nuclear levels of nuclear factor kappa B (NF-κB) were measured with the same protocol described above.
Neutrophil apoptosis was evaluated with fluorescein isothiocyanate annexin V/propidium iodide (FITC-annexin V/PI) according to the manufacturer’s instructions (BD Biosciences, USA), with minor changes. Neutrophils were cultured with or without LPS (100 ng/ml), and treated with BMS-470539 (100 µM) for 24 h at 37°C. They were washed with PBS and centrifuged twice at 3,000 rpm for 5 min, after which the cells were incubated with 300 µl binding buffer containing annexin V/PI for 15–20 min, followed by flow cytometry within 1 h after annexin V/PI labeling. Neutrophils undergoing apoptosis were determined by positive FITC-annexin V staining and negative PI staining.
Data are expressed as the mean ± SD for each group and analyzed by one-way analysis of variance followed by Tukey-Kramer multiple comparisons test or Student’s t-test using SPSS version 21. Statistical significance was defined as P < 0.050.
Go to :
Results
Effects of BMS-470539 on the secretion of pro-inflammatory cytokines by LPS-stimulated neutrophils
There was a marked increase in the production of TNF-α, IL-6, and IL-1β when stimulated with LPS (Fig. 1). Compared to LPS-stimulation alone, treatment with BMS-470539 in LPS-stimulated neutrophils was associated with a significant reduction of TNF-α production at concentrations of 1 µM (ΔTNF-α = -388.9 [95% CI: -494.3, -283.5], P < 0.001), 10 µM (ΔTNF-α = -338.2 [-443.7, -232.8], P < 0.001), and 100 µM (ΔTNF-α = -436.2 [-541.6, -330.7], P < 0.001). In the same condition above, treatment with BMS-470539 was associated with a significant reduction of IL-6 production at concentrations of 1 µM (ΔIL-6 = -383.8 [-572.8, -194.7], P < 0.001), 10 µM (ΔIL-6 = -287.4 [-476.4, -98.3], P = 0.003), and 100 µM (ΔIL-6 = -254.8 [-443.8, -65.8], P = 0.008). Likewise, treatment with BMS-470539 was associated with a significant reduction of IL-1β production at concentrations of 10 µM (ΔIL-1β = -94.6 [-158.0, -31.1], P = 0.002) and 100 µM (ΔIL-1β = -90.6 [-154.1, -27.1], P = 0.004), but not at concentrations of 1 µM (ΔIL-1β = -45.9 [-109.3, 17.6], P = 0.213). BMS-470539 alone did not increase the production of TNF-α, IL-6, and IL-1β in human neutrophils over the range of concentrations examined.
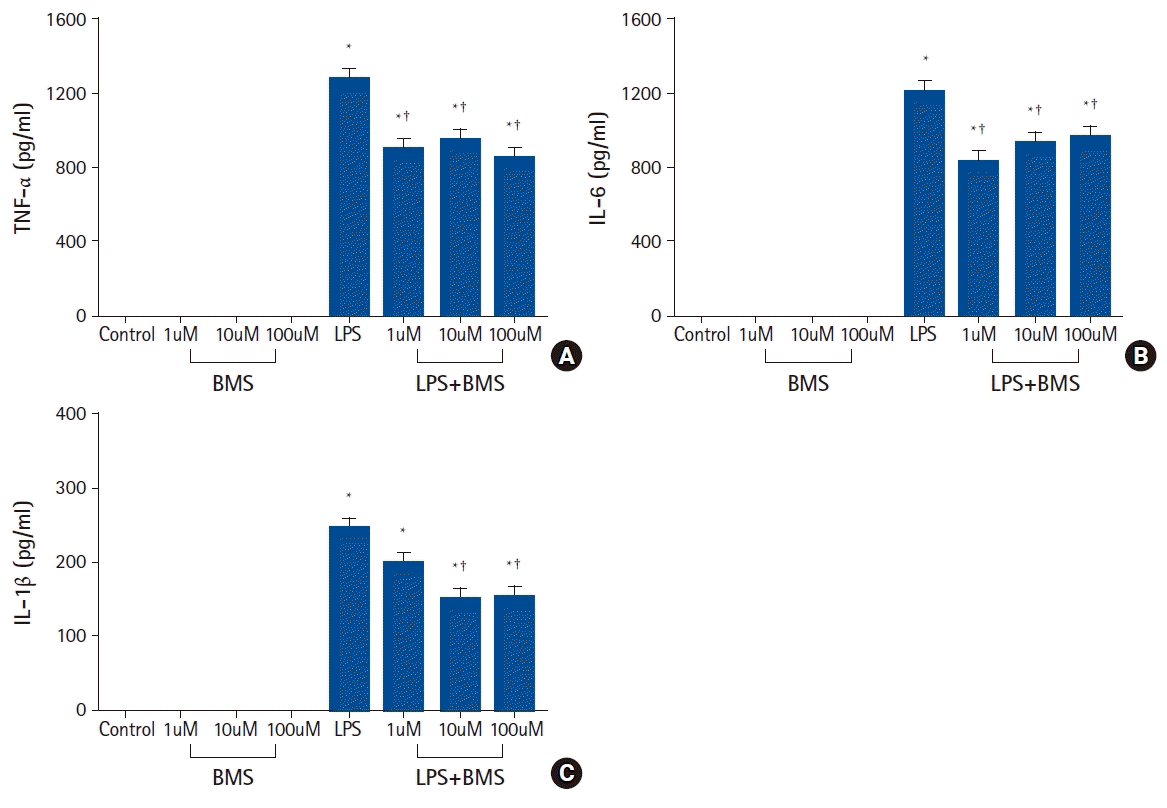 | Fig. 1.The effects of BMS-470539 on pro-inflammatory cytokine (TNF-α, IL-6, and IL-1β) production in human neutrophil stimulated by lipopolysaccharide (LPS).
Neutrophils (5 × 10⁶/ml) from human blood were incubated for 4 h without or with BMS-470539 (1 µM, 10 µM, and 100 µM), or with LPS (100 ng/ml) or LPS plus BMS-470539 (Control, BMS, LPS, LPS + BMS, respectively). The level of cytokine (A) TNF-α, (B) IL-6, and (C) IL-1β were obtained from ELISA. Values are presented as mean ± SD (n = 6 per group). *P < 0.05 versus control, †P < 0.05 versus LPS.
|
Effects of BMS-470539 on the MAPKs and NF-κB activation in LPS-stimulated neutrophils
There was a significant increase in the expression of phosphorylated p38, ERK1/2, and JNK in LPS-stimulated neutrophils when compared to control neutrophils (Δp38 = 0.208 [0.111, 0.304], P < 0.001; ΔERK1/2 = 0.215 [0.146, 0.284], P < 0.001; ΔJNK = 0.630 [0.510, 0.750], P < 0.001) (Fig. 2). Compared to LPS-stimulation alone, treatment with BMS-470539 (100 µM) was associated with a significant reduction of phosphorylated p38, ERK1/2, and JNK (Δp38 = -0.110 [-0.207, -0.013], P = 0.025; ΔERK1/2 = -0.075 [-0.144, -0.006], P = 0.031; ΔJNK = -0.285 [-0.405, -0.165], P < 0.001).
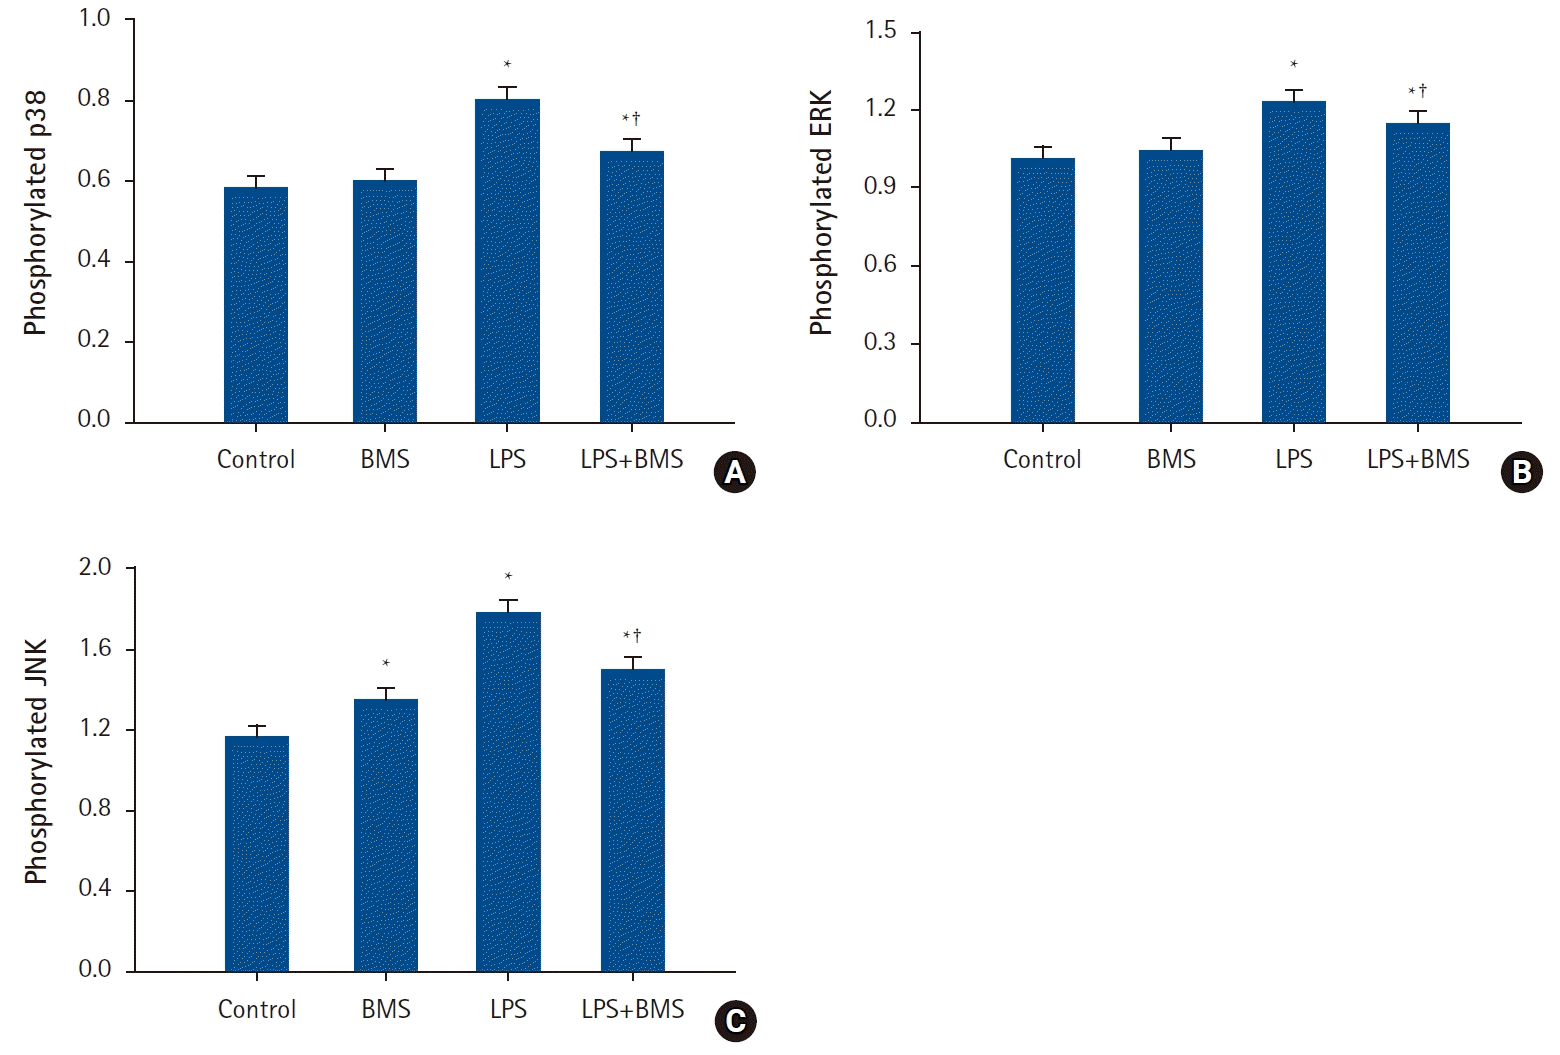 | Fig. 2.The effects of BMS-470539 on mitogen-activated protein kinases activation in human neutrophil stimulated by lipopolysaccharide (LPS).
Neutrophils (5 × 10⁶/ml) from human blood were incubated for 30 min without or with BMS-470539 (100 µM), or with LPS (100 ng/ml) or LPS plus BMS-470539 (Control, BMS, LPS, LPS + BMS, respectively). The phosphorylation levels of (A) p38, (B) ERK, and (C) JNK were measured by ELISA. Values are presented as mean ± SD (n = 4 per group). *P < 0.05 versus Control, †P < 0.05 versus LPS.
|
Similarly, there was a significant increase in the nuclear translocation of NF-κB in LPS-stimulated neutrophils when compared to control neutrophils (ΔNF-κB = 0.563 [0.390, 0.735], P < 0.001) (Fig. 3). Compared to LPS-stimulation alone, treatment with BMS-470539 (100 µM) was associated with a significant reduction of the nuclear translocation of NF-κB (ΔNF-κB = -0.278 [-0.450, -0.105], P = 0.002).
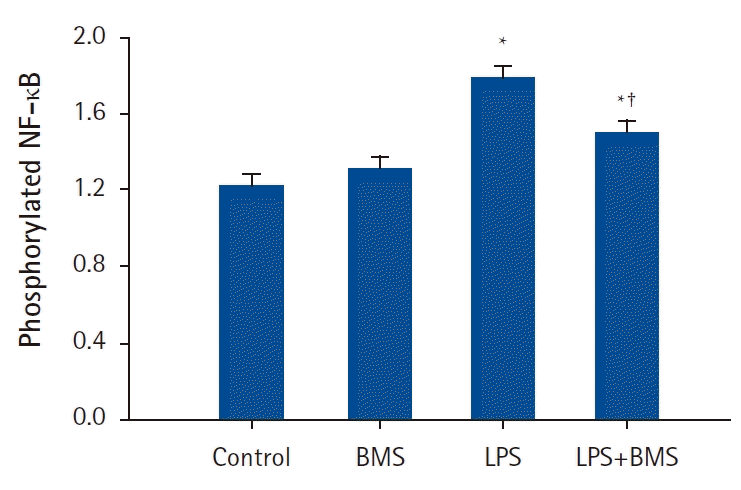 | Fig. 3.The effects of BMS-470539 on nuclear translocation of nuclear factor kappa B (NF-κB) in human neutrophils stimulated by lipopolysaccharide (LPS).
Neutrophils (5 × 10⁶/ml) from human blood were incubated for 30 min without or with BMS-470539 (100 µM), or with LPS (100 ng/ml) or LPS plus BMS-470539 (Control, BMS, LPS, LPS + BMS, respectively). The phosphorylation level of NF-κB was measured by ELISA. Values are presented as mean ± SD (n = 4 per group). *P < 0.05 versus with Control, †P < 0.05 versus LPS.
|
Effect of BMS-470539 on LPS-delayed neutrophil apoptosis
Fig. 4A shows typical diagrams of FITC-annexin V/PI flow cytometry obtained after LPS, BMS-470539, or LPS plus BMS-470539 exposure, and the percentage of neutrophil apoptosis was measured by positive FITC-annexin V staining and negative PI staining (Fig. 4B). LPS stimulation inhibited neutrophil apoptosis compared to the controls (Δapoptosis = -19.38 [-23.13, -15.64], P < 0.001) (Fig. 4B). Compared to LPS-stimulation alone, BMS-470539 treatment significantly reversed LPS-induced inhibition of neutrophil apoptosis (Δapoptosis = 8.56 [4.81, 12.30], P < 0.001). BMS-470539 alone did not affect neutrophil apoptosis.
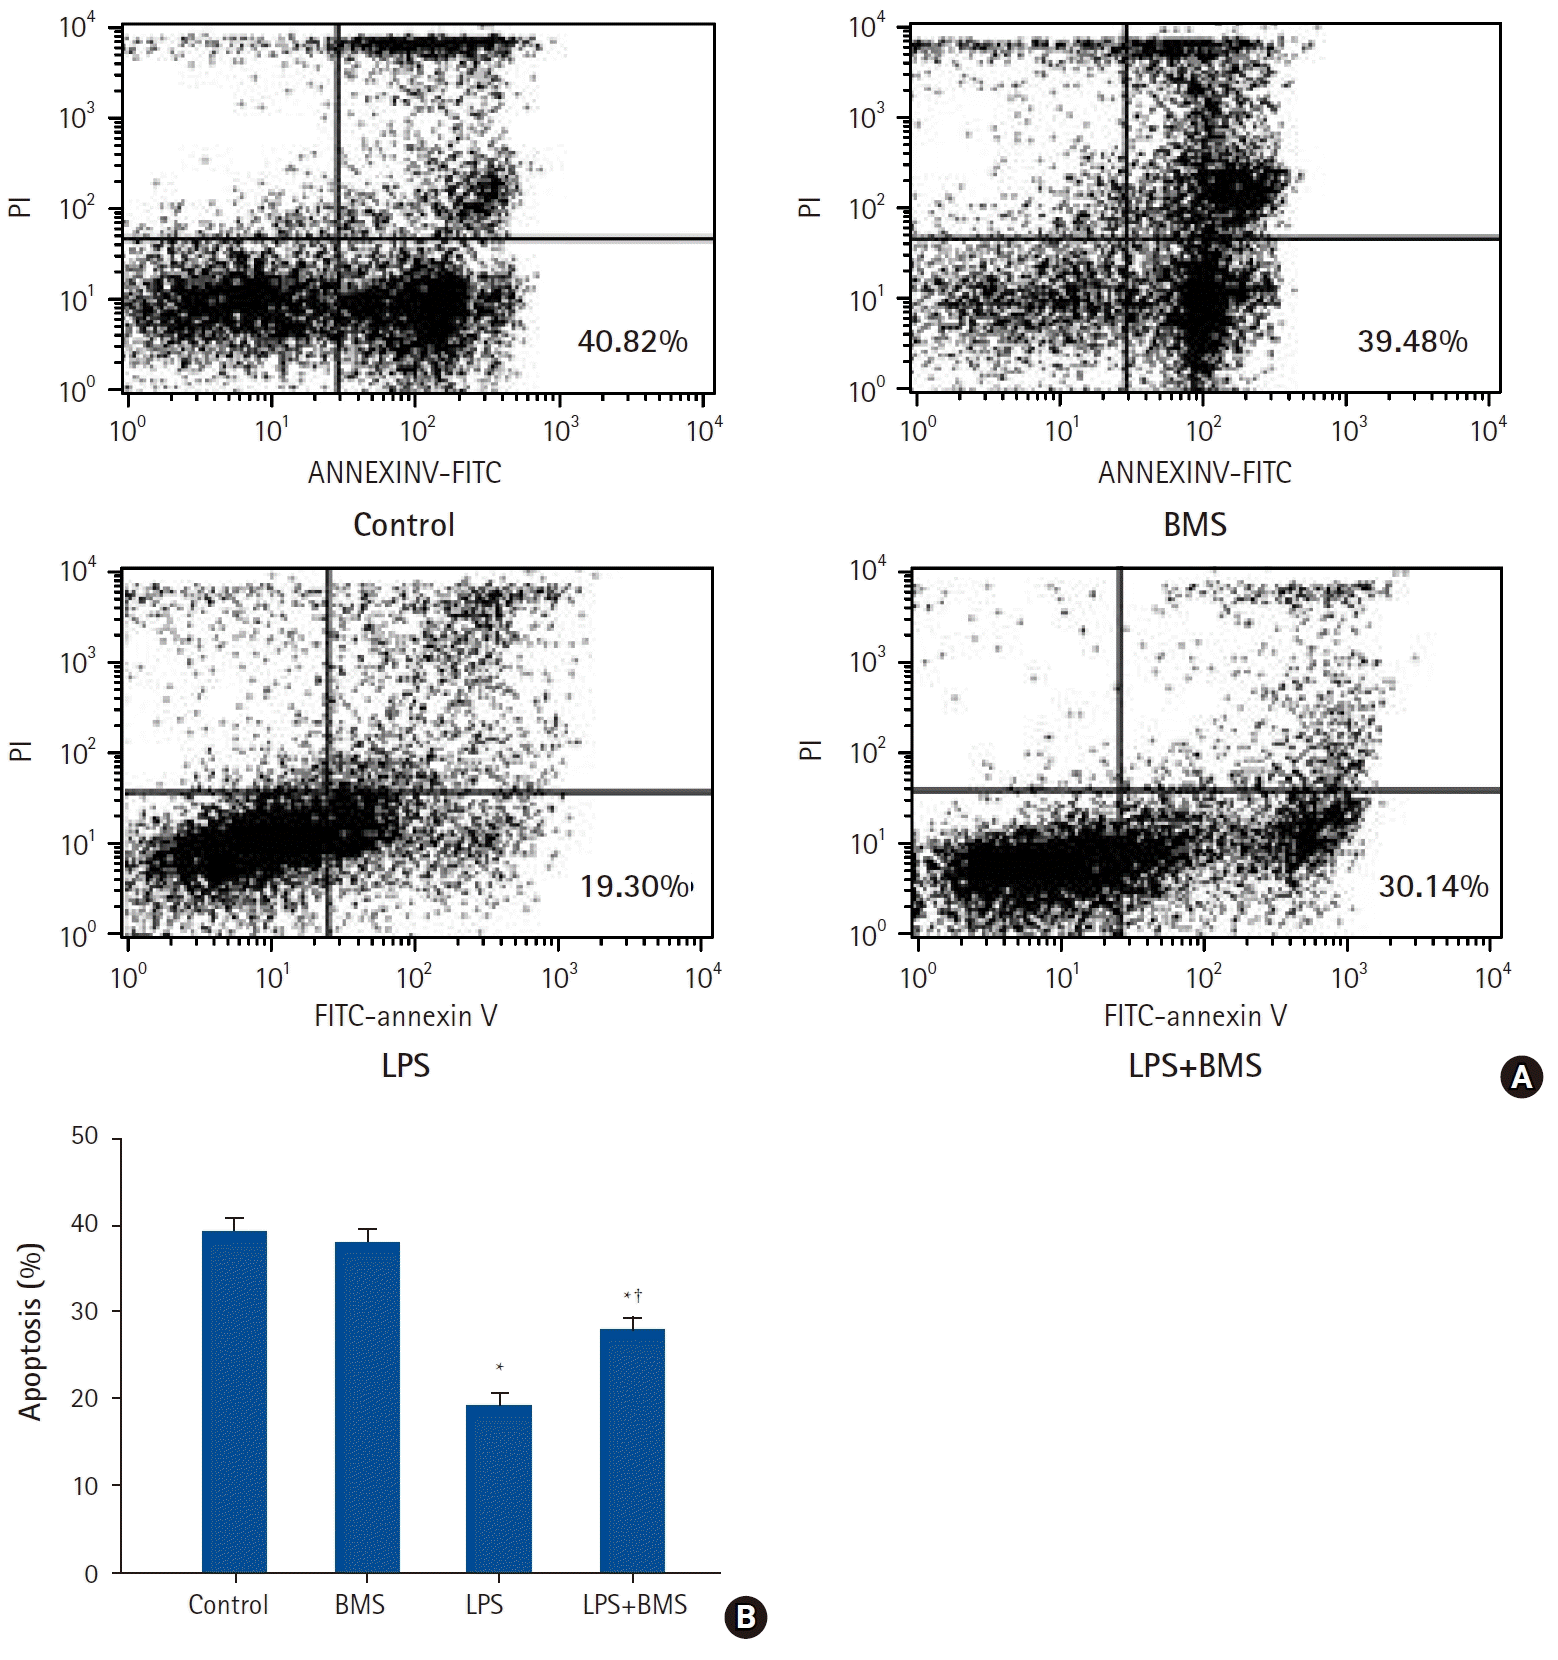 | Fig. 4.The effects of BMS-470539 on apoptosis of human neutrophils stimulated by lipopolysaccharide (LPS).
Neutrophils (5 × 10⁶/ml) from human blood were incubated for 24 h without or with BMS-470539 (100 µM), or with LPS (100 ng/ml) or LPS plus BMS-470539 (Control, BMS, LPS, LPS + BMS, respectively). (A) Contour diagram of fluorescein isothiocyanate annexin V/propidium iodide (FITC-annexin V/PI) flow cytometry of neutrophils for different groups. The lower right quadrants represent the apoptotic cells, FITC-annexin V positive and PI negative. One representative experiment out of six is shown. (B) The percentage of neutrophil apoptosis was determined for each group. Data are shown as mean ± SD (n = 6 per group). *P < 0.05 versus Control, †P < 0.05 versus LPS.
|
Go to :
Discussion
In the present study, BMS-470539 reduced LPS-induced production of pro-inflammatory cytokines in human neutrophils, and attenuated phosphorylation of signaling molecules including MAPKs and NF-κB. BMS-470539 also inhibited LPS-delayed neutrophil apoptosis. These results demonstrate that BMS-470539, the first small-molecule MC1R selective agonist, may provide anti-inflammatory and immunomodulatory effects on human neutrophils in an excessive inflammatory condition.
Melanocortin peptides have been shown to be immunoprotective in various acute and chronic models of inflammation [10]. Especially, the anti-inflammatory actions of α-melanocyte-stimulating hormone (α-MSH), an endogenous melanocortin peptide, have been widely studied. α-MSH shows high affinity for MC1R, and many of the anti-inflammatory activities of α-MSH are thought to be related with MC1R among five distinct subtypes of melanocortin receptors (MC1R, MC2R, MC3R, MC4R, and MC5R). However, the anti-inflammatory roles of MC1R have been less evident because of the lack of selective ligands for in vivo studies until the discovery of BMS-470539 [7].
Patruno et al. [11] demonstrated that BMS-470539 reduced LPS-induced release of IL-6, IL-10, IL-8, and CCL-2 in macrophages in a dose-dependent manner up to 50 μM. In the present study, BMS-470539 also reduced the release of TNF-α and IL-6 (at 1 μM, 10 μM, and 100 μM), and IL-1β (at 10 μM and 100 μM) in human neutrophils. These results are consistent with previous studies showing that nonselective melanocortin peptides have demonstrated a reduction in TNF-α, IL-6, and IL-1α [12,13]. However, the inhibitory effects of BMS-470539 on the production of TNF-α and IL-6 appeared not to be dose-dependent within the 1–100 μM range tested in the present study (‘possible ceiling effect’), while the production of IL-1β was not significantly reduced at 1 μM of BMS-470539. This result suggests that the optimal dosage of BMS-470539 to inhibit the production of anti-inflammatory cytokines is seemingly different for each cytokine. Furthermore, Kang et al. [8] reported that BMS-470539 (15 μmol/kg) was effective in reducing LPS-induced TNF-α levels but not the levels of IL-1β, IL-6, and IL-10 in mice. Therefore, further in vitro and in vivo studies with various doses will be required to determine the effects of BMS-470539 on the production of pro-inflammatory cytokines.
LPS treatment promotes NF-κB activation and the synthesis of pro-inflammatory cytokines [14]. Several studies have suggested that α-MSH reduces the expression of pro-inflammatory cytokines by inhibiting NF-κB activation [15,16]. Consistent with this melanocortin-induced effect, BMS-470539 inhibited activation of a NF-B-luciferase reporter and nuclear translocation of NF-κB in TNF-α-induced human melanoma cell line [8]. However, the ability of BMS-470539 to inhibit activation of NF-κB in immune cells was not investigated before. In the present study, we have demonstrated that BMS-470539 inhibits nuclear translocation of NF-κB in human neutrophils treated with LPS. This ability of BMS-470539 seems to result in the blunting of the inflammatory response by decreased cytokine accumulation.
BMS-470539 also attenuated the LPS-induced phosphorylation of MAPKs including p38, ERK1/2, and JNK in human neutrophils in the present study. Neutrophil intracellular signal transduction appears to utilize the above three major MAPK cascades [17], which play critical roles in the generation of pro-inflammatory cytokines [18]. LPS is known to activate these MAPKs [19]. Cloudier et al. [20] demonstrated that the inhibition of MAPK pathways substantially attenuated the release of pro-inflammatory cytokines without cross-talk between the MAPK and NF-κB pathways. Therefore, MC1R activation may reduce LPS-induced pro-inflammatory cytokines by inhibition of MAPK pathways as well as NF-κB pathway in human neutrophils.
Neutrophil apoptosis is known to be inhibited by inflammatory cytokines or bacterial products such as LPS. Consistent with other studies, LPS reduced neutrophil apoptosis in the present study, and this reduction was attenuated by MC1R agonist BMS-470539. Reduced pro-inflammatory cytokines by BMS-470539 might be a reason of modulating neutrophil apoptosis. In addition, inhibitory effect of BMS-470539 on MAPKs activation might also be another possible mechanism. Nolan et al. [21] demonstrated the opposing roles of MAPKs in mediating neutrophil apoptosis after LPS stimulation. They showed that both ERK and p38 were activated by LPS; however, ERK signaling inhibited apoptosis while p38 signaling promoted apoptosis. In the present study, all ERK, p38, and JNK phosphorylations were activated by LPS, and attenuated by BMS-470539. Therefore, the precise mechanism of modulating neutrophil apoptosis by BMS-470539 could not be confirmed in the present study.
In conclusion, BMS-470539 can suppress the inflammatory responses of LPS-stimulated neutrophils by inhibition of MAPK pathways or NF-κB pathway, and it can also inhibit LPS-delayed neutrophil apoptosis. These results suggest the possibility of MC1R selective agonists as novel therapeutic agents in the future for modulating prolonged and excessive inflammatory conditions, such as severe sepsis.
Go to :
 XML Download