

 PDF
PDF Citation
 Print
Print


A data is said to follow a normal distribution when the values of the data are dispersed evenly around one representative value. A normal distribution is a prerequisite for a parametric statistical analysis [1]. The mean in a normally distributed data represents the central tendency of the values of the data. However, the mean alone is not sufficient when attempting to explain the shape of the distribution; therefore, many medical literatures employ the standard deviation (SD) and the standard error of the mean (SEM) along with the mean to report statistical analysis results [2].
The objective of this article is to state the differences with regard to the use of the SD and SEM, which are used in descriptive and statistical analysis of normally distributed data, and to propose a standard against which statistical analysis results in medial literatures can be evaluated.
Medical studies begin by establishing a hypothesis about a population and extracting a sample from the population to test the hypothesis. The extracted sample will take a normal distribution if the sampling process was conducted via an appropriate randomization method with a sufficient sample size. As with all normally distributed data, the characteristics of the sample are represented by the mean, variance or SD. The variance or SD includes the differences of the observed values from the mean (Fig. 1); thus, these values represent the variation of the data [1,2,3]. For instance, if the observed values are scattered closely around the mean value, the variance - as well as the SD - are reduced. However, the variance can confuse the interpretation of the data because it is computed by squaring the units of the observed values. Hence, the SD, which uses the same units used with the mean, is more appropriate [3] (Equations 1 and 2).
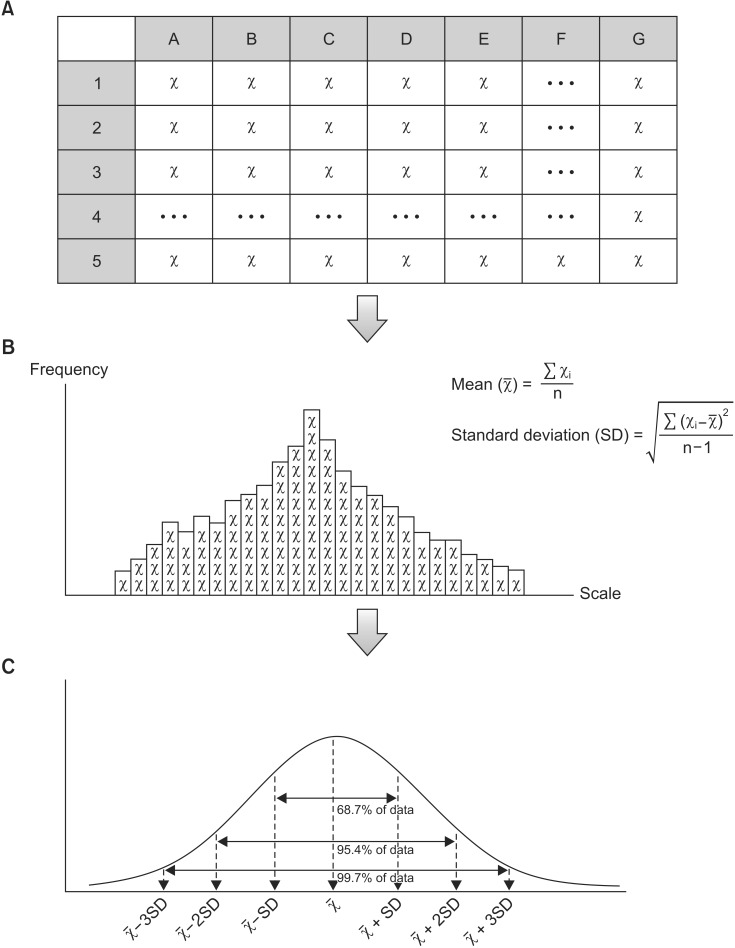 | Fig. 1Process of data description. First, we gather raw data from the population by means of randomization (A). We then arrange the each value according to the scale (frequency distribution); we can presume the shape of the distribution (probability distribution) and can calculate the mean and standard deviation (B). Using these mean and standard deviation, we produce a model of the normal distribution (C). This distribution represents the characteristics of the data we gathered and is the normal distribution, with which statistical inferences can be made (χ̅: mean, SD: standard deviation, χi: observation value, n: sample size).
|
As mentioned previously, using the SD concurrently with the mean can more accurately estimate the variation in a normally distributed data. In other words, a normally distributed statistical model can be achieved by examining the mean and the SD of the data [1] (Fig. 1, Equations 1 and 2). In such models, approximately 68.7% of the observed values are placed within one SD from the mean, approximately 95.4% of the observed values are arranged within two SDs from the mean, and about 99.7% of the observed values are positioned within three SDs from the mean [1,4]. For this reason, most medical literatures report their samples in the form of the mean and SD [5].
The sample as referred to in medical literature is a set of observed values from a population. An experiment must be conducted on the entire population to acquire a more accurate confirmation of a hypothesis, but it is essentially impossible to survey an entire population. As a result, an appropriate sampling process - a process of extracting a sample that represents the characteristics of a population - is essential to acquire reliable results. For this purpose, an appropriate sample size is determined during the research planning stage and the sampling is done via a randomization method. Nevertheless, the extracted sample is still a part of the population; thus, the sample mean is an estimated value of the population mean. When the samples of the same sample size are repeatedly and randomly taken from the same population, they are different each other because of sampling variation as well as sample means (Fig. 2, Level B). The distribution of different sample means, which is achieved via repeated sampling processes, is referred to as the sampling distribution and it takes a normal distribution pattern (Fig. 2, Level C) [1,6,7]. Therefore, the SD of the sampling distribution can be computed; this value is referred to as the SEM [1,6,7]. The SEM is dependent on the variation in the population and the number of the extracted samples. A large variation in the population causes a large difference in the sample means, ultimately resulting in a larger SEM. However, as more samples are extracted from the population, the sample means move closer to the population mean, which results in a smaller SEM. In short, the SEM is an indicator of how close the sample mean is to the population mean [7]. In reality, however, only one sample is extracted from the population. Therefore, the SEM is estimated using the SD and a sample size (Estimated SEM). The SEM computed by a statistical program is an estimated value calculated via this process [5] (Equation 3).
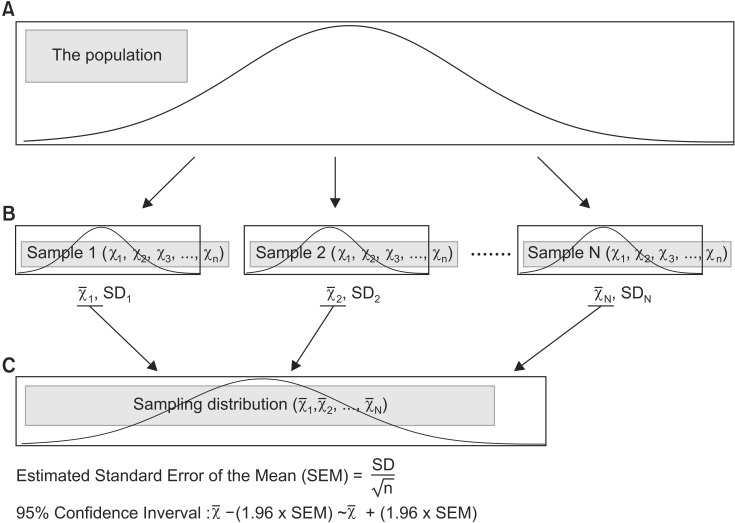 | Fig. 2Process of statistical inference. Level A indicates the population. In most experiments, we only obtain one set of sample data from the population using randomization (Level B); the mean and standard deviation are calculated from sample data we have. For statistical inference purposes, we assume that there are several sample data sets from the population (Level B); the means of each sample data set produce the sampling distribution (Level C). Using this sampling distribution, statistical analysis can be conducted. In this situation, the estimated standard error of the mean or the 95% confidence interval has an important role during the statistical analysis process (χ̅: mean, SD: standard deviation, n: sample size, N: number of sample data sets extracted from population).
|
A confidence interval is set to illustrate the population mean intuitively. A 95% confidence interval is the most common [3,7]. The SEM of a sampling distribution is estimated from one sample, and a confidence interval is determined from the SEM (Fig. 2, Level C). In the strict sense, the 95% confidence interval provides the information about a range within which the 95% sample means will fall, it is not a range for the population mean with 95% confidence. For example, a 95% confidence interval signifies that when 100 sample means are calculated from 100 samples from a population, 95 of them are included within the said confidence interval and 5 are placed outside of the confidence interval. In other words, it does not mean that there is a 95% probability that the population mean lies within the 95% confidence interval.
When statistically comparing data sets, researchers estimate the population of each sample and examine whether they are identical. The SEM - not the SD, which represents the variation in the sample - is used to estimate the population mean (Fig. 2) [4,8,9]. Via this process, researchers conclude that the sample used in their studies appropriately represents the population within the error range specified by the pre-set significance level [4,6,8].
The SEM is smaller than the SD, as the SEM is estimated usually the SD divided by the square root of the sample size (Equations 2 and 3). For this reason, researchers are tempted to use the SEM when describing their samples. It is acceptable to use either the SEM or SD to compare two different groups if the sample sizes of the two groups are equal; however, the sample size must be stated in order to deliver accurate information. For example, when a population has a large amount of variation, the SD of an extracted sample from this population must be large. However, the SEM will be small if the sample size is deliberately increased. In such cases, it would be easy to misinterpret the population from using the SEM in descriptive statistics. Such cases are common in medical research, because the variables in medical research impose many possible biases originated from inter- and intra-individual variations originated from underlying general conditions of the patients and so on. When interpreting the SD and SEM, however, the exact meaning and purposes of the SD and SEM should be considered to deliver correct information. [3,4,6,7,10].
We examined 36 clinical or experimental studies published in Volume 6, Numbers 1 through 6 of the Korean Journal of Anesthesiology and found that a few of the studies inappropriately used the SD and SEM. First, examining the descriptive statistics, we found that all of the studies used the mean and SD or the observed number and percentage. One study suggested a 95% confidence interval; this particular study appropriately stated the sample size along the confidence interval, offering a clearer understanding of the data suggested in the study [11]. Among the 36 studies examined, only one study described the results of a normality test [12]. Second, all 36 studies used the SD, the observed number or the percentage to describe their statistical results. One study did not specify what the values in the graphs and tables represent (i.e., the mean, SD or interquartile range). There was also a study that used the mean in the text but showed an interquartile range in the graphs. Sixteen studies used either the observed number or the percentage, and most of them reported their results without a confidence interval. Only two studies stated confidence intervals, but only one of those two studies appropriately used the confidence interval [13]. As shown above, we found that some of the studies have inappropriately used the SD, SEM and confidence intervals in reporting their statistical results. Such instances of the inappropriate use of statistics must be meticulously screened during manuscript reviews and evaluations because they may hamper an accurate comprehension of a study's data.
In conclusion, the SD reflects the variation in a normally distributed data, and the SEM represents the variation in the sample means of a sampling distribution. With this in mind, it is pertinent to use the SD (paired with a normality test) to describe the characteristics of a sample; however, the SEM or confidence interval can be used for the same purpose if the sample size is specified. The SEM, paired with the sample size, is more useful when reporting statistical results because it allows an intuitive comparison between the estimated populations via graphs or tables.
 XML Download