

 PDF
PDF Citation
 Print
Print


Introduction
Complex regional pain syndrome (CRPS) is a neuropathic pain disorder, characterized by spontaneous and stimulus-evoked pain in conjunction with sensory, autonomic, trophic, and motor abnormalities [1]. The precise pathophysiological mechanism(s) of CRPS remain(s) unclear. CRPS is induced by multiple factors, such as neurogenic inflammation, central and peripheral sensitization, maladaptive neuroplasticity, and genetic factors [2]. These complex mechanisms may explain the lack of definite methods for making a precise diagnosis and effective treatment for CRPS.
Reactive oxygen species (ROS), such as superoxide, hydrogen peroxide, singlet oxygen, and hydroxyl radicals, are oxidants produced by multiple sources in nervous tissue. There is accumulating evidence that ROS play a critical role in the pathophysiology of CRPS type I (CRPS-I). Several clinical trials demonstrated that free-radical scavengers, such as dimethylsulfoxide, vitamin C, N-acetylcysteine (NAC), and phenyl-N-t-butyl nitrone reduced the signs and symptoms of neuropathic pain, especially CRPS-I [3-6]. Coderre et al. [7] found that ROS contribute to the pathophysiology of CRPS-I using a chronic post-ischemia pain (CPIP) model. Various free-radical scavengers, such as NAC, 4-hydroxy-2,2,6,6-tetramethylpiperidine-1-oxyl (Tempol), and allopurinol, reduced the signs of hyperalgesia and allodynia in the CPIP rat model [7,8].
Vitamins C (L-ascorbic acid) and E (α-tocopherol) are common antioxidants and familiar essential nutrients in humans. Vitamin C is a water-soluble molecule that can scavenge free radicals, such as superoxide, singlet oxygen, and hydroxyl radicals [9]. Vitamin E is a lipophilic antioxidant that interrupts the chain reaction of lipid peroxidation, and many studies have examined whether vitamin E improves I/R injury [10]. Although several clinical studies have demonstrated the antioxidant role of vitamin C in CRPS patients, the efficacy and mechanism(s) of vitamin C and E analgesia in I/R injury-related CRPS have not been addressed.
The central sensitization that follows peripheral tissue injury might contribute to the development of chronic neuropathic pain, especially the induction and persistence of neuropathic pain, like CRPS-I [2]. The N-methyl-D-aspartate (NMDA) receptor plays a critical role in the central sensitization occurring in the dorsal horn. Increased levels of phosphorylated NMDA receptors can be a crucial indicator of receptor excitation that leads to central sensitization as the basic mechanism for the transition to a persistent state of neuropathic pain [11,12]. Mitogen-activated protein kinases (MAPKs) are critical for intracellular signal transduction, neural plasticity, and the inflammatory response. The activation of MAPKs in glial cells is essential for the induction and persistence of neuropathic pain [11,13].
Based on the reports that ROS are involved in nociceptive processes and vitamins C and E have antioxidant effects, we hypothesized that the administration of vitamin C or E would inhibit neuropathic pain processing in the CPIP rat model.
Thus, in the present study, we examined whether the intraperitoneal (i.p.) administration of vitamins C and E alone or together could reduce pain responses of mechanical allodynia in CPIP rats, comparable to CRPS-I in humans, via changes in the levels of phosphorylated NMDA receptor subunit 1 (pNR1) and extracellular-signal-regulated kinases (pERKs), one of the MAPKs, in the rat spinal cord.
Go to : 
Materials and Methods
Animals
Male Sprague-Dawley rats (280-320 g) were used for this study. After arrival, rats were acclimated in their cages for 3 days before the experiment. All housing conditions and experimental procedures followed the National Institutes of Health guidelines on laboratory animal welfare, and the protocols were approved by the Institutional Animal Care and Use Committee.
Drug treatment
To assess the effects of vitamins C and E on pain responses to mechanical allodynia and the dose-response in a CPIP rat model, vitamin C was dissolved in 0.9% normal saline at 200 mg/ml, and vitamin E was dissolved in olive oil at 100 mg/ml. They were administered i.p. once per day for 3 days before inducing I/R injury, according to the experimental protocol.
In total, 48 rats were assigned randomly to eight groups of six rats each: (1) sham rats and CPIP rats treated with (2) saline (vehicle), (3) olive oil (vehicle), (4) vitamin C 100 mg/kg, (5) vitamin C 200 mg/kg, (6) vitamin E 50 mg/kg, (7) vitamin E 100 mg/kg, (8) vitamin C 100 + vitamin E 50 mg/kg body weight. Vitamins C and E in combination were administered as consecutive single doses of vitamins C and E. To minimize oxidation of the vitamins in solution, all were prepared immediately before use. The withdrawal thresholds of mechanical allodynia were measured 3 days after reperfusion, immediately before the rats were sacrificed. The changes in pain withdrawal thresholds in the groups treated with vitamins C and E were compared with those of sham and vehicle groups. All procedures were conducted blindly; the experimenter was not aware of the nature of the experiment.
To assess the effects of vitamin C, E, and C + E on pNR1 and pERK, 3 days after reperfusion, the immunoreactivities of pNR1 and pERK were evaluated in the ipsilateral L4/6 spinal cord using Western blotting after pain testing.
All chemicals, unless otherwise stated, were purchased from Sigma Chemical (St. Louis, MO, USA).
Hindpaw ischemia/reperfusion
The CPIP model was induced as described by Coderre et al. [7]. Following anesthetic induction with sodium pentobarbital, a Nitrile 70 Durometer O-ring (O-rings West, Seattle, WA, USA) was placed around rat's left ankle joint of the rat for 3 h. The O-ring was then cut to allow reperfusion. Sham rats underwent an identical process, except that the O-ring was cut and surrounded the ankle loosely, not occluding the blood flow to the hind paw.
Test for sedation
Because the thresholds of mechanical allodynia can be affected by sedation or anesthesia, it was first necessary to determine whether saline, olive oil, vitamin C, or vitamin E had any sedative or anesthetic effect. Posture and righting reflexes were estimated in all rats according to the five-point scales described by Kim et al. [14]. In all cases, the scores were zero, indicating no sedative or anesthetic effect.
Behavioral test
We assessed hindpaw mechanical allodynia, based on a modification of the up-down technique introduced by Chaplan et al. [15] and Dixon [16] by measuring the withdrawal threshold to von Frey filament stimulation. Rats were placed in a transparent acrylic box (15 × 23 × 24 cm3) with a wire-mesh floor. This aided behavioral observation and facilitated the application of the von Frey filaments (nylon monofilaments; Stoelting, Wood Dale, IL, USA) to the plantar surface of the hind paw. After the rats adapted to the wire-mesh floor (~15 min), filaments were applied in ascending or descending strength, as necessary, to determine the filament closest to the withdrawal response threshold. Eight von Frey filaments were chosen (Von Frey numbers: 3.61, 3.84, 4.08, 4.31, 4.56, 4.74, 4.92, and 5.18, equivalent to 0.4, 0.6, 1.0, 2.0, 4.0, 6.0, 8.0, and 15.0 g, respectively). The minimum and maximum stimulus intensity was 0.4 g and 15 g, respectively. Each filament was applied to the center of the paw one at a time for 10 s. A less-intense stimulus was applied after each positive response, while a more intense stimulus followed each negative response, until six responses were recorded after the first change in response. Based on the response pattern and the force of the final filament, the 50% response threshold (in g) was calculated.
Western blot analysis
The rats were immediately sacrificed and the L4-6 spinal cord segments were rapidly harvested, separated into ipsilateral and contralateral sides, and frozen with liquid nitrogen. The tissue samples were homogenized in lysis buffer (20 mM Tris-HCl pH 8.0, 150 mM NaCl, 1 mM EDTA, 2 mM Na3Vo4, 0.5 mM DTT, 10% glycerol, 1% Nonidet P-40,) which acted as a protease inhibitor cocktail. The samples were centrifuged at 12000 rpm for 20 min at 4℃ and the supernatant was separated. Proteins were quantified by the Bradford method (Bio-Rad, Hercules, USA). Protein samples (50 µg) from each group were dissolved in a buffer solution (0.5 M Tris-HCl, glycerol, 10% SDS, 0.5% bromophenol blue). They were heated at 100℃ for 5 min, resolved in a 10% SDS-polyacrylamide electrophoresis gel and transferred onto a membrane. The membranes were blocked with Tris-buffered saline (50 mM Tris pH 7.4, 10 mM NaCl) in 5% non-fat milk at room temperature for 2 h and incubated with anti-pNR1 and -pERK antibodies at 4℃ overnight. Membranes were then incubated with monoclonal anti-β-actin antibody (1: 50,000, Cell Signaling Technology) for 2 h at room temperature. After washing with Tris-buffered saline, the membranes were incubated with peroxidase-conjugated secondary antibody (1: 5000, goat anti-rabbit, Upstate Biotechnology; 1: 5000, donkey anti-mouse) for 1 h at room temperature and proteins identifies with the ECL system (Amersham Biosciences, Buckinghamshire, England). The blots were exposed to autoradiographic film (Eastman Kodak, Rochester, NY, USA). Films were scanned into a computer, and band densities of pNR1 and pERK were quantified using the Meta Image software (Molecular Devices, Downingtown, PA, USA). Densities were calculated using the Labworks 4.5 software (Ultra-violet Products). Using β-actin as an internal standard, the ratio of pNR1 or pERK to β-actin was calculated.
Statistical analysis
Statistical evaluations were conducted using the SPSS software (ver. 17.0 for Windows; SPSS, Chicago, IL). Data were analyzed by one-way analysis of variance (ANOVA), followed by post hoc comparisons (Student-Newman-Keuls test). For all tests, significance was a P < 0.05. All data are presented as means ± SEM.
Go to :
Results
Behavioral test
The baseline values of the pain withdrawal thresholds were not significantly different between the sham, vehicle, vitamin C 100 or 200, vitamin E 50 or 100, and vitamin C 100 + vitamin E 50 mg/kg groups (data not shown). Three days after reperfusion, the ipsilateral von Frey withdrawal thresholds for mechanical allodynia in the vitamin C 200 and vitamin E 100 mg/kg groups showed significant antiallodynic effects relative to those of the vehicle groups (P < 0.01), although the mechanical thresholds were not normalized to that of the sham group. The ipsilateral von Frey withdrawal threshold for mechanical allodynia in the vitamin C 100 + vitamin E 50 group showed significant antiallodynic effects relative to those of the vitamin C 100 or vitamin E 50 mg/kg groups (P < 0.01), although the mechanical threshold was not normalized to that of the sham group (Fig. 1).
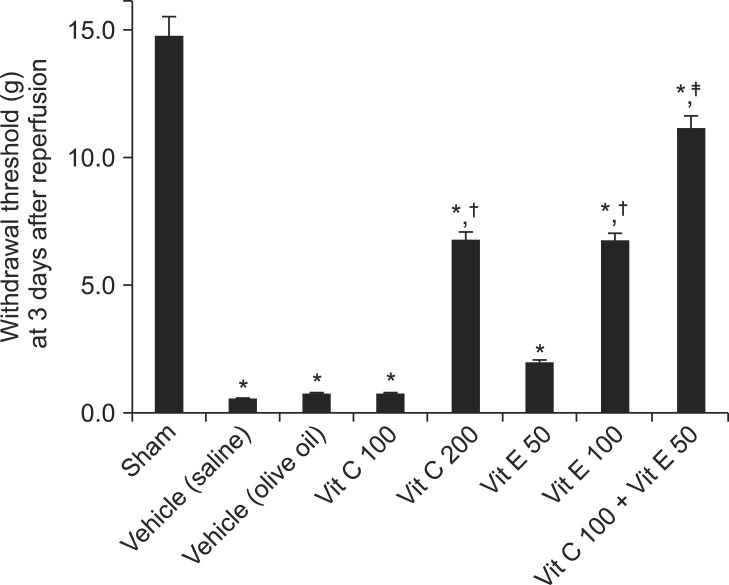 | Fig. 1Left-sided von Frey withdrawal thresholds for mechanical allodynia at 3 days after reperfusion. Vitamin C 200 and vitamin E 100 groups showed statistically significant antiallodynic effects relative to vehicle (saline) and vehicle (olive oil), respectively (P < 0.01), although mechanical thresholds were not normalized to that of the sham (P < 0.01). Vitamin C 100 + vitamin E 50 group showed a statistically significant antiallodynic effect relative to the vitamin C 100 and vitamin E 50 groups (P < 0.01), although the mechanical threshold was not normalized to that of sham (P < 0.01). Data are presented as means ± SEM. Sham rats (n = 6), vehicle (saline), saline treatment (n = 6), vehicle (olive oil), olive oil treatment (n = 6), vit C 100, vitamin C 100 mg/kg treatment (n = 6), vit C 200, vitamin C 200 mg/kg treatment (n = 6), vit E 50, vitamin E 50 mg/kg treatment (n = 6), vit E 100, vitamin E 100 mg/kg treatment (n = 6), vit C 100 + vit E 50, vitamin C 100 + vitamin E 50 mg/kg treatment (n = 6). *P < 0.05, vs. sham group. †P < 0.05, vs. the vehicle (saline) or vehicle (olive oil) groups. ‡P < 0.05, vs. the vit C 100 or vit E 50 groups.
|
Western blot analysis
Western blotting was performed 3 days after reperfusion. The relative densities of pNR1 in the vitamin C 200 and vitamin E 100 mg/kg groups decreased significantly compared with those of the respective vehicles (P < 0.05 and P < 0.01, respectively), although the relative densities of pNR1 in the vitamin C 200 and vitamin E 100 mg/kg groups were significantly higher compared with the sham group (P < 0.01 and P < 0.05, respectively). The relative level of pNR1 in the vitamin C 100 + vitamin E 50 mg/kg group decreased significantly compared with the vitamin C 100 and vitamin E 50 mg/kg groups (P < 0.01) (Fig. 2).
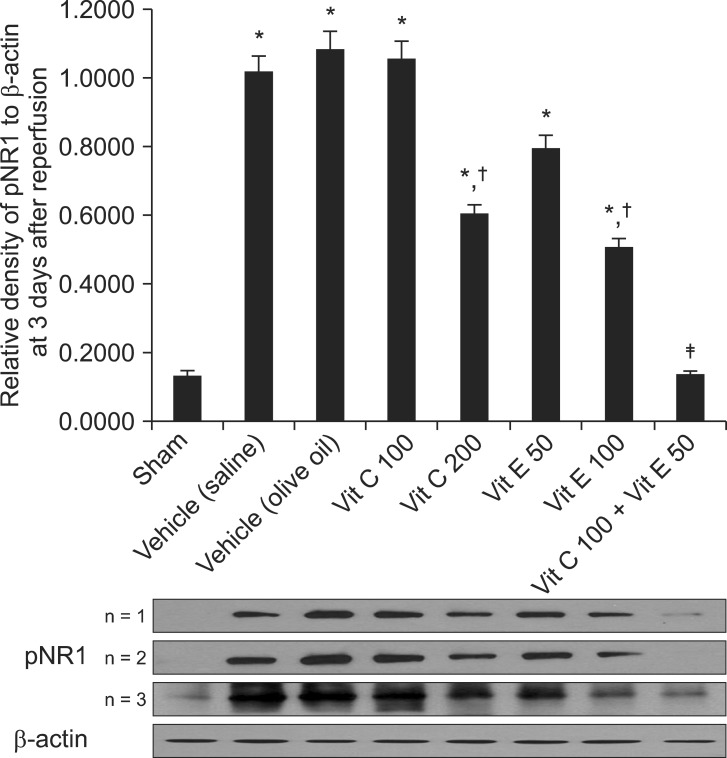 | Fig. 2Western blot data showing the relative densities of pNR1 to β-actin at 3 days after reperfusion. The relative densities of pNR1 in the vitamin C 200 and vitamin E 100 groups decreased significantly compared with those of the vehicle (saline) and vehicle (olive oil), respectively (P < 0.05 and P < 0.01, respectively), although the relative densities of pNR1 in the vitamin C 200 and vitamin E 100 groups were significantly higher compared with that of the sham group (P < 0.01 and P < 0.05, respectively). The relative density of pNR1 in the vitamin C 100 + vitamin E 50 group decreased significantly compared with those of the vitamin C 100 and vitamin E 50 groups (P < 0.01). Data are presented as means ± SEM. Sham rats (n = 3), vehicle (saline), saline treatment (n = 3), vehicle (olive oil), olive oil treatment (n = 3), vit C 100, vitamin C 100 mg/kg treatment (n = 3), vit C 200, vitamin C 200 mg/kg treatment (n = 3), vit E 50, vitamin E 50 mg/kg treatment (n = 3), vit E 100, vitamin E 100 mg/kg treatment (n = 3), vit C 100 + vit E 50, vitamin C 100 + vitamin E 50 mg/kg treatment (n = 3). *P < 0.05, vs. the sham group. †P < 0.05, vs. the vehicle (saline) or vehicle (olive oil) groups. ‡P < 0.05, vs. the vit C 100 or vit E 50 groups.
|
The relative levels of pERK in the vitamin C 200 and vitamin E 100 mg/kg groups decreased significantly compared with the respective vehicles (P < 0.01). The relative pERK level in the vitamin C 100 + vitamin E 50 group decreased significantly compared with the vitamin C 100 and vitamin E 50 mg/kg groups (P < 0.01) (Fig. 3).
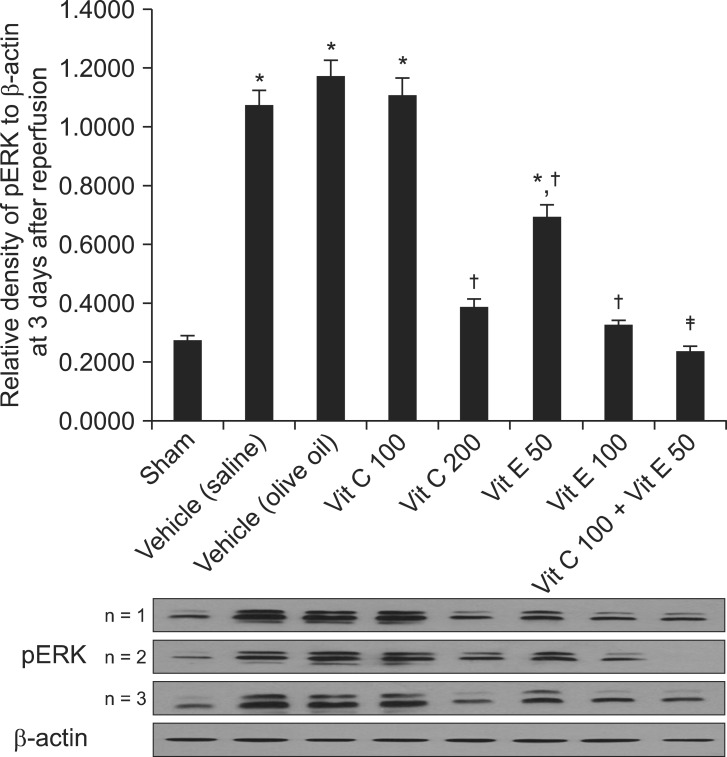 | Fig. 3Western blot data showing the relative densities of pERK to β-actin at 3 days after reperfusion. The relative density of pERK in the vitamin C 200 and vitamin E 100 groups decreased significantly compared with those of the vehicle (saline) and vehicle (olive oil), respectively (P < 0.01). The relative density of pERK in the vitamin C 100 + vitamin E 50 group decreased significantly compared with those of the vitamin C 100 and vitamin E 50 groups (P < 0.01). Data are presented as means ± SEM. Sham rats (n = 3), vehicle (saline), saline treatment (n = 3), vehicle (olive oil), olive oil treatment (n = 3), vit C 100, vitamin C 100 mg/kg treatment (n = 3), vit C 200, vitamin C 200 mg/kg treatment (n = 3), vit E 50, vitamin E 50 mg/kg treatment (n = 3), vit E 100, vitamin E 100 mg/kg treatment (n = 3), vit C 100 + vit E 50, vitamin C 100 + vitamin E 50 mg/kg treatment (n = 3). *P < 0.05, vs. the sham group. †P < 0.05, vs. the vehicle (saline) or vehicle (olive oil) groups. ‡P < 0.05, vs. the vitamin C 100 or vitamin E 50 groups.
|
Go to :
Discussion
The main finding of the present study was that when the antioxidant vitamins C and E were administered i.p. to CPIP rats, I/R injury-induced mechanical allodynia was attenuated and the pNR1 and pERK levels were decreased in the rat spinal cord. These findings indicate that central sensitization plays an important role in developing the mechanical allodynia induced by I/R injury and antiallodynic effects of vitamins C and E occur through a spinal mechanism. Additionally, co-administration of these vitamins had a greater antiallodynic effect.
The antinociceptive effects of vitamins C and E have been reported previously. In the streptozotocin-induced young diabetic rat model used to study diabetic neuropathy, vitamin E (1 g/kg per day) prevented nerve maturation impairment and improved nerve regeneration [17]. In neuropathic pain rat models produced by spinal nerve ligation, Kim et al. [18] reported that a single systemic administration of vitamin E (100-5000 mg/kg in 10 ml/kg of olive oil, i.p.) produced antinociceptive effects in neuropathic rats that may have been mediated by reducing central sensitization. Rosa et al. [19] reported that a single administration of vitamin C (0.3-10 mg/kg, i.p.) significantly inhibited both the neurogenic (early phase) and inflammatory (late phase) pain responses of 2.5% formalin-induced paw licking in mice, in a dose-dependent manner. Additionally, vitamin C (3 mg/kg, i.p.) inhibited the biting responses induced by intrathecal administration of glutamate, NMDA, γ-amino-3-hydroxy-5-methyl-4-isoxazolepropionic acid, kainate, and substance P in mice. These results may indicate that vitamin C produces antinociception by interacting with glutamate receptors.
In all of these studies, neuropathic pain conditions were induced by various agents and methods and then the antioxidants were administered to the rats. In contrast, in the present study, vitamins C and E were administered once per day for 3 days before I/R injury in a pre-emptive manner. Detailed comparative studies of pre-emptive versus post-injury drug administration might provide insight into the roles of vitamins C and E in preventing the development of neuropathic pain, including determination of an optimal schedule of vitamin administration in patients at high risk of CRPS.
Because phosphorylation of NMDA receptors is closely related to their activation and significantly increased pNR1 levels indicate central sensitization [20], we used the increased phosphorylation of NR1 and ERK in the spinal cord as indicators of central sensitization in CPIP rats. Central sensitization can be defined as the markedly enhanced excitation of nociceptive neurons in the dorsal horn of the spinal cord to peripheral normal stimuli [21]. In neuropathic pain, as in CRPS-I, central sensitization, mediated by the neuropeptide substance P and the excitatory amino acid glutamate acting at spinal NMDA receptors, results in increased responses to stimuli that are normally painful (hyperalgesia), and causes pain with normally non-painful stimuli, such as light touch or cold (allodynia) [22]. Additionally, neuronal activation of MAPKs in the spinal cord dorsal horn neurons, especially in glial cells, plays a critical role in neural plasticity and central sensitization [13].
Acting as an electron donor, vitamin C, a water-soluble vitamin, is a well-known antioxidant that can scavenge ROS [9]. In addition to acting as an antioxidant, many studies have suggested that vitamin C has neuromodulatory activity in the brain through inhibition of neurotransmitter binding to NMDA receptors [23,24]. Several experiments using animal models of excitotoxic neurological disorders, such as Huntington's disease, showed neuroprotective effects of vitamin C [25,26]. Vitamin C protected cultured neurons from the toxic effects of excessive glutamate action, which is also related to nociception, by acting at the NMDA receptor reduction-oxidation site [23,24]. Through these potential mechanisms, vitamin C may have an important role in modulating nociception. Here, we also demonstrated that vitamin C markedly attenuated mechanical allodynia and the phosphorylation of the NMDA receptor and ERK in the spinal cord. Based on previous reports and the present study, we suggest that vitamin C may act as a neuromodulator via a central mechanism.
Vitamin E, a fat-soluble vitamin, is a chain-breaking antioxidant in mammalian cell membranes, and plays a critical role in protection against lipid peroxidation [10]. Vitamin E protects cell membranes by scavenging ROS, and is a chain-breaking antioxidant in that it terminates the propagation of fatty acid peroxidation [27]. Kim et al. [18] showed that vitamin E reduced the pain behavioral responses of mechanical allodynia in a spinal nerve ligation rat model. They suggested that the analgesic effect of vitamin E occurred through a spinal mechanism, reducing central sensitization, demonstrated by decreased pNR1 levels after the i.p. administration of vitamin E in the spinal dorsal horn neurons of spinal nerve ligation rats. Consistent with their data, our results suggest that the effect of vitamin E-induced analgesia may arise via a spinal mechanism.
The present data demonstrated that vitamins C and E act in an additive or possibly synergistic manner. Vitamin E protects against lipid peroxidation resulting from the formation of tocopheroxyl radicals, which can directly react with other antioxidants, such as vitamin C or other hydrogen donors, to regenerate the active molecule. In other words, vitamin C is capable of 'recycling' vitamin E by repairing the tocopheroxyl radical of vitamin E, allowing it to continue acting as a chain-breaking antioxidant [25,28]. This mechanism may explain the additive or synergistic antioxidative effects when vitamins C and E were administered together.
Based on rat studies, we used vitamin C doses of 100 and 200 mg/kg body weight and vitamin E doses of 50 and 100 mg/kg body weight [18,29]. These doses, given once per day for 3 days to 280,320 g CPIP rats, corresponded to 30 and 60 mg vitamin C and 15 and 30 mg vitamin E per rat, respectively. Considering the differences between rat and human metabolic activities, it is difficult to determine comparable doses of vitamin E in these species. However, the relatively low doses (50 and 100 mg/kg BW) that we injected i.p. once per day for 3 days to 280-300 g (mean 300 g) rats (15 and 30 mg per rat, respectively) would correspond to 3 g for a 60 kg human. These doses are within the range used clinically in humans (2000-5000 IU of vitamin E or about 2-5 g) [18]. Although the recommended dose of vitamin C in adult humans is lower than that of vitamin E, it is generally known that the amount of vitamin C that can be used safely is twofold higher than that of vitamin E for the general population [30]. Although olive oil contains small amounts of vitamin E, the actual total amount of vitamin E in the olive oil (about 0.5 ml) used for a single injection was only ~0.05 mg, which is negligible in comparison to the amount of vitamin E used in the present study.
In conclusion, the antioxidants vitamins C and E, when administered i.p. once per day for 3 days before I/R injury, attenuated I/R injury-induced mechanical allodynia. The co-administration of vitamins C and E had a greater antiallodynic effect. The antiallodynic effects of vitamins C and E and the reduced levels of phosphorylated NR1 and ERK indicate that vitamins C and E may be involved in inhibiting modulation of neuropathic pain processing in the spinal cord.
Go to :
 XML Download