Introduction
Target controlled infusion (TCI) of propofol is known as a useful method for maintenance of stable plasma concentration within a clinically acceptable range of performance errors. Reports from many studies have confirmed the usefulness of pharmacokinetic (PK) models that play an important role in the TCI system [
1,
2]. However, we need to determine the relationship of effect site concentration and plasma concentration in order to describe a time course of the concentration of effect site and the effect of a drug.
In particular, when we begin administration of the drug or change the target plasma concentration, the plasma concentration quickly achieves the target concentration; however, the peak effect of the drug is established slowly. This delay (hysteresis) occurs because the action site is the effect site, or biophase, not the plasma. This time course of the concentration of the effect site and the plasma is explained by the plasma and effect site equilibrium rate constant, ke0, which is incorporated into the TCI system with various compartmental models of propofol.
However, coupling of the k
e0 from the separate pharmacodynamic (PD) model to the different PK models or infusion schemes is undesirable, and fails to predict the time course of the drug effect [
3,
4]. Struys et al. [
5] also revealed that the different k
e0 for targeting of effect-site concentration of propofol predicted different time courses for the effect of propofol, as measured by the bispectral index. And Minto et al. demonstrated that the time of maximum effect site concentration could be useful to combine pharmacokinetics and pharmacodynamics [
6].
Therefore, in order to optimally link the PK-PD model for the TCI system, we attempted to titrate ke0s with two different methods in the covariate-adjusted PK model, and compared them to the known PD model.
Go to :

Materials and Methods
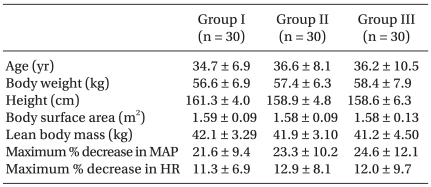
With approval from the local clinical ethics committee and signed informed consent, a total of 90 female patients, ASA physical status I, ranging in age from 20-60 yr, who were scheduled for gynecologic surgery under general anesthesia were entered in this study. Exclusion criteria included body weight of less than 70%, or more than 150% of ideal body weight, medications for the central nervous system, chronic pain, or neurological disorders. In the operating room, an 18-gauge catheter was inserted into a large forearm vein for intravenous fluid administration and infusion of propofol. Patients received glycopyrrolate 0.2 mg intravenously for premedication; however, no other sedatives were administrated before and during the period of this study. Electrocardiograph, pulse oximeter, noninvasive blood pressure monitor, and capnogram were applied. Heart rate and blood pressure were monitored and recorded every 30 sec for the first 5 min, and then each minute, for 10 min. No significant differences with respect to age, body weight, height, lean body mass, and body surface area were observed between the three groups. Maximal percentages of decrease of mean arterial blood pressure and heart rate were not significant between the groups (
Table 1).
Table 1
Demographic and Hemodynamic Variables

Following pre-oxygenation, lidocaine 30 mg was given, and propofol (1% Diprivan®, ZENECA Pharmaceuticals, England) was administered via a syringe pump (Graseby 3500®, Sims Graseby Ltd., Herts, England), which was controlled by the STANPUMP through an RS232 interface. We used the three-compartment mamillary model for propofol, which is known as a non-linear mixed effect model that includes age, weight, height, lean body mass, and age as covariates [
8]. PK parameters and their equations with covariates are illustrated in
Table 2.
Table 2
Pharmacokinetic Parameters and their Equations with Covariates for Target-controlled Infusion of Propofol


Patients were randomly assigned to the three groups; each group had a differently targeted plasma concentration (Cp); 5.4 (Group I), 8.1 (Group II), and 10.8 µg/ml (Group III). A plasma concentration of 5.4 µg/ml is known to represent loss of consciousness in 95% of subjects [
9,
10], and 8.1 µg/ml and 10.8 µg/ml were chosen because they were calculated as the one and half, and twice of this Cp
95. A propofol filled syringe was connected to the 3-channel extension tube with a one-way valve to prevent regurgitation of propofol into the intravenous fluid. The interval for pump control update and data saving was set to 10 seconds, which is the default setting for the STANPUMP. To ensure accurate administration of propofol, the patient was excluded from the study if any alarm on the TCI device was triggered.
Once the patient became drowsy, loss of responsiveness was assessed by a blind investigator with no knowledge of the target concentration; with mild prodding of the shoulders, patients were asked to open their eyes every 10 seconds. Any responses to these stimuli, such as eye opening, head nodding, or any kind of responsive behavior, were defined as 'responsiveness'; and no response was defined as loss of responsiveness (LOR). The time from the start of infusion to the point of LOR, and the amount of propofol infused until LOR were recorded. The study was terminated 10 min after the start of the infusion of propofol. After LOR, patients were anesthetized with opiods and neuromuscular blocking agents, or underwent tracheal intubation, according to their scheduled surgeries. During the study, patients received oxygen via facemask. If oxygen saturation decreased below 95%, patients were encouraged to breathe deeply if they responded to a verbal command; if there was no response, manual breathing was supported by use of a circle system with oxygen, while maintaining end-tidal CO2 partial pressure between 35 and 40 mmHg.
For analysis of data for a known LOR time, we obtained the predicted effect-site concentration for particular values of ke0 by re-run of the STANPUMP. First, we executed the STANPUMP, inputting data from each subject, such as age, weight, height, and sex. Thus, the covariate-adjusted PK parameters were obtained, and specific external PK files were made for each patient. Each subject file was obtained independently for different ke0s. The STANPUMP with command line argument of external parameter files was subsequently used to obtain predicted effect site concentrations for LOR with different ke0. For calculation of effect site concentration, we ran the STANPUMP in real mode with the maximum infusion rate fixing to 1,200 ml/h. In order to obtain the value of ke0 for PK-PD coupling, we used two methods for titration, and compared them with known ke0.
Titration of ke0 from the link method of 'Concentration-Probability-Time' (Predicted effect site concentration-Probability of LOR-T1/2ke0)
We investigated the method for calculation of k
e0 derived from t
1/2k
e0, which is ln2/k
e0, at which the effect-site concentration becomes half of the target plasma concentration with a certain probability of LOR. When we target a plasma concentration, the effect-site concentration rises slowly, and achieves the half value of the targeted plasma concentration at half-life of t
1/2k
e0, the three quarters (1/2 + 1/4) at twice of half-lives, and seven-eighths (1/2 + 1/4 + 1/8) at triple of half-lives (
Fig. 1). As we targeted 5.4, 8.1, and 10.8 µg/ml of plasma concentration in each group, the effect-site concentrations will be 2.7, 4.05, and 5.4 µg/ml at t
1/2k
e0, and 4.05, 6.075, and 8.1 µg/ml at two t
1/2k
e0, and 4.425, 7.0875, and 9.45 at triple t
1/2k
e0.
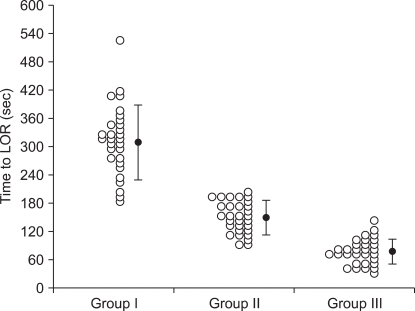 | Fig. 1Example of the time course of the plasma (dotted line) and effect site (solid line) concentrations of propofol targeted to 8.1 µg/ml of plasma concentration of propofol. Dash-dot line indicates that the predicted effect-site concentration achieves half (4.05 µg/ml) of the target plasma concentration (Cp) at one t1/2ke0, three quarter (6.08 µg/ml) of Cp at two times of t1/2ke0, and seven eighth (7.09 µg/ml) of Cp at three times of t1/2ke0. 
|
The link of the 'concentration' and 'probability' were obtained with 9 different ke0s (ranging 0.2-0.6 with 0.05 intervals). Each analysis proceeded separately, and probabilities of 0.1-0.99 at 0.1-0.5 intervals were attained. Probabilities of LOR at effect-site concentrations that were half, three quarters, or seven-eighths of the target plasma concentration were obtained from probit regression analysis. The link of times to the probability of LOR in each group was obtained from the probit regression analysis curve. These regression curves were used for the link of the 'probability' to 'time' (one, two, and three times of the t1/2ke0). Times associated with a given probability of a certain effect-site concentration of the target concentrations were then matched to t1/2ke0 in each group. If the given effect site concentrations were the value of the 3/4 or 7/8 target plasma concentration, the associated times were divided by 2 or 3, and the ke0 of each group was calculated from t1/2ke0 (= ln2/ke0).
While ke0 changed, the ke0 that we inputted and the calculated ke0 from this link of 'concentration-probability-time' showed a discrepancy. Therefore, we sought to determine a ke0 value that could minimize the total discrepancy (TD) between the inputted ke0 and the calculated ke0. Total discrepancy for each ke0 was the summation of squared differences of the applied ke0, and the calculated ke0 for a certain probability of the given effect site concentration in each group, and was expressed as follows:

in which Ike0 was the inputted ke0 for the regression curve of the probability and effect-site concentration, and Cke0-ij is the calculated ke0 of the effect-site concentration at i times of t1/2ke0 in the jth group for the link of time-concentration-probability; and N is the number of the available calculations used for each ke0. The ke0 for minimal TD was calculated by the nonlinear regression method with curve fitting of a polynominal quadratic equation (Sigmaplot 2001®, 7.0 edition, SPSS Inc.). The following equation was used:
TD = y0 + B*ke0 + A*ke02
in which y0, B, and A were the coefficients for the quadratic equation. The values of these coefficients and standard errors were analyzed, and '-A/2B' determined the final estimation of ke0.
Titration of ke0 for the minimal discrepancy between the median effect site concentrations of each group
This analysis was based on the assumption that the effect site concentration of a drug for a specific PD profile would be the same, even though subjects received different target plasma concentrations. Likewise, patients would be unresponsive at certain stimuli at the same effect site concentration. Thus, we compared the median effect site concentrations of propofol with nine different ke0s (ranging 0.2-0.6 with 0.05 intervals) that could minimize discrepancy between the groups. The predicted effect site concentration was obtained by a dry run of the STANPUMP with a previously described patient specific external PK file. Total discrepancies (TD) for each ke0 were obtained using the following equation:
TD (ke0) = [(Ce1 - Ce2)2 + (Ce2 - Ce3)2 + (Ce3 - Ce1)2]1/2
where Ce1, Ce2, and Ce3 were the median predicted effect-site concentrations for LOR of the 5.4, 8.1, and 10.8 µg/ml targeted groups. The ke0 for minimal TD was calculated using the nonlinear regression method described above.
Comparison with Schnider's PD model
The k
e0s obtained from our two analytical methods were compared with Schnider's pharmacodynamics [
7]. Using a previously described simulation of the STANPUMP, the predicted effect site concentrations for each subject (n = 90) from these three k
e0 were obtained all over again. We compared mean effect site concentrations for LOR, and also found effect site concentrations of propofol that could represent LOR in 50% (C
e50) and 95% (C
e95) of subjects for each k
e0s. The times to peak effect of the TCI system for these k
e0s were furthermore calculated using the STANPUMP.
Comparisons of demographic and hemodynamic variables, observations of LOR, and mean effect site concentrations were performed using analysis of variance with post-hoc multiple comparison at a P < 0.05 level of significance. Unless stated otherwise, data are presented as mean ± SD. Regression between time, probability, and concentration were performed using probit regression analysis (SPSS, version 10.0.1, SPSS Inc.), and were expressed with 95% confidence intervals.
Go to :

Results
Times to LOR for each group are illustrated in
Fig. 2. Observations made at the time of LOR are shown in
Table 3. Patients lost responsiveness more rapidly when the TCI device was targeted at higher plasma concentrations. However, less propofol was administered until LOR in patients targeted at 8.1 and 10.8 µg/ml than in those targeted at 5.4 µg/ml of plasma concentration.
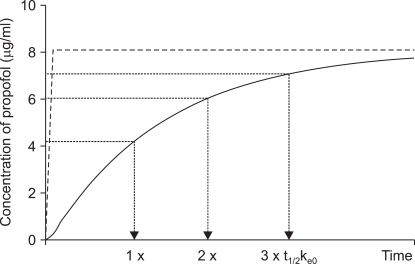 | Fig. 2Scatter plots (○) and means (SD) showing the time to loss of responsiveness (LOR) of patients targeted to 5.4 (Group I), 8.1 (Group II), and 10.8 µg/ml (Group III) of the plasma concentration of propofol during induction of anesthesia. 
|
Table 3
Observations at Loss of Responsiveness (LOR)


An example of the method for the link of 'Concentration-Probability-Time' for a particular k
e0 (0.4/min) in patients who received propofol to 8.1 µg/ml of the target plasma concentration is shown in
Fig. 3. Calculated k
e0s (C
ke0) for a differently inputted k
e0 (I
ke0) and the probabilities (P
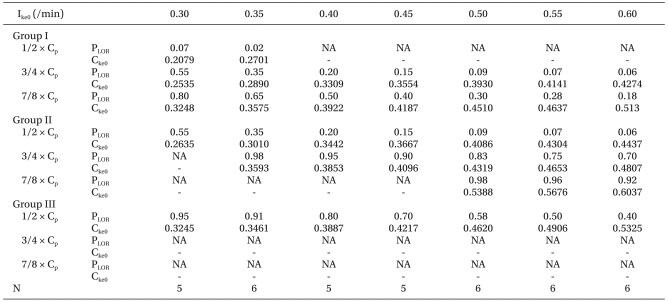
LOR) of LOR at given effect site concentrations of 1/2, 3/4, and 7/8 of the target plasma concentration (C
p) in each group are listed in
Table 4. Because the effect site concentration of highest probability (P
LOR = 0.99) was lower than predicted in group II and III, times to the predicted effect site concentration could not be calculated when we applied k
e0 for 0.2 and 0.25/min. Likewise the C
ke0 could not be calculated when the predicted concentration was lower than 1% of probability or higher than 100% of probability. These unavailable data were expressed as 'NA' in
Table 4. TD of the inputted k
e0 and the calculated k
e0 for different k
e0 is shown in
Fig. 4. Coefficients ± SE for the regression curve were 0.0310 ± 0.0043 for y0, -0.158 ± 0.0199 for A, and 0.2145 ± 0.0220 for B (R
2 = 0.9906, P < 0.001), respectively. The k
e0 for the minimal TD was 0.3692/min. TD of the median predicted effect site concentration for different k
e0 is shown in
Fig. 5. The coefficients ± SE for the regression curve were 2.6624 ± 0.1750 for y0, -9.4815 ± 0.9360 for A, and 12.5145 ± 1.1584 for B (R
2 = 0.9568, P < 0.001), respectively. The k
e0 for the minimal TD was 0.3788/min.
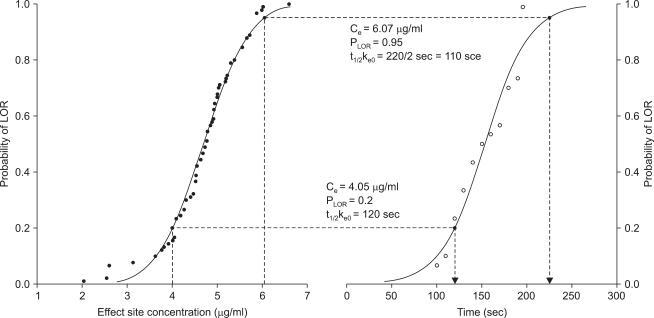 | Fig. 3Example of two probit regression curves gives the link of concentration to probability (PLOR) of loss of responsiveness (LOR), and time. (Left) Graph shows the probability of LOR for the predicted effect site concentration (Ce) when a certain plasma effect-site equilibrium rate constant (ke0 = 0.4/min) was inputted. (Right) Graph shows the time for probability of LOR when propofol was administered at 8.1 µg/ml of the target plasma concentration. (Lower) Dotted lines show that 20% of subjects represented LOR at 4.05 µg/ml (half value of target plasma concentration) of Ce, and the time for 20% LOR in this group was 120 sec, which was the t1/2ke0. Thus, the calculated ke0 was 0.3442/min. (Upper) Dotted lines show that 95% of subjects represented LOR at 6.07 µg/ml (3/4 of the target plasma concentration) of Ce, and that the time for 95% LOR was 220 sec, which was two times of t1/2ke0. Thus, the calculated ke0 was 0.3853/min. 
|
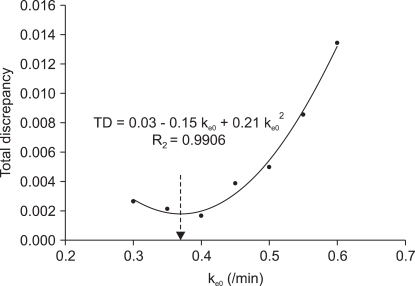 | Fig. 4Scatter plot shows the ke0 and the total discrepancy (TD) of the squared difference of the inputted plasma effect-site equilibrium rate constant (ke0) and the calculated ke0 from the link of concentration of propofol, probability of loss of responsiveness, and t1/2ke0 for the target controlled infusion with the non-linear mixed effect pharmacokinetic model of propofol. The quadratic curve shows the regression of the ke0 and total discrepancy; the ke0 for the minimal TD was 0.3692 /min (arrow end of dotted line). 
|
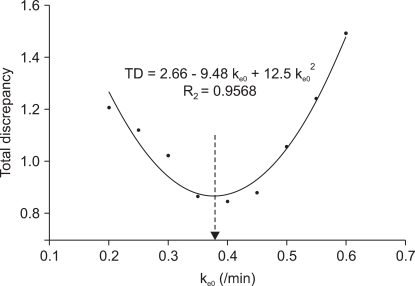 | Fig. 5Scatter plot shows the plasma effect-site equilibrium rate constant (ke0) and the total discrepancy (TD) of the squared difference of the median predicted effect site concentration between the three groups for the target controlled infusion with the non-linear mixed effect pharmacokinetic model of propofol. The quadratic curve shows the regression of the ke0 and total discrepancy; the ke0 for the minimal TD was 0.3788/min (arrow end of dotted line). 
|
Table 4
Calculated Plasma Effect-site Equilibrium Rate Constant (Cke0) for Differently Inputted ke0 (Ike0) and the Probability of LOR (PLOR) at a given Effect-Site Concentration of 1/2, 3/4, and 7/8 of the Target Plasma Concentration (Cp)

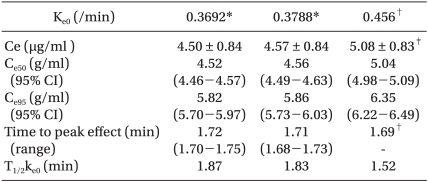
The TCI system from the PD model of Schnider et al. predicted higher effect site concentrations for LOR than those obtained in our study. Effect site concentrations were not significantly different between our two results for k
e0. Predicted effect site concentrations of LOR in 50% and 95% of subjects for three different k
e0s are shown in
Table 5. Time to peak effect from Schnider' PD was nearly identical with that of our results.
Table 5
Mean Predicted Concentrations (Ce) of Effect-site of Loss of Responsiveness (LOR) and predicted Effect-site Concentrations of LOR in 50% (Ce50) and 95% (Ce95) of Patients, and Time to Peak Effect and t1/2ke0

Go to :

Discussion
The aim of this study was to titrate the ke0 of propofol for the optimal link of pharmacodynamics to a specific PK model for the TCI. This method of link between 'Concentration-Probability-Time' could provide the optimal ke0 for the PK-PD model of propofol. A similar result was also obtained from the method for the minimal discrepancy between the median effect site concentrations; however, our results were lower than the previously published value of ke0.
Schnider et al. [
7,
8] reported that the k
e0 of propofol was 0.316/min using the 'connect-the dots' model of plasma concentration, and 0.456/min using the covariate-adjusted PK set. Results of this study were different from those of Schnider's k
e0, and the calculated effect-site concentration of LOR from Schnider's k
e0 was significantly higher than the effect-site concentration from our results, and the times to peak effect was slightly longer. The reasons for these differences could be attributed to the following: First, monitoring of the central nervous system is a continuous measure of the drug effect of propofol. However, our study used LOR as the primary measure of the time course of the drug effect. Even though this measurement is useful in routine clinical settings, it required 10 second intervals. Therefore, it could be possible that some subjects could have lost responsiveness prior to assessment of the pharmacodynamic profile. As a result, the regression curve for 'concentration-probability' could be shifted to the right side; however, the regression curve for 'probability-time' also shifted to the right side. These consequences would be reflected in the influence on the final outcome of the k
e0. Second, the influence of gender on pharmacokinetics and pharmacodynamics could be considered as a significant cause for the difference of k
e0. Gan et al. [
9] reported that gender proved to be a highly significant independent predictor for recovery time, and that women woke significantly faster than men. All subjects in our study were female. If gender differences in the sensitivity of propofol at the effect site exist, the k
e0 could be different. Thus, gender might be considered as one of the important variables in PD studies of propofol, even though the gender difference with regard to pharmacokinetics could not be completely excluded.
The TCI system from our results predicted effect site concentrations that were lower than those from Schnider's ke0 by about 0.5 µg/ml. Similarly, the Ce50 and Ce95 from our results appeared to be different from that of Schnider's ke0; however, these differences are believed to originate from the different value of ke0.
Vuyk et al. [
10] showed that the C
p50 and C
p95 of propofol for loss of eye reflexes were 2.07 and 2.78 µg/ml and for loss of consciousness were 3.40, 4.34 µg/ml. Kazama et al. [
11] also found that the plasma concentration for loss of response to verbal command in 50% and 95% were 4.4 and 7.8 µg/ml. In a study of the drug interaction of propofol and fentanyl, Smith et al. [
12] showed that C
p50 and C
p95 for propofol alone were 3.3 and 5.4 µg/ml. The differing results of these concentrations would also be due to differences in the study population, methodology, and PK models. A post-hoc power analysis conducted for determination of power revealed that total sample sizes of 90 and 90 achieve 93.1% power for detection of a difference of -0.51 between the null hypothesis stating that both means are 4.57 and the alternative hypothesis stating that the mean of effect-site concentration from 0.456/min of k
e0 is 5.08, with estimated group standard deviations of 0.84 and 0.83, and with a significance level (alpha) of 0.01, using a two-sided two-sample t-test.
Lim [
13] demonstrated a novel method of deriving the k
e0 for propofol in the conventional three-compartment model of Marsh et al. [
14], and found that the value of k
e0 was 0.80/min. This study compared the three infusion patterns without using the TCI system, and the methodology was quite similar to the second method used in this study. Our previous research [
15] also confirmed that the k
e0 of propofol was 0.77/min for the minimal difference of the median effect site concentration in the PK model of Gepts et al. [
16].
We did not use the simulation mode of the STANPUMP; we used the real mode with an empty syringe for a dry run to obtain the predicted effect site concentration for a particular ke0 in each patient. In the simulation mode of the STANPUMP, initial maximum flow rate was higher than in the real mode (1,200 ml/h), and the amount of propofol until LOR was different from the actual amount administrated during the study. Therefore, effect-site concentrations were calculated differently. For example, if we simulate the predicted effect site concentration of one patient (e.g. female, age 34 years, weight 55 kg, height 150 cm, ke0 0.4/min) targeted to 10.8 µg/ml of plasma concentration, and time to LOR is 80 sec, the pump speed is 1,798 ml/h during the first 10 sec, and then decreases to 259 ml/h, and the predicted effect site concentration is 4.25 µg/ml, and 98 mg of propofol is infused at LOR in simulation mode. However if we run in real mode by dry run, the predicted effect site concentration will be 4.09 µg/ml at LOR. This overestimation of the concentration will shift the 'concentration-probability' curve to the right side. Eventually the t1/2ke0 decreases, and the calculated ke0 increases.
The k
e0 plays an important role in the TCI system. When we target the plasma concentration, the time course of the effect site concentration is the predicted convolution of the concentration of plasma over time for k
e0e
-ke0t, with the disposition function of the effect site [
17,
18]. If inadequate values of k
e0 were applied, the effect site concentrations would be predicted as either higher or lower than the 'real' concentration of the effect site. However, this could occasionally be just a passive reference guideline on the time course of the effect of the drug, because even though we apply a higher value of k
e0, if we wait for a longer period of time (4-5 times of t
1/2k
e0 for the smallest possible k
e0), the plasma and the effect site concentration will reach equilibrium in the end. However, when we target the effect site concentration, k
e0 plays a more important role by determining the amount of drug rapidly achieving the targeted effect site concentration of the drug. If we applied a lower value than the 'real' k
e0, more amount of drug would be administrated; hence, overshooting the effect of the drug could occur, and the likelihood of side effects would increase. The computer simulation shown in
Table 6 demonstrates the different doses and patterns of infusion of propofol targeted to 5.4 µg/ml of the effect site concentration when a different k
e0 is applied during TCI. Initial bolus dose for rapid achievement of the targeted effect site concentration increased as we applied smaller values of k
e0. Therefore, titration of the optimal k
e0 for the adequate link of pharmacodynamics and pharmacokinetics during TCI is essential.
Table 6
Simulation Showing Different Bolus Doses and Infusion Rate of Propofol Targeting to 5.4 µg/min of the Effect-site Concentration when Different Plasma Effect-site Equilibrium Rate Constants (ke0) are Applied During TCI (Simulation for a Female Subject, 35 years, Body Weight 56 kg, Height 166 cm)


Techniques used in our proposed method are not so complex or integrated as those measuring EEG or bispectral index, and could be conducted in routine clinical settings without increased cost. If we make out the exact relationship between the effect-site concentration and the probability of a certain PD endpoint, the k
e0 for any population could be easily calculated. Moreover, the first method could be used for investigation of k
e0 for a wide range of possibilities, and for the effect site concentration for various levels of sedation during the process of analysis. However, in order to confirm the validity of the k
e0 from this study, we should assess the TCI of effect site targeting with the k
e0 under monitoring of the central nervous system. Doufas et al. [
19] tested the TCI of propofol with the PK model of Schnider with 0.456/min of k
e0 for the targeting of the effect site concentration, and demonstrated the validity and stability of this constant during mild to moderate sedation.
We proposed two methods of analysis for titration of the ke0 of propofol. Optimal ke0 should be obtained for the proper link of pharmacokinetics and pharmacodynamics during TCI. Adequate ke0 for a specific PK model will predict an accurate time course of concentration, and will be used for better control of the effect site concentration during targeting of the effect site.
Go to :


 PDF
PDF Citation
 Print
Print


 XML Download