Journal List > Cancer Res Treat > v.54(1) > 1154880

Hu, Li, Lan, Wei, Wen, Wu, Zhang, Xi, Li, Wu, Li, and Liao: Enrichment of Wee1/CDC2 and NF-κB Signaling Pathway Constituents Mutually Contributes to CDDP Resistance in Human Osteosarcoma

Abstract

Purpose

Osteosarcoma (OS) universally exhibits heterogeneity and cisplatin (CDDP) resistance. Although the Wee1/CDC2 and nuclear factor κB (NF-κB) pathways were reported to show abnormal activation in some tumor cells with CDDP resistance, whether there is any concrete connection is currently unclear. We explored it in human OS cells.

Materials and Methods

Multiple OS cell lines were exposed to a Wee1 inhibitor (AZD1775) and CDDP to assess the half-maximal inhibitory concentration values. Western blot, coimmunoprecipitation, confocal immunofluorescence, cell cycle, and Cell Counting Kit-8assays were performed to explore the connection between the Wee1/CDC2 and NF-κB pathways and their subsequent physiological contribution to CDDP resistance. Finally, CDDP-resistant PDX-OS xenograft models were established to confirm that AZD1775 restores the antitumor effects of CDDP.

Results

A sensitivity hierarchy of OS cells to CDDP and AZD1775 exists. In the highly CDDP-tolerant cell lines, Wee1 and RelA were physically crosslinked, which resulted in increased abundance of phosphorylated CDC2 (Y15) and RelA (S536) and consequent modulation of cell cycle progression, survival, and proliferation. Wee1 inhibition restored the effects of CDDP on these processes in CDDP-resistant OS cells. In addition, animal experiments with CDDP-resistant PDX-OS cells showed that AZD1775 combined with CDDP not only restored CDDP efficacy but also amplified AZD1775 in inhibiting tumor growth and prolonged the median survival of the mice.

Conclusion

Simultaneous enrichment of molecules in the Wee1/CDC2 and NF-κB pathways and their consequent coactivation is a new molecular mechanism of CDDP resistance in OS cells. OS with this molecular signature may respond well to Wee1 inhibition as an alternative treatment strategy.

Introduction

Osteosarcoma (OS) mostly occurs in adolescents. Although there is evidence that neoadjuvant chemotherapy combined with surgery can extend the lifespan of OS patients, the five-year survival rate has not improved significantly in the last three decades [1], which may be associated with chemotherapy drug resistance and heterogeneity in gene expression patterns in tumors [2]. Cisplatin (CDDP), which is a drug that induces DNA damage, is one of the standard neoadjuvant chemotherapy drugs for treating OS [1]. However, there is extensive genetic heterogeneity in OS [3], and drug resistance often develops during CDDP treatment; however, how this affects CDDP resistance in OS is not yet clear [1,4].
Nuclear factor κB (NF-κB) is involved in the early stress response to cellular DNA damage, and tumor necrosis factor α (TNFα) is an activator of the classical NF-κB pathway [5]. After TNFα stimulation, IκB kinases (IKKs), such as IKKα and IKKβ, are first activated in cells. IKKs degrade intracellular IκB, thus releasing NF-κB molecules such as RelA, which are phosphorylated at S536, and this allows RelA to enter the nucleus [5], bind to genes at corresponding binding sites, and initiate the transcription of downstream genes, such as CCND1 and Bcl-2, to regulate cell cycle progression, proliferation, and survival [6]. CCND1 is an oncogene and G1/S transition-specific cyclin, and elevated expression of this gene contributes to cell cycle progression and proliferation [7]. Bcl-2 is also an oncogene with an antiapoptotic function that can enhance the resistance of tumor cells to DNA-damaging drugs such as CDDP and inhibit the apoptotic effect caused by most chemotherapy drugs [8]. Caspase-3 is the main activating terminal splicing enzyme in the process of apoptosis and can be blocked by Bcl-2 [7]. Poly(ADP-ribose) polymerase (PARP) is a DNA repair enzyme that plays an important role in resisting DNA damage and apoptosis [9]. PARP can be cleaved into two PARP fragments by caspase-3 and become inactivated, resulting in failed DNA repair and consequent cell death [10]. However, all the above studies have shown that the abundance of proteins in the NF-κB signaling pathway varies greatly among tumor cells.
Studies have shown that, like NF-κB signaling pathway molecules, Wee1 is involved in the CDDP resistance of OS cells [1012]. Wee1, as a key kinase of cell mitotic monitoring, phosphorylates CDC2 at Y15, inhibits cyclin-dependent kinase activity, and blocks cell entry into mitosis [13]. AZD1775, which is an agent currently in early clinical trials, is a Wee1-specific small-molecule inhibitor [10], and its clinical therapeutic effect varies due to tumor heterogeneity and different levels of Wee1 expression.
The heterogeneity of tumor gene function is due to the differential expression levels of genes, including high or low expression levels, gene mutations, gene fusion, etc. [14]. At the cellular level, this heterogeneity affects cell malignancy and cancer development, cell cycle progression, proliferation, apoptosis, drug resistance, etc. Based on research on other tumors, the results for one genotype of OS are difficult to replicate in other genotypes because of tumor gene heterogeneity [1]. The patient-derived xenograft (PDX) OS model is a new preclinical model of tumors in which tumor tissue from a patient is xenografted into immunodeficient mice to generate tumor clones in an in vivo model [15]. This preserves not only the molecular phenotype and genotype of the tumor itself but also its pathological differentiation and tumor heterogeneity [15,16]. Currently, the PDX model is an effective way to research heterogeneous OS expression [1517].
Whether NF-κB signaling pathway molecules and the Wee1/CDC2 axis interact with each other and are involved in CDDP resistance in OS is still unclear. Here, we report that mutual activation of the NF-κB and Wee1/CDC2 signaling pathways is involved in CDDP tolerance in OS based on the high abundance of protein expression of pathway constituents. Wee1 inhibition restored the sensitivity of OS to CDDP, inhibited OS cell proliferation, prevented PDX-OS tumor growth, and prolonged the median survival of PDX mice. Therefore, these studies demonstrate a novel molecular mechanism of CDDP tolerance in OS cells, and Wee1 may be a potential therapeutic target for CDDP-resistant OS.

Materials and Methods

1. Acquisition of primary cells and the culture and passage of PDX-OS cells

1) Acquisition of human OS tissue

Referring to the aforementioned literature [17], fresh OS specimens (including CDDP-resistant and nonresistant OS) were collected from patients in Shaoguan Hospital, the Third Affiliated Hospital of Southern Medical University, Guangdong Provincial People’s Hospital.

2) Primary PDX-OS cell acquisition, culture, and passage

  1. Three pieces of OS tissue approximately 1 cm3 in size were obtained from OS patients during surgery and were immediately placed in a sterile container filled with ice-cold sterile saline and maintained on ice. After cleaning, the samples were placed in a 15-mL sterile centrifuge tube filled with 6 mL medium and transferred on ice to the laboratory for further preparation.

  2. The OS tissue blocks were cut into pieces 2 mm3 in volume with sterile shears and then cleaned with sterile phosphate buffered saline (PBS) before they were trimmed into fragments with sterile shears and then rinsed with PBS until the liquid was clear and free of turbidity and oil droplets.

  3. OS tissue samples were transferred into 3 mL serum-free culture medium containing 1 mg/mL collagen hydrolase and enzymolyzed in a water bath at 37°C for 30 minutes.

  4. After enzymolysis, 3 mL medium containing 10% fetal bovine serum (FBS) was added to neutralize the remaining collagen hydrolase activity. The samples were centrifuged for 5 minutes at room temperature at 350 ×g, and the supernatant was discarded. This centrifugation procedure was repeated twice.

  5. Cell pellets obtained after the final centrifugation were resuspended in PBS, counted and then added to a T25 cell culture flask containing culture medium. The medium was changed every 2 to 3 days or when the medium color changed. Cells that underwent amplified growth were passaged and stored. The PDX-OS1 and PD-OX2 lines were derived from OS tissue with an excellent response to neoadjuvant chemotherapy, and the PDX-OS3 line was derived from CDDP chemotherapy-resistant OS tissue.

  6. All cell experiments were conducted within 10 passages after primary cell harvest. PDX-OS1 and PDX-OS2 cells were cultured in Dulbecco’s modified Eagle’s medium (Invitrogen, Carlsbad, CA) supplemented with 10% FBS and 1% penicillin and streptomycin. The incubator was set at 37°C and 5% CO2. PDX-OS3 cells were cultured under pressure using the same medium with 5 μM CDDP.

3) Conventional human OS cell and UM-SCC cell culture

The conventional human OS cell lines Saos2, U2OS, and MG63 were obtained from ATCC (Shanghai, China). Saos2 cells were cultured in McCoy’s 5A medium (16600-082, Gibco, NY), whereas U2OS and MG63 cells were cultured in Eagle’s essential medium (30-2003, Gibco), with 10% FBS (35-076-CV, Corning, Corning, NY) and 1% penicillin and streptomycin added to both media. The incubator was set at 37°C and 5% CO2, and the medium was changed as needed. UM-SCC1, UM-SCC46, and UM-SCC47 (the squamous cell lines referenced in Lu et al. [18]) were obtained from the University of Michigan, USA and were cultured in McCoy’s 5A medium (Thermo Fisher Scientific, Waltham, MA) or Dulbecco’s modified Eagle’s medium (Thermo Fisher Scientific) with 10% FBS and 1% penicillin and streptomycin. The process of culture and passage was the same as before, and the cells used for each experiment were passaged no more than 15 times. These media were purchased via Runchen Biotechnology Co., Ltd. (Guangzhou, China).

4) Chemical reagents, drug treatment, and corresponding antibodies

Cells were seeded at 60%-70% density 24 hours before treatment. The chemotherapeutic drug CDDP (S1525, Selleck Chemical, Houston, TX) was prepared with fresh cell medium or PBS at the appropriate concentration as required. The Wee1 small-molecule specific inhibitor AZD1775 (S1166, Selleck Chemical) was diluted to 5 μg/mL in cell medium. Nocodazole (938459-18-8, Sigma, St. Louis, MO), which is a drug that arrests cells in G2 phase of the cell cycle, was prepared at 100 ng/mL in PBS. Human TNFα (10 μg/mL) was obtained from Guangzhou Jisai Biotechnology Co., Ltd. (Guangzhou, China). The primary antibodies used in this study targeted the following proteins: Wee1 (95 kD, #5285, Santa Cruz Biotechnology, Inc.), CDC2 (34 kD, #9116S, Cell Signaling Technology, Inc., Danvers, MA), pCDC2Y15 (34 kD, #8242S, Cell Signaling Technology, Inc.), IKKα (85 kD, #1930S, Cell Signaling Technology, Inc.), IKKβ (87 kD, #8943, Cell Signaling Technology, Inc.), RelA (65 kD, #8242S, Cell Signaling Technology, Inc.), pRelAS536 (65 kD, #3033S, Cell Signaling Technology, Inc.), IκB (39 kD, #9247, Cell Signaling Technology, Inc.), cyclin D1 (36 kD, #2922, Cell Signaling Technology, Inc.), Bcl-2 (26 kD, #15071, Cell Signaling Technology, Inc.), PARP (116 kD, #9532, Cell Signaling Technology, Inc.), cleaved caspase-3 (17 kD, #9662, Cell Signaling Technology, Inc.), and β-actin (42 kD, #ab8226, Abcam, Inc., MA). The secondary antibodies anti–rabbit-594 (zf-0416, zsgbbio, Beijing, China) and anti-mouse-488 (zf-0412, zsgbbio) were selected based on the species of the primary antibody. The concentration of the β-actin antibody and secondary antibody was 1:2,000, and the concentration of other primary antibodies was 1:500. These reagents, drugs, and corresponding antibodies were purchased via Runchen Biotechnology Co., Ltd.

5) Cell transfection

Wee1-specific small interfering RNA (si-Wee1) and negative control siRNA were purchased from Gisai Biotechnology Co., Ltd. (Guangzhou, China). Twenty-four hours before the experiment, 200 pmoL si-Wee1 and an appropriate expression vector (20 μg Flag-pcDNA3-Wee1, Guangzhou Jisai Biotechnology Co., Ltd.) were transfected into cells using Lipofectamine 2000 transfection reagent (Thermo Fisher Scientific) according to the manufacturer’s instructions [19]. Blank flag-pc-DNA3 (Thermo Fisher Scientific) and control siRNA (contr-si) were used as controls. The transfection efficiency was verified by western blot analysis.

2. Cell toxicity and proliferation assay

A Cell Counting Kit-8 (CCK-8) cell viability kit (Dojindo Molecular Technologies, Dojindo, Japan) was used to measure cell proliferation. OS cells or UM-SCC cells were seeded into 96-well plates at 5,000 cells per well. The cells were cultured for 24 hours, and the time was set to day 0. Cells were treated with different concentrations of either AZD1775 or cisplatin alone. The optical density (OD) values were measured on day 0, day 1, day 3, and day 5, at which point 10 μL CCK-8 staining solution was added to each well and incubated at 37°C for 2 hours. A multimode microplate reader (Synergy2, BioTek, Winooski, VT) was used to read the OD value at 450 nm. Each sample had six replicates, and the data were calculated and are expressed as the mean plus standard deviation (SD). Inhibitory rates were calculated by Microsoft Excel, and the half-maximal inhibitory concentration (IC50) values were calculated using PRIM 5.0 software (Mersenne Research, Inc., CA).

3. Western blot

Western blot assays were performed with the corresponding antibodies, and the experimental procedures are described in the abovementioned literature [20]. Briefly, the cells were transfected at 60%–70% confluency, and the blank vector was used as a control. After the cells were cultured for 24 hours, the cells were lysed with sodium dodecyl sulfate lysis buffer, and the protein concentration in the cell lysates was determined. Twenty-five micrograms of lysates were taken from each sample and denatured in a water bath at 95°C before sample loading. The samples were blocked in Odyssey blocking buffer for one hour and incubated overnight with the corresponding primary antibody at 4°C. Then, the secondary antibody was incubated at room temperature for 1 hour, and the signals were visualized by Li-COR Biosciences (Lincoln, NE). All protein bands were standardized to that of β-actin.

4. Coimmunoprecipitation assay

The antibodies used in the coimmunoprecipitation (co-IP) experiment are described above. According to the instructions, the co-IP assay was performed using a Dynabead coimmunoprecipitation kit (Thermo Fisher Scientific) [20]. In short, whole-cell lysates were obtained using lysis buffer containing a protease inhibitor mixture (of 10 μL/mL). Then, 500 μg of whole-cell lysate was incubated with the prepared Dynabeads at a final concentration of 1:10 antibody and cultured overnight at 4°C. The antibodies and beads were then separated by magnetic column precipitation. The IP complex was disrupted by incubating on a heating block at 95°C for 5 minutes. The pulled-down proteins were electrophoresed on the prefabricated gel and analyzed by western blot (as described above). Nonimmunized rabbit IgG or mouse IgG was used as a negative control.

5. Confocal immunofluorescence assay

The experimental procedures are shown in the aforementioned literature [20]. OS cells (2×10⁴/well) were seeded into chamber slides (BD Biosciences, San Jose, CA). The cells were placed in a cell incubator and allowed to adhere to the surface. After 24 hours of drug treatment, the medium was removed, and the slides were sealed, blocked, and incubated overnight with primary antibody. The next day, the cells were cleaned and treated with DAPI in the dark. Images were taken under an LSM 780 confocal microscope.

6. Cell cycle assay

A cell cycle detection kit (Nanjing Kegan Biotechnology Co., Ltd., Nanjing, China) was used to detect cell cycle progression according to the manufacturer’s instructions [20]. Briefly, OS cells were placed in a 12-cm cell culture dish and cultured in a CO2 incubator at 37°C for 24 hours. The medium was then replaced with fresh medium containing AZD1775 (1 μM), CDDP (5 μM), and/or TNFα (10 ng/mL) for 24 hours. Cells were then dissociated by trypsin, washed, harvested, and fixed with 70% ethanol, and cell cycle analysis was performed with propidium iodide staining. The samples were analyzed by flow cytometry (BD Biosciences). FlowJo 9.3.0 software (TreeStar Inc., Ashland, OR) was used to calculate the percentage of cells in different stages of the cell cycle. Cells were grown in fresh medium containing DMSO (0.1%) as a control.

7. Animal experiments

Female BALB/c mice aged 5 weeks were purchased from the animal department of the Southern Medical University of China. All mice were raised in animal facilities approved by Southern Medical University in accordance with the guidelines of the Animal Experiment Center of the Southern Medical University of China. In brief, 2 mm3 PDX-OS3 tissue blocks were injected under the proximal axilla of the right forelimb of mice. When the xenograft on the right side reached approximately 350 mm3 in volume, the mice were treated (5 grafts per treatment group). Animals were intraperitoneally injected with CDDP (5 mg/kg in 0.9% isotonic saline solution once a week) and AZD1775 (50 mg/kg, oral gavage, twice a week) either alone or in combination. All drugs were prepared for 3 weeks of use. The mice in the control group only received the vehicle. The tumor volume (mm3) and weight were measured. The volume was calculated with the formula V=1/2L×W2.

8. Statistical methods

The data collected in the study were analyzed by SPSS ver. 19.0 software (IBM Corp., Armonk, NY). Each sample was analyzed in triplicate or sextuplicate. Data are expressed as the mean±SD. Two-tailed t tests or chi-square tests were used to compare the differences between two groups. Differences among three or more groups were compared using one-way analysis of variance (ANOVA) combined with Dunnett’s post hoc test, repeated-measurements ANOVA or the chi-square test. The difference was statistically significant when p < 0.05.

Results

1. Heterogeneity of the expression of Wee1/CDC2 and NF-κB signaling pathway molecules exists and is affected by the antitumor drug CDDP in tumor cells with variable IC50 values of AZD1775 and CDDP

As mentioned previously, studies have shown that Wee1 [10,13] and NF-κB signaling pathway molecules [6,11] are involved in the CDDP drug response in OS cells. In this study, western blotting was used to detect the expression heterogeneity of proteins related to NF-κB and Wee1/CDC2 signaling (e.g., IKKα, IKKβ, IκB, and RelA) in a variety of tumor cells, including conventional OS cells such as Saos2, U2OS, and MG63, and in the head and neck squamous cell carcinoma cell lines UM-SCC1, UM-SCC46, and UM-SCC47 under basal culture and after CDDP treatment (Fig. 1A and B). Western blot assay results showed that the abundance of Wee1 and CDC2 proteins in the conventional OS cell lines under basal culture showed significant differences, and the descending order in cells was Saos2, U2OS, and MG63. In addition, there were also significant differences in the expression patterns in head and neck squamous carcinoma cells (UM-SCC1 < UM-SCC47 < UM-SCC46). The NF-κB signaling proteins IKKα, IKKβ, IκB, and RelA were heterogeneously expressed in the above tumor cell lines, and the same tumor cell lines with the highest abundance of Wee1 and CDC2 also had the highest abundance of these four proteins. Interestingly, the protein levels of Wee1, CDC2, IKKα, IKKβ, and RelA were increased and that of IκB was decreased after CDDP treatment for 6 hours in OS cells and head and neck squamous carcinoma cells.
The IC50 of a drug represents the capacity of cells to endure continued exposure to the drug. Therefore, this panel of tumor cells was treated with CDDP and the Wee1-specific small-molecule inhibitor AZD1775 to test their tolerance to these drugs (Table 1). First, the IC50 value of CDDP was higher in Saos2 cells than in U2OS and MG63 cells (15.643±0.193 μM, 10.793±0.097 μM, and 7.873±0.161 μM, respectively). Second, the IC50 values of CDDP in the head and neck squamous carcinoma cell lines UM-SCC1, UM-SCC46, and UM-SCC47 were 5.612±0.713 μM, 15.331±0.122 μM, and 17.231±0.211 μM, respectively. Similarly, the IC50 value of AZD1775 in these panel tumor cells showed the same trend as that of CDDP. In conventional OS cell lines, Saos2 > U2OS > MG63 was observed (297.478±17.378 nM, 222.327±11.278 nM, and 202.156±9.379 nM, respectively). In the head and neck squamous carcinoma cell lines UM-SCC1, UM-SCC47, and UM-SCC46, the IC50 values also increased successively (267.452±20.313 nM, 361.722±15.622 nM, and 372.125±17.236 nM, respectively) (Table 1).
Considering the heterogeneity of cancer, the above experiments were also repeated on three PDX-derived OS cell lines, PDX-OS1, PDX-OS2, and PDX-OS3. PDX-OS1 and PDX-OS2 were derived from patients with surgically resected OS who showed an excellent response to neoadjuvant chemotherapy, and PDX-OS3 was derived from OS cells of patients with CDDP-resistant OS. The results showed that IKKα, IKKβ, IκB, and RelA were heterogeneously expressed in the three PDX-OS cell lines, and the abundance of these four proteins was consistently the highest in PDX-OS3 cells (Fig. 1C). In addition, similar to commercially available tumor cell lines, the abundance of Wee1, IKKα, IKKβ, and RelA proteins was increased and that of IκB was decreased after 6 hours of treatment with CDDP. In addition, the IC50 values of CDDP and AZD1775 in PDX-OS1, PDX-OS2, and PDX-OS3 cells were 9.215±0.203 μM, 11.712±0.172 μM, 49.219±0.618 μM, and 237.891±27.88 nM, 245.791±23.475 nM, and 301.256±19.578 nM, respectively.
In summary, the above experimental data indicated that in conventional OS cells, Saos2 cells were more resistant to CDDP than U2OS and MG63 cells. PDX-OS3, similar to Saos2 cells, was derived from OS tissue from a patient in whom multiple chemotherapeutic agents had failed, including CDDP, and showed stronger resistance to CDDP than PDX-OS1 or PDX-OS2. In addition, in these two groups of OS cells, Wee1, CDC2, and proteins in the NF-κB signaling pathway were enriched and simultaneously affected by the antitumor drug CDDP. Therefore, the Wee1/CDC2 molecular axis and the NF-κB signaling pathway may have a key relationship with CDDP efficacy or resistance.

2. High basal protein expression of the Wee1/CDC2 axis and NF-κB signaling pathway components was activated under TNFα or CDDP treatment, and this activation was abolished by Wee1 inhibition

Although CDDP affects the protein expression of Wee1/CDC2 and NF-κB signaling pathway molecules, it is not known whether both are activated simultaneously. Activation of the NF-κB signaling pathway is an important step that protects the survival of tumor cells under CDDP stress [4]. The inflammatory factor TNFα is a key upstream molecule that activates the classical NF-κB pathway. The above experiments showed that the levels of the IκB molecule in the NF-κB signaling pathway decreased in OS cells treated with CDDP, strongly suggesting that the NF-κB pathway may be activated. Phosphorylation at S536 of RelA/NF-κB indicates that the NF-κB signaling pathway is activated. On the other hand, previous studies have shown that Wee1 phosphorylates CDC2 at Y15, indicating that CDC2 is activated, leading to the consequent transition of the cell cycle from G2 to M phase [12]. In this study, TNFα was used as a positive control. The results of western blotting showed that in Saos2 (Fig. 2A) and PDX-OS3 (Fig. 2B) cells, compared with the levels in basal culture, phosphorylation of RelA-S536 and CDC2-Y15 increased significantly after TNFα treatment. In addition, CDDP treatment or overexpression of Wee1 in OS cells enhanced phosphorylation, but this effect was less pronounced than that after TNFα treatment (Fig. 2A and B). TNFα combined with overexpression of Wee1 treatment in these cells had a cumulative effect. Similarly, TNFα combined with CDDP increased the phosphorylation of RelA-S536 and CDC2-Y15 compared with that in cells treated with CDDP alone. However, AZD1775 treatment alone reduced both CDC2-Y15 and RelA-S536 phosphorylation, and AZD1775 combined with TNFα or CDDP significantly reduced the effect of increased CDC2-Y15 and RelA-S536 phosphorylation.
Consistent with previous studies, the above experimental results show that TNFα can significantly activate the NF-κB signaling pathway in Saos2 and PDX-OS3 cells. Surprisingly, TNFα also significantly activated the Wee1/CDC2 molecular axis in OS cells. Increased Wee1 protein levels also enhance activation of the NF-κB signaling pathway. Thus, the activation of both the Wee1/CDC2 molecular axis and NF-κB signaling pathway has a synergistic effect; in addition, the results indicate that the activation of both the NF-κB signaling pathway and the Wee1/CDC2 molecular axis is involved in the responses of Saos2 and PDX-OS3 cells to CDDP-induced stress injury. Moreover, AZD1775 inhibited the Wee1/CDC2 molecular axis and simultaneously abolished the effect of both TNFα and CDDP on the NF-κB signaling pathway in OS cells. However, the basal levels of NF-κB signaling pathway proteins and Wee1/CDC2 were low in PDX-OS1 (Fig. 2C), U2OS and MG63 (data not shown) OS cells, and the expression of these molecules diminished in the presence of CDDP. Correspondingly, the inhibitory effect of AZD1775 on CDDP or TNFα was also significantly weakened.

3. Physical binding of Wee1 to RelA in OS cells is modulated by CDDP, and Wee1 modulates the translocation of RelA into the nucleus
The above experiments show that CDDP can simultaneously activate the Wee1/CDC2 molecular axis and NF-κB signaling pathway in OS cells, especially when the proteins in these pathways are enriched. Whether the interaction between the Wee1/CDC2 molecular axis and NF-κB signaling pathway molecules is direct or indirect is still unknown.
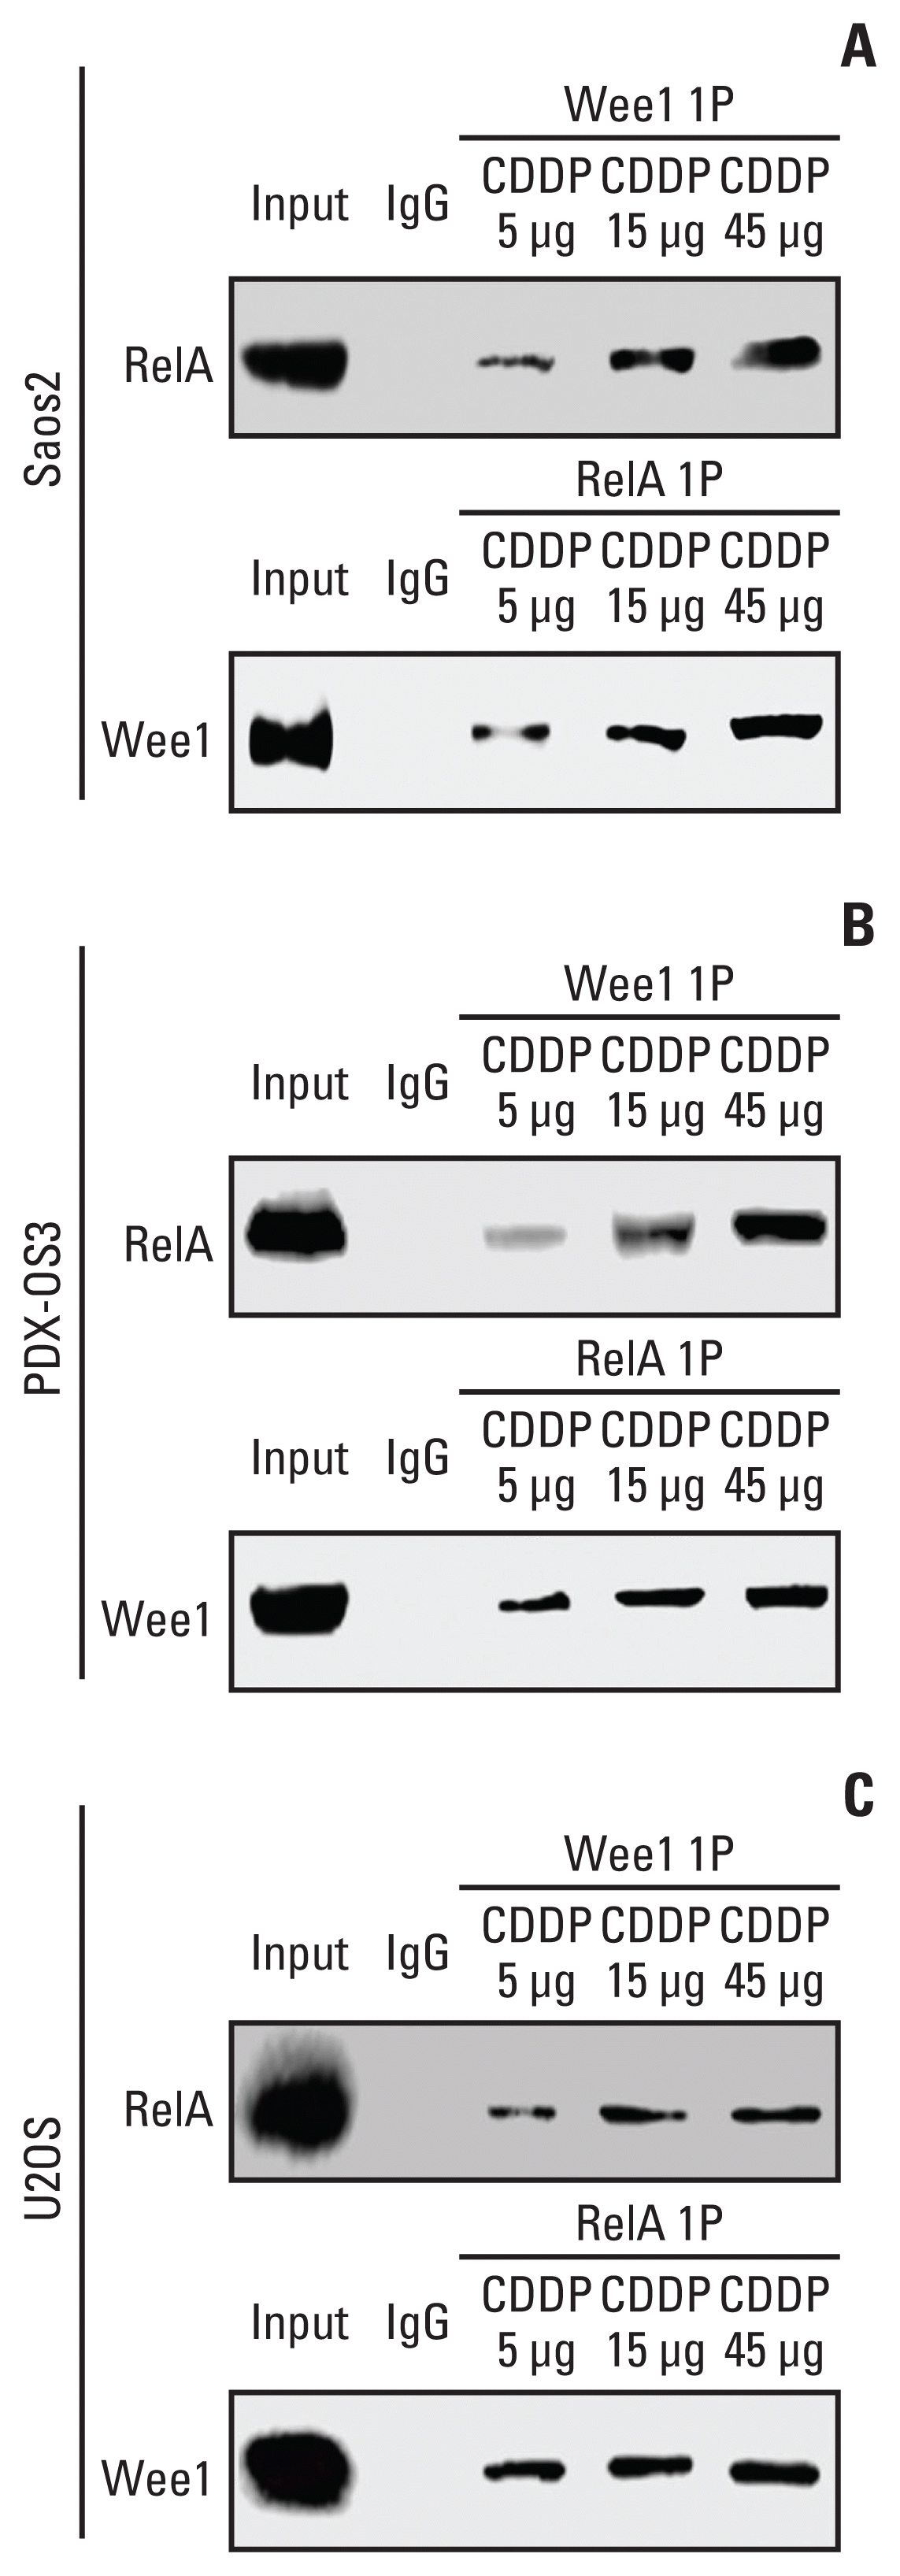
Co-IP experiments in this study showed that in Saos2 (Fig. 3A), PDX-OS3 (Fig. 3B) and U2OS (Fig. 3C) cells treated with stepwise concentrations of CDDP (5, 15, and 45 μg/mL), Wee1 and RelA physically interacted with each other in a dose-dependent manner, especially in Saos2 and PDX-OS3 cells.
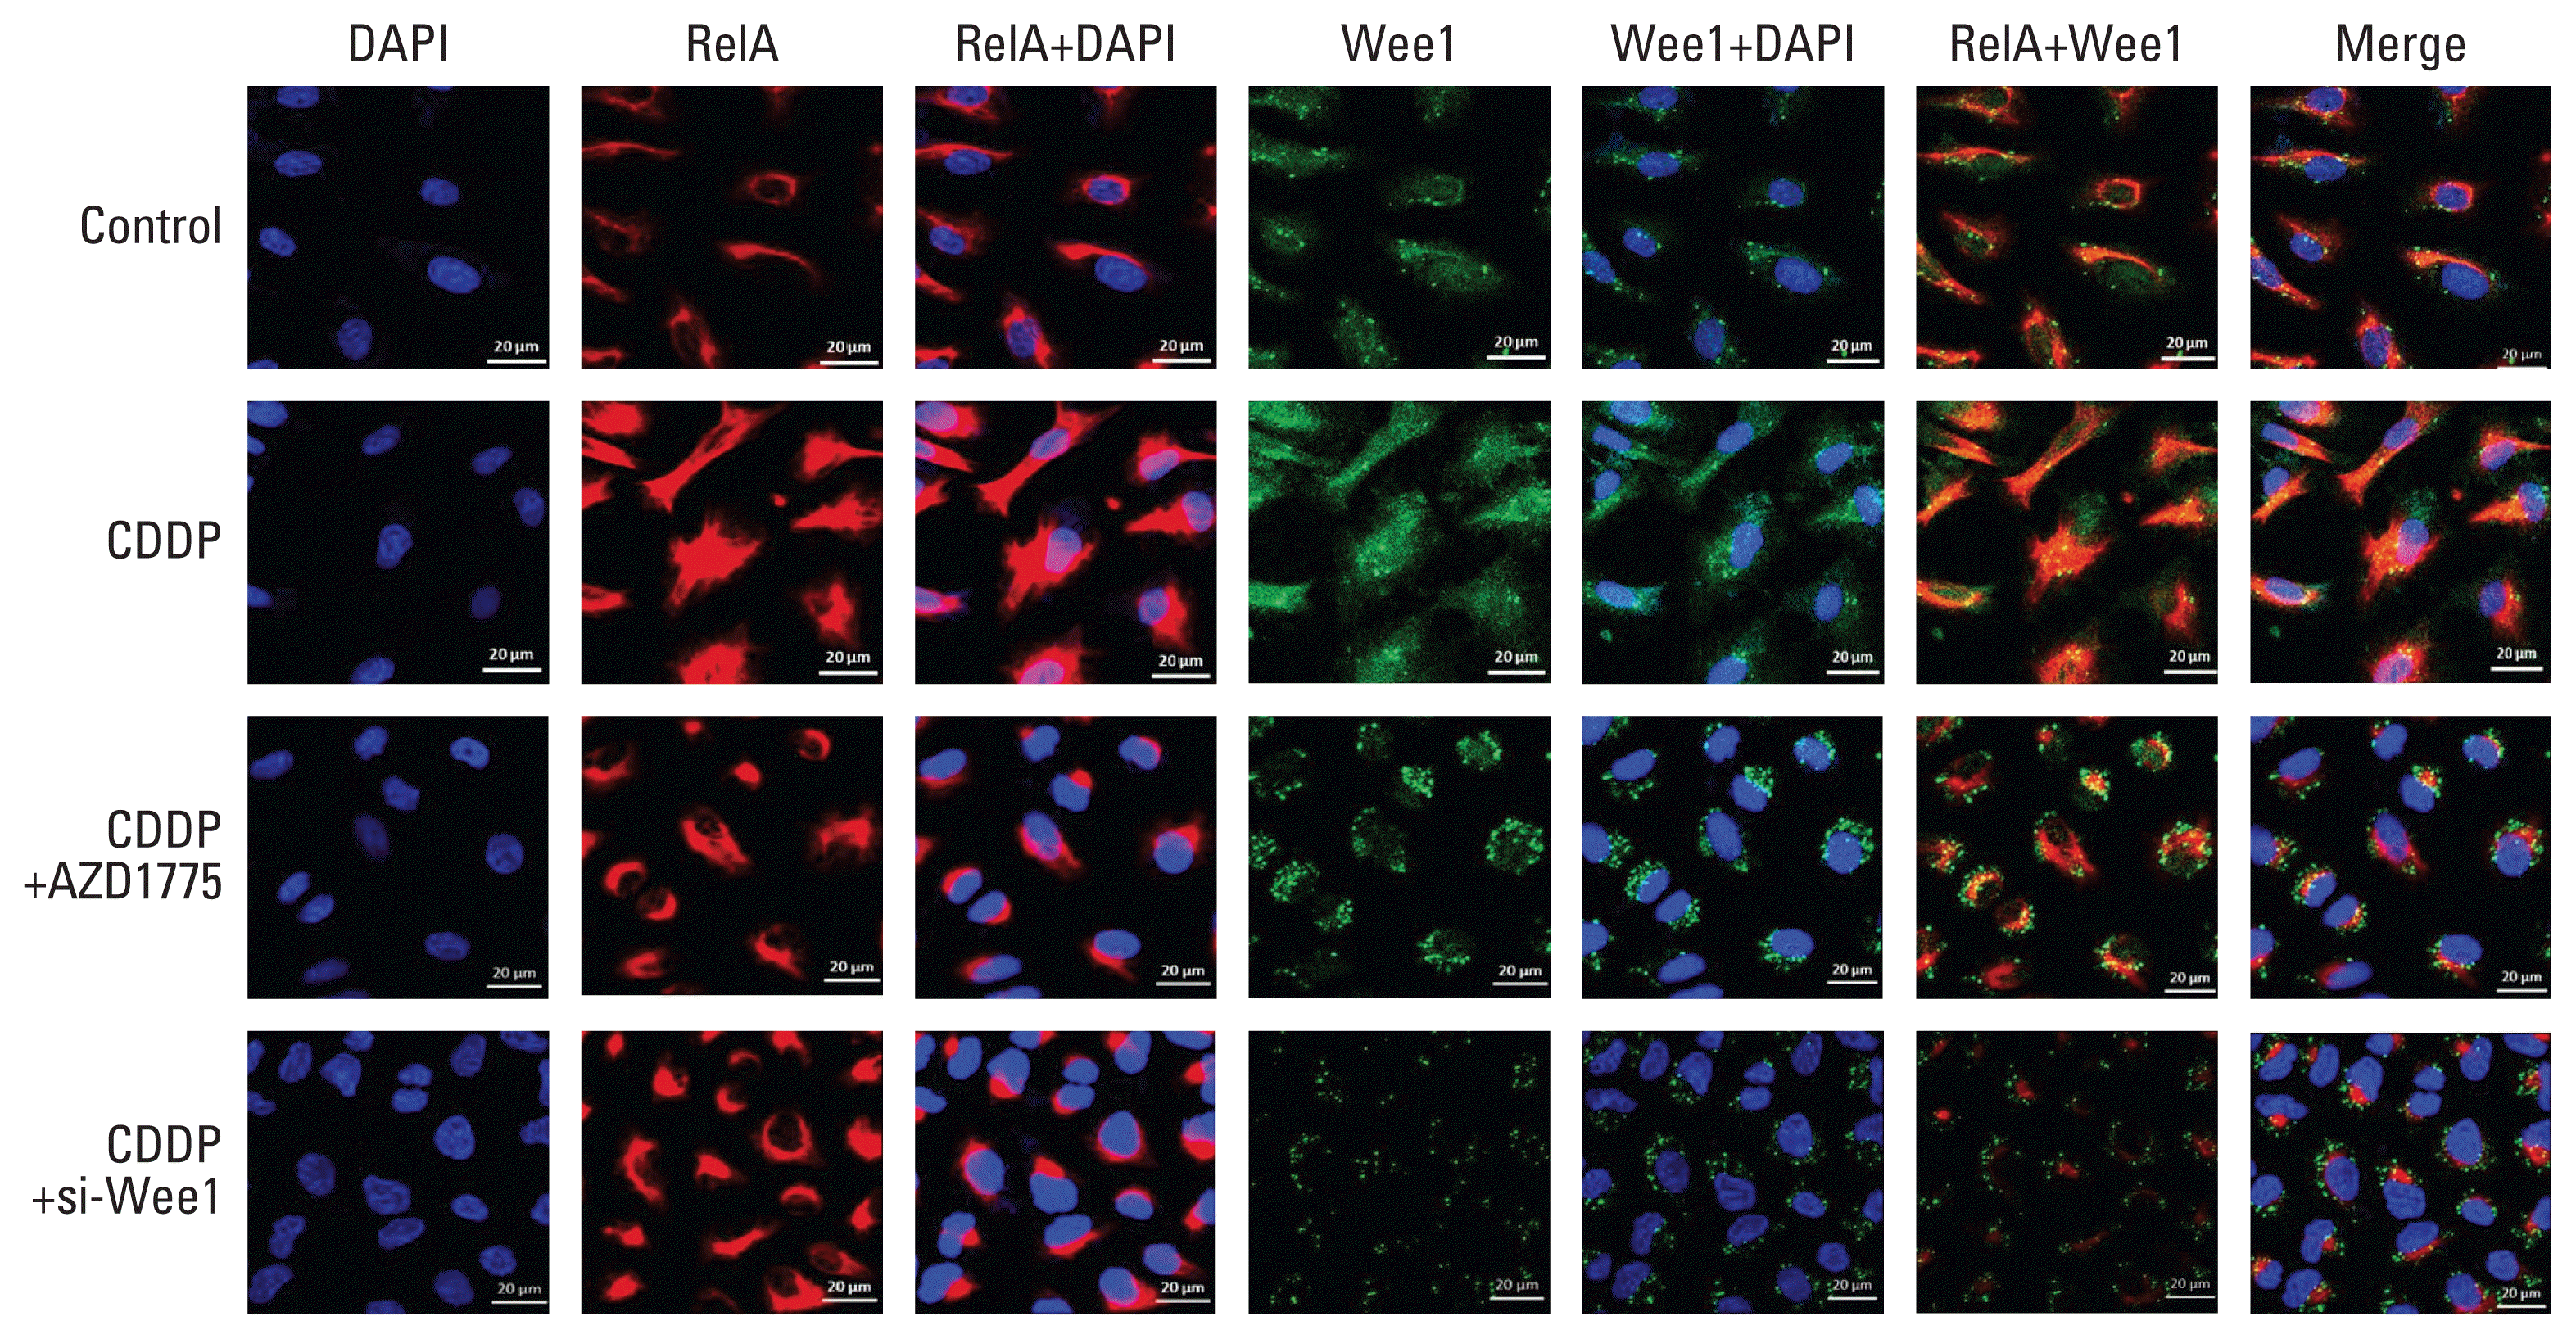
In addition, confocal immunofluorescence experiments in PDX-OS3 cells (Fig. 4) showed that compared with the control group (Fig. 4, row 1), the CDDP treatment group showed a stronger distribution of the red fluorescence signal of RelA and the green fluorescence signal of Wee1 in cells in both the cytoplasm and nucleus (Fig. 4, row 2). Interestingly, in cells treated with CDDP and AZD1775 (Fig. 4, row 3), the RelA red fluorescence signal was still mainly distributed in the cytoplasm but was congested around the nucleus. The Wee1 green fluorescence signal was diffusely distributed in the cytoplasm, which was significantly different from the pattern after CDDP treatment alone. Consistent with CDDP combined with AZD1775 treatment, cells treated with CDDP and siRNA-Wee1 showed obvious congestion of the RelA red fluorescence signal around the nucleus (Fig. 4, row 4).
These experimental data indicate that upon CDDP treatment, RelA in the NF-κB signaling pathway and Wee1 molecules aggregate, bind to each other and transactivate each other in response to DNA damage stress. RelA is phosphorylated and translocates into the nucleus, which is assisted and synergized by Wee1. When AZD1775 inhibited Wee1 or when siRNA was used to knock down Wee1, RelA congregated around the nucleus, but the nuclear translocation of RelA was severely impeded.

4. Inhibition of Wee1 restores the effect of CDDP on cell cycle progression, proliferation and survival in CDDP-resistant OS cells
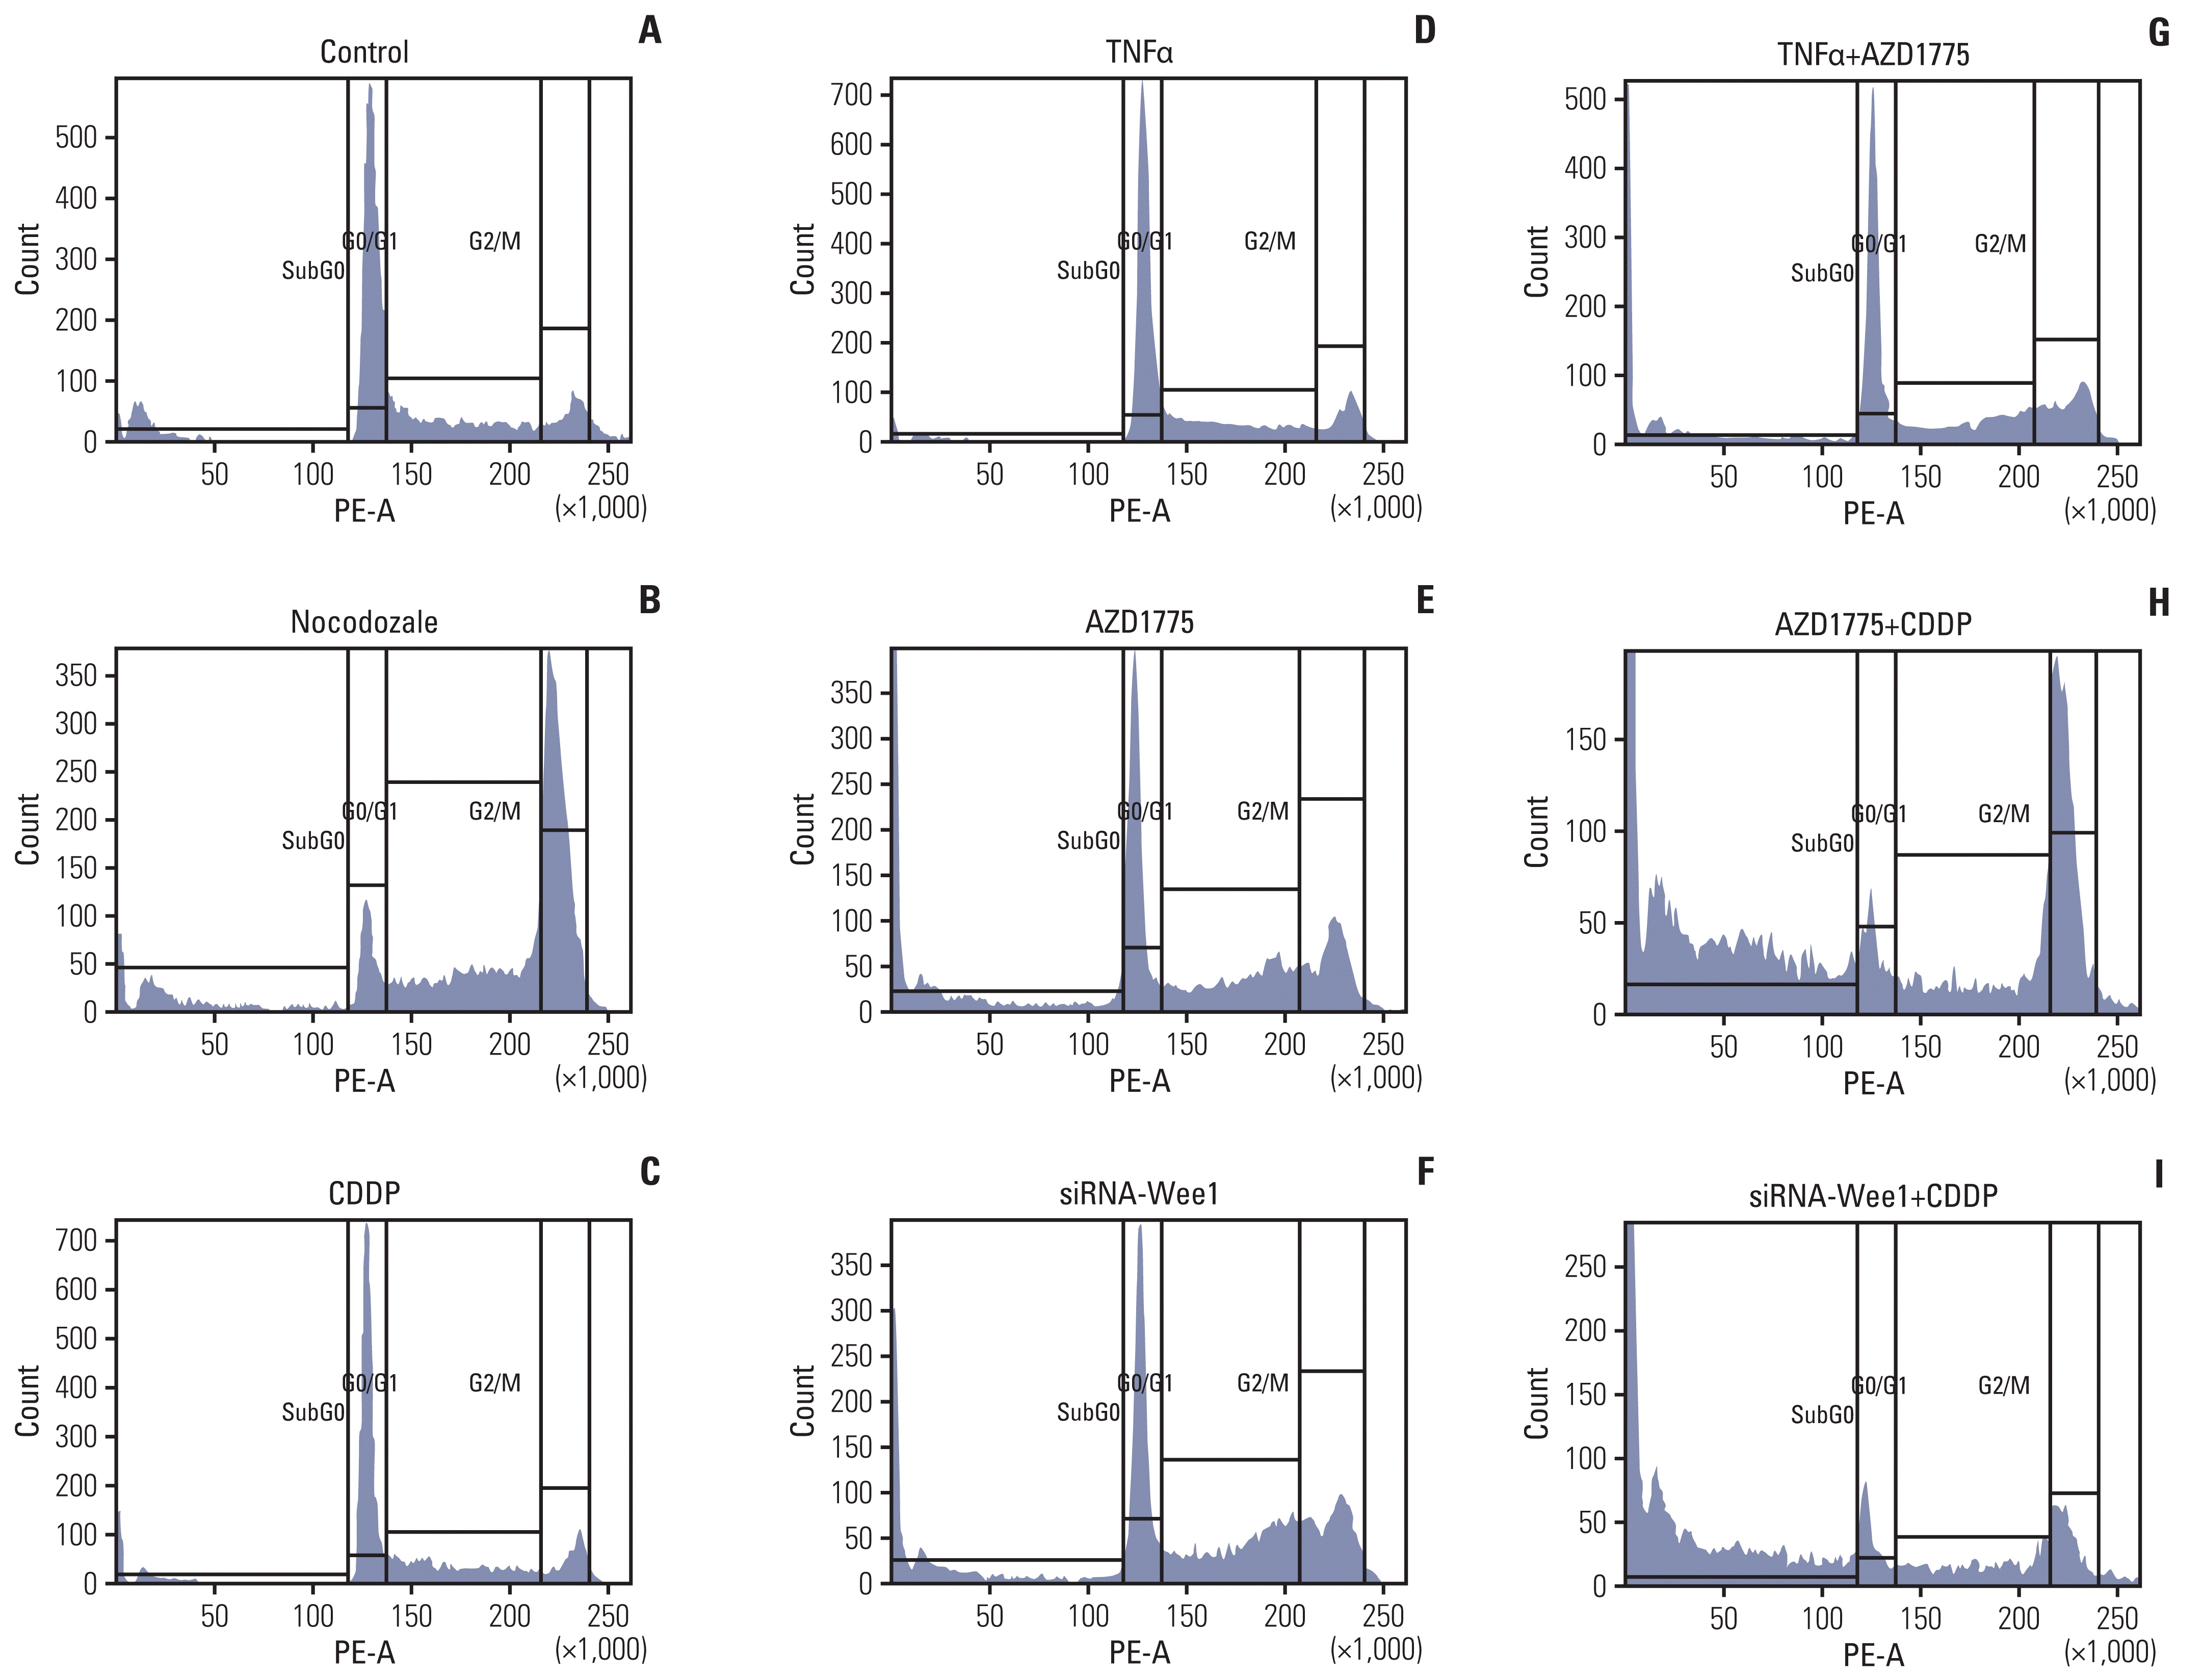
Nocodozale is a G2 phase inhibitor [21], and Wee1 is a G2-M transitional checkpoint kinase. When AZD1775 inhibits Wee1, cells accelerate the transition from G2 to M phase, which can easily cause mitotic catastrophe and cell death [10,12]. The results of the Saos2 cell cycle experiment in this study showed that compared with the control group (Fig. 5A), the nocodozale treatment group had a significant reduction in the proportion of G0/G1 phase cells (Fig. 5B) and a significant increase in the proportion of G2/M phase cells. In the group treated with CDDP alone (Fig. 5C) or TNFα alone (Fig. 5D), the ratio of cells in each phase did not significantly change. However, in the AZD1775 (Fig. 5E) and Wee1-specific siRNA treatment groups (Fig. 5F), the proportion of cells in G0/G1 phase decreased, and the proportions of cells in G2/M and sub-G0 (cell debris, non-G0/G1, non-G2/M) phases significantly increased. In the group treated with TNFα in combination with Wee1 inhibition (Fig. 5G), there was no obvious effect on the ratio of cells in the different phases. However, in the CDDP treatment combined with Wee1 inhibition (by AZD1775 or siRNA treatment), the ratio of G0/G1 phase cells was significantly reduced, the ratio of G2/M phase cells was significantly increased, and the ratio of sub-G0 phase cells was the most significantly increased (Fig. 5H and I).
The above experimental data show that nocodozale, as a positive control, can indeed arrest Saos2 OS cells in G2 phase. However, unlike nocodozale, the inhibition of Wee1 causes the cell to lose the protection of the cell cycle checkpoint, which subsequently leads to the acceleration of the transition of cells into mitosis without protection and results in catastrophic mitotic damage. Obviously, in the TNFα treatment group, the mitotic disasters of the cells were reduced, which supported that TNFα has a protective effect on Saos2 cell cycle progression. Therefore, similar to TNFα, Wee1 exhibits a protective effect on Saos2 cells. Although Saos2 cells have a certain tolerance to CDDP, as indicated by the CDDP treatment group, Saos2 cells did not significantly exhibit changes in cell cycle progression. In the group with Wee1 inhibition combined with CDDP treatment (in which Saos2 cells lost Wee1 protection), a large number of cells underwent mitotic catastrophe events.
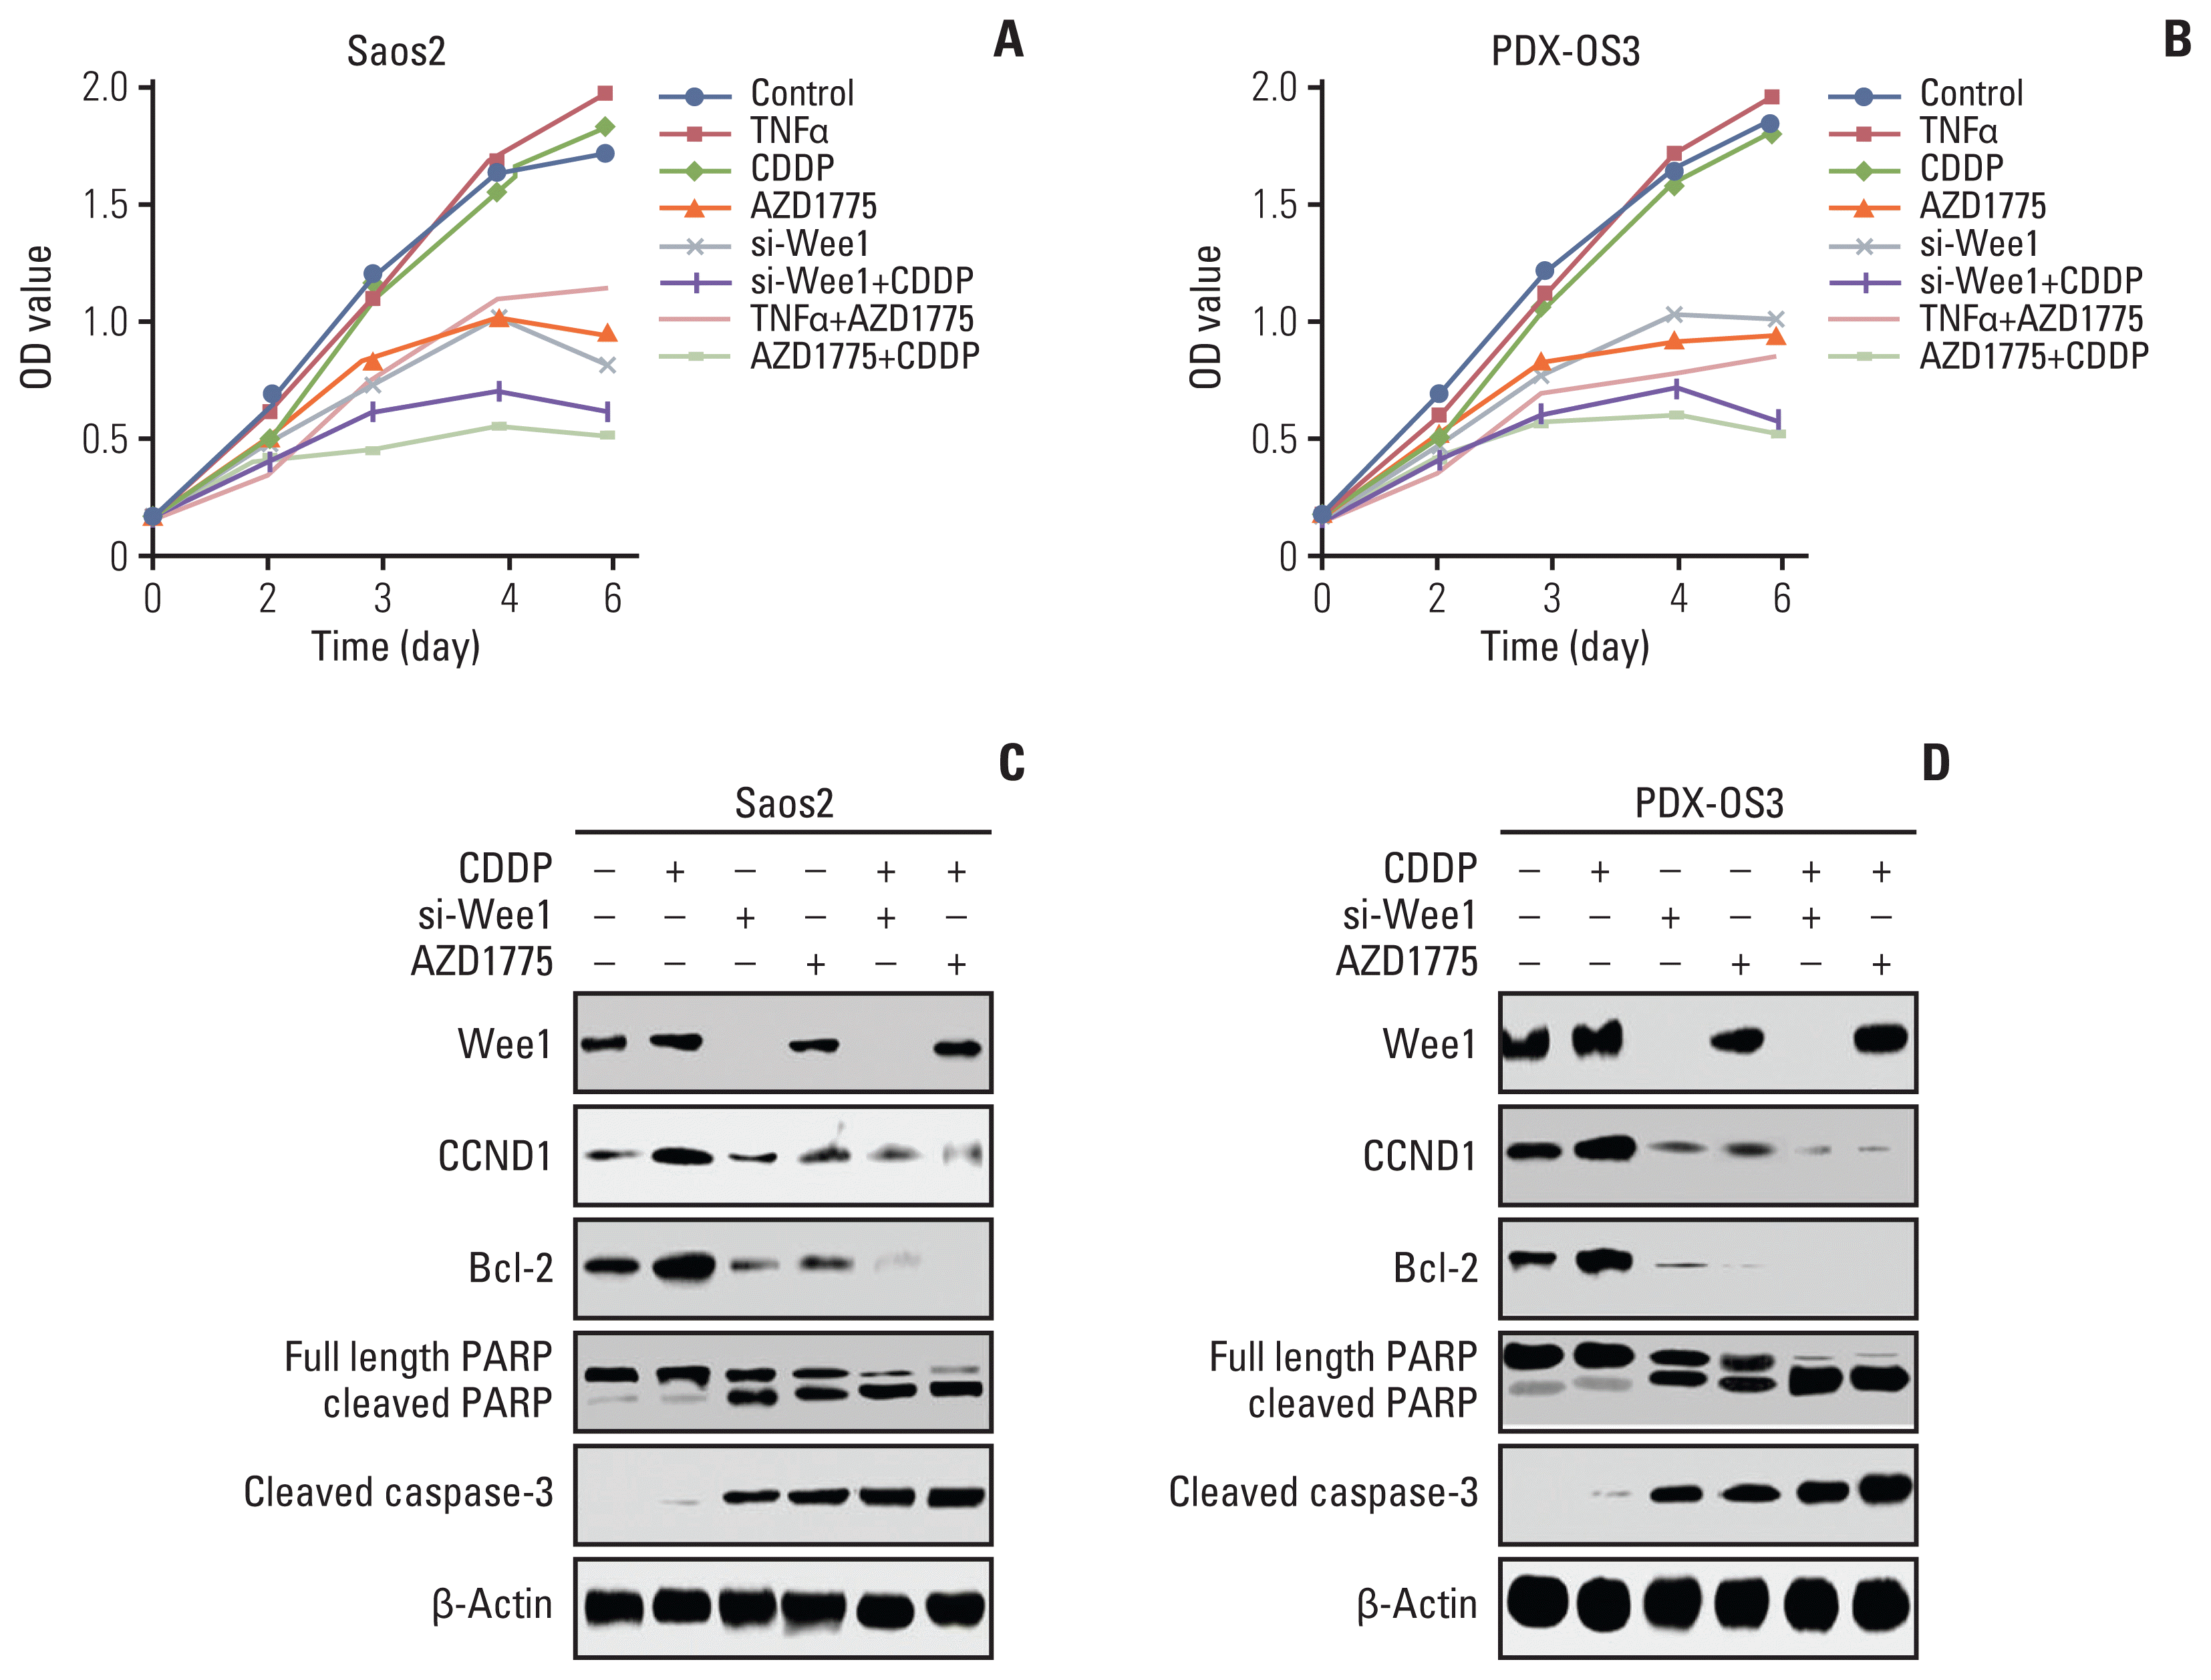
Cell proliferation experimental data showed that in Saos2 cells (Fig. 6A), the proliferation after CDDP or TNFα treatment was not significantly different from that after control treatment. The proliferation of AZD1775 and si-Wee1 treatment groups was significantly higher than that of the control group. The proliferation of the AZD1775 combined with TNFα treatment group was significantly inhibited compared with that of the TNFα treatment group, but there was no significant difference in cell proliferation compared with that of the AZD1775 treatment group. Clearly, in the CDDP combined with AZD1775 and CDDP combined with si-Wee1 groups, cell proliferation was the most significantly inhibited. In PDX-OS3 cells (Fig. 6B), the results of cell proliferation experiments were essentially similar to those of Saos2 cells.
The above cell cycle assays show that Saos2 cell cycle progression has a certain tolerance to CDDP. Additional proliferation assays showed that PDX-OS3 cells had similar characteristics to Saos2 cells, as indicated by the CDDP treatment group, in which PDX-OS3 cells did not exhibit significant proliferation changes. When CDDP was combined with AZD1775 or siRNA-Wee1, cell proliferation was severely affected, and the catastrophic events of mitosis were significant. It is unclear which type of cell death signaling pathways are initiated in these cells. Next, western blot data showed that in Saos2 cells (Fig. 6C) and PDX-OS3 cells (Fig. 6D), compared with the control group, the CDDP-treated group had significantly increased levels of the NF-κB downstream proteins CCND1 and Bcl-2; however, the protein levels of apoptosis-related full-length PARP and cleaved PARP did not change significantly, whereas that of cleaved caspase-3 only slightly increased. In the AZD1775 treatment group and the siRNA silencing Wee1 group, the levels of Bcl-2 and CCND1 decreased significantly, and full-length PARP also decreased significantly. In contrast, cleaved PARP and cleaved caspase-3 levels increased significantly. In the CDDP combined with AZD1775 and CDDP combined with si-Wee1 treatment groups, Bcl-2 and CCND1 and full-length PARP protein levels were significantly reduced, while those of cleaved PARP and cleaved caspase-3 increased significantly compared with the levels of the AZD1775 group and si-Wee1 treatment groups.
The above data show that Wee1 significantly affects the cell cycle progression and proliferation of Saos2 and PDX-OS3 cells with CDDP tolerance. Inhibiting Wee1 restored the sensitivity of these cells to CDDP. The NF-κB signaling pathway and its downstream transcription targets are involved in the activation of apoptosis-related proteins, and numerous catastrophic events of cell division occur. In addition, Wee1 inhibition not only restored the sensitivity of cells to CDDP but also amplified the effects of AZD1775 on these cells.

5. AZD1775 inhibits the growth of CDDP-resistant PDX-OS, restores the cytotoxicity of CDDP toward PDX-OS, and prolongs the median survival of the host
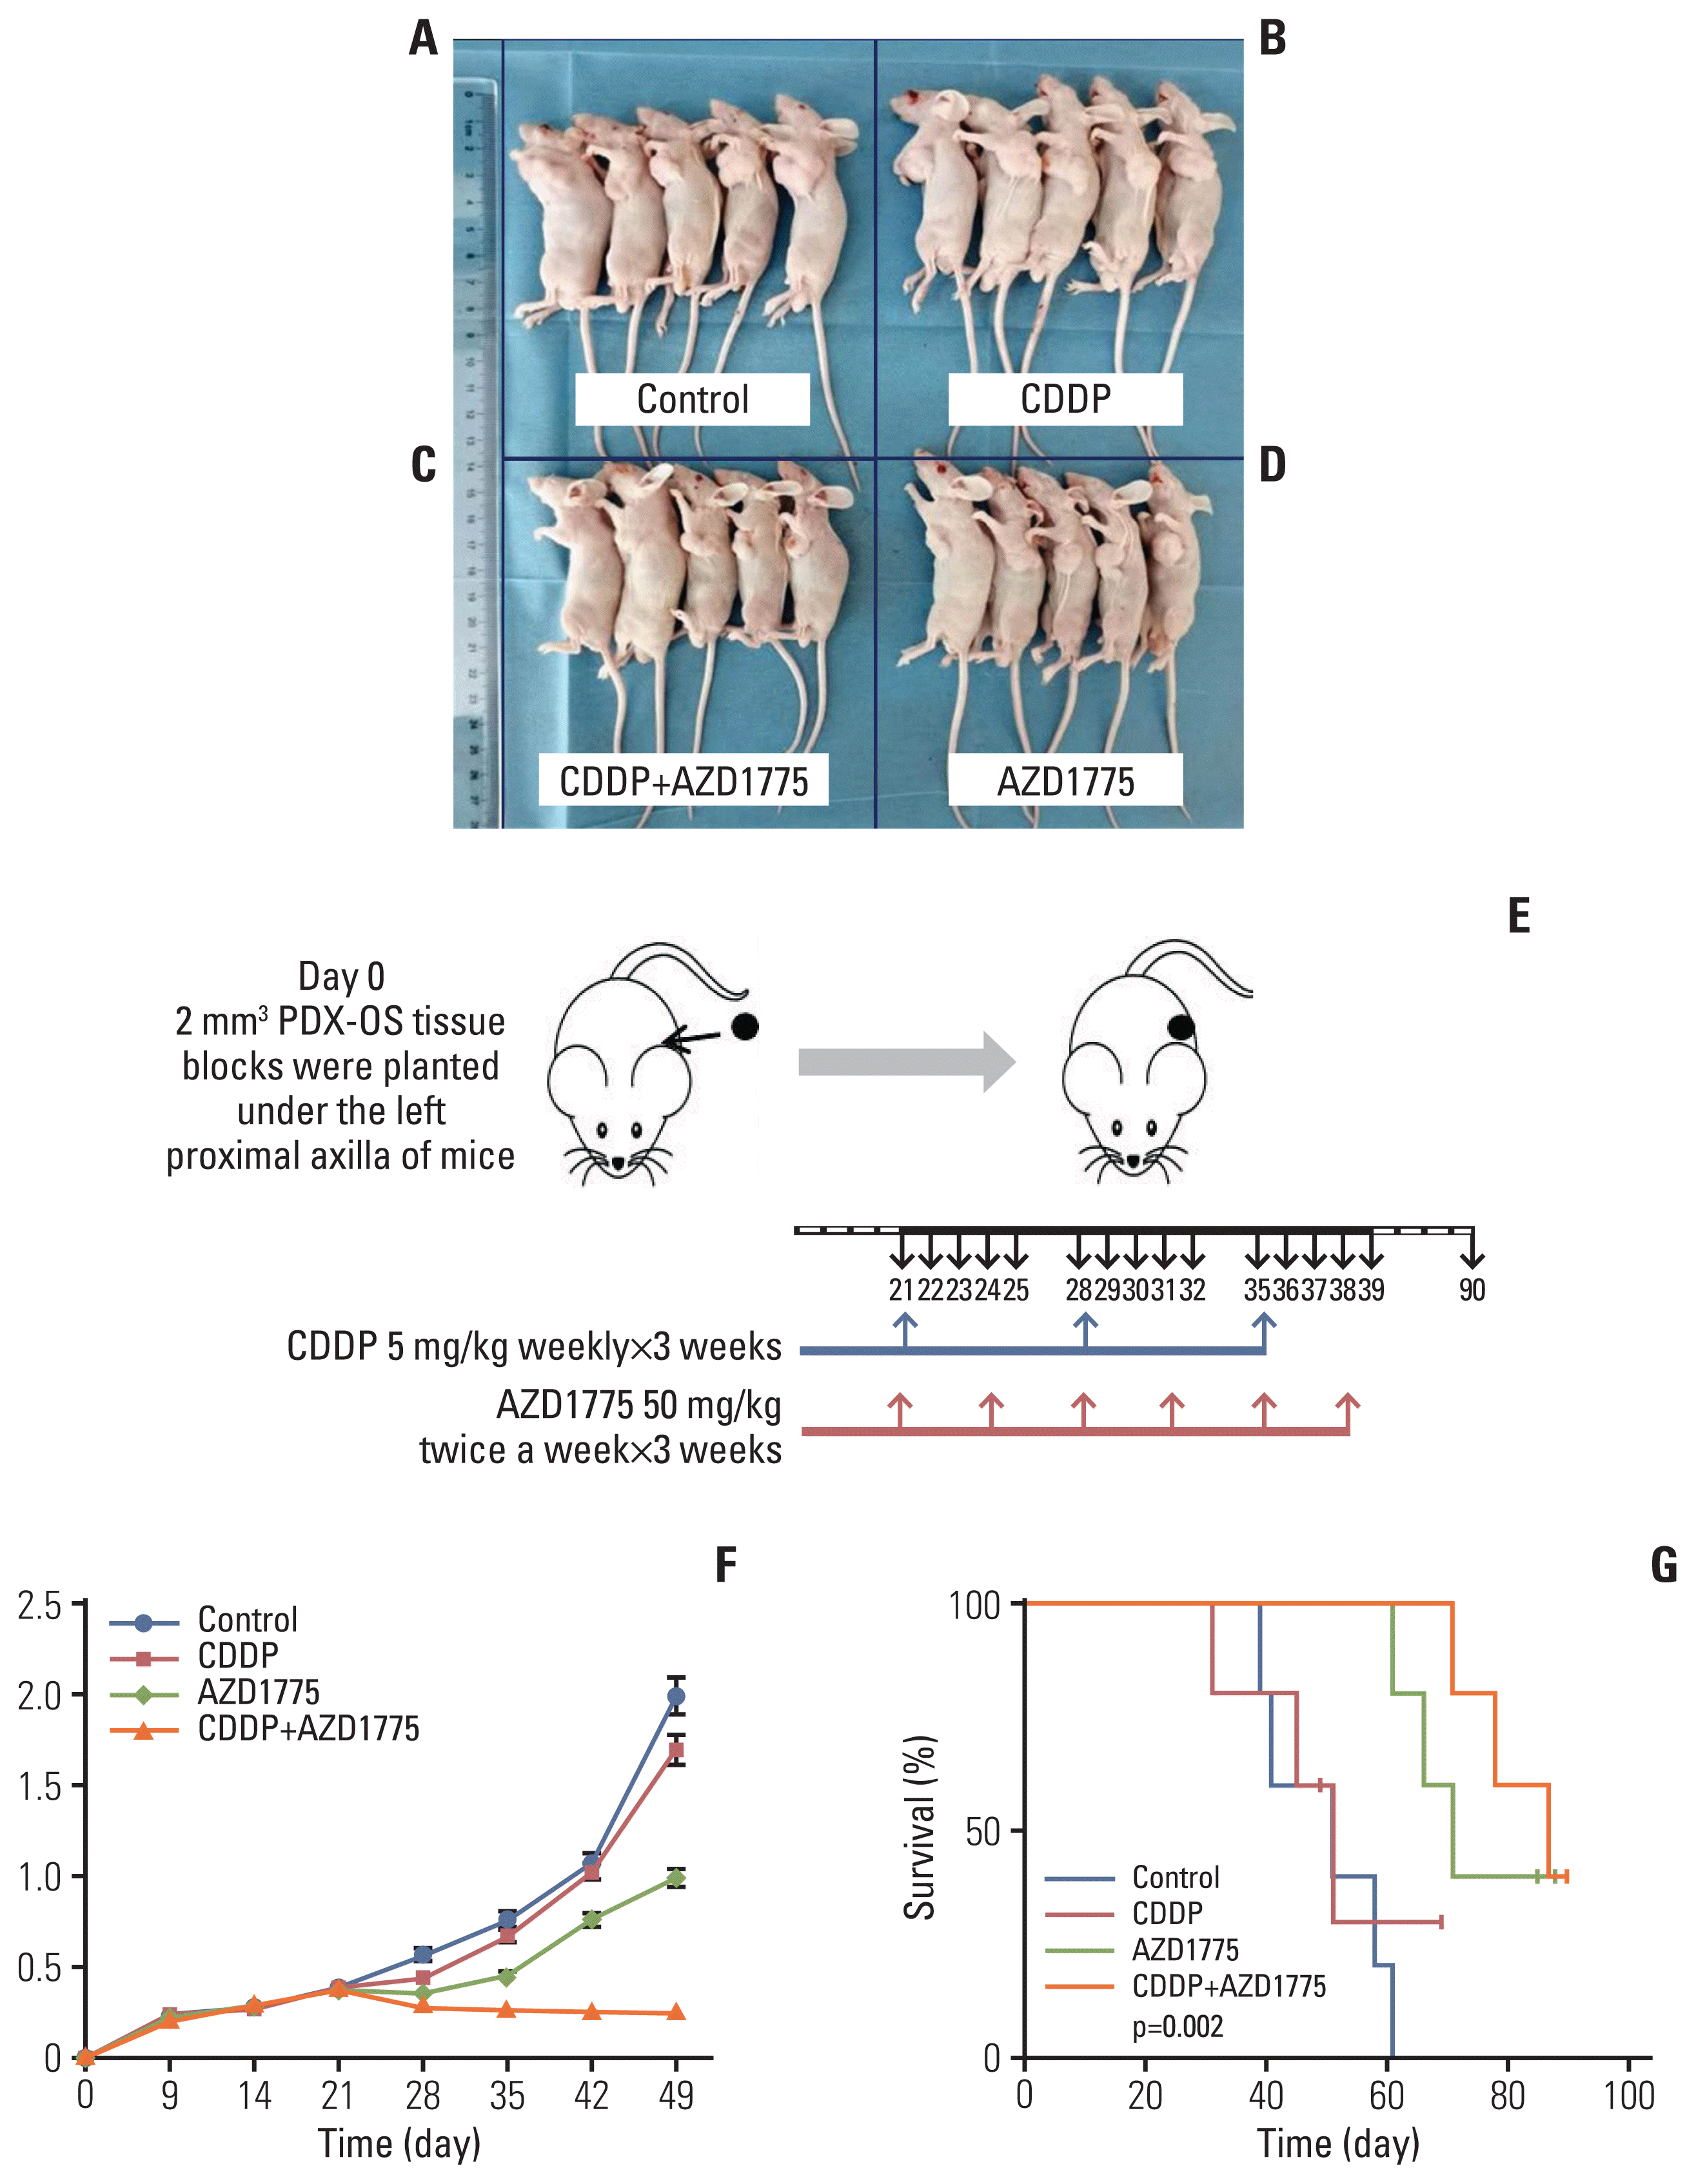
CDDP is the most widely used anti-OS chemotherapeutic drug in clinical practice, and it is also the most common drug to which cells exhibit drug resistance. To observe whether inhibition of Wee1 has an antitumor effect on CDDP-resistant OS cells in vivo, we constructed a nude mouse model with drug-resistant PDX-OS3 cells (Fig. 7) and established four treatment groups: the blank control group (Fig. 7A), CDDP treatment group (Fig. 7B), CDDP combined with AZD1775 treatment group (Fig. 7C), and AZD1775 treatment group (Fig. 7D) (5 mice per group). The experimental results (Fig. 7E–G) showed that the growth in the CDDP treatment group was the same as that in the control group. The AZD1775 treatment group showed inhibited tumor growth, and the CDDP combined with AZD1775 treatment group showed the most significant inhibition of tumor growth (Fig. 7F). Upon comparison of the median survival of tumor-bearing mice in each group, the control and CDDP treatment groups had the shortest survival times (57 days and 55 days), the AZD1775 treatment group had a longer survival time (72 days), and the AZD1775 combined with CDDP treatment group showed the longest survival time (89 days). The PDX-OS animal experimental data indicated that for CDDP-resistant OS, using AZD1775 to inhibit Wee1 can significantly inhibit tumor growth and extend the median survival of the host. CDDP combined with AZD1775 had a better effect than AZD1775 alone (Fig. 7G). This shows that inhibiting Wee1 can not only inhibit tumor growth alone but also restore the cytotoxicity of CDDP and cooperate with CDDP to treat CDDP-resistant OS.

Discussion

The heterogeneity of gene expression in cells is one of the malignant characteristics of tumors [3]. In general, the high expression of oncogenes and related signaling pathway molecules leads to enhanced activity to maintain abnormal tumor proliferation, cycle progression, drug resistance, and survival [3]. Therefore, oncogenes are often the best targets for tumor therapy. Inflammatory factors of the NF-κB family and Wee1/CDC2 are key regulators of the cell cycle in tumors [6,10]. The NF-κB signaling pathway is frequently activated when tumor cells respond to the DNA damage caused by CDDP, indicating that the NF-κB signaling pathway is involved in the development of CDDP resistance in tumor cells and plays an important role in this process [1012]. On the other hand, high expression of Wee1 exerts a key protective effect on the G2/M transition of tumor cells, and studies have also shown that Wee1 is related to multidrug resistance in OS [10,22]. Therefore, the Wee1/CDC2 molecular axis may be related to the NF-κB signaling pathway.
In this study, the data showed that the IC50 value of CDDP was significantly higher in high CDDP-tolerant cancer cells (Table 1). In addition, IKKα, IKKβ, IκB, and RelA in the NF-κB signaling pathway were heterogenetically expressed, and the above four proteins were expressed at higher levels in CDDP-tolerant parental cells (Fig. 1). These results indicate that tumor cells that exhibit high CDDP tolerance also have high levels of NF-κB signaling pathway molecules. Surprisingly, this study found that in several tumor cells, the Wee1/CDC2 molecular axis and multiple molecules in the NF-κB pathway were simultaneously enriched. Moreover, these tumor cells exhibit higher CDDP tolerance, which is accompanied by higher tolerance to the Wee1-specific small-molecule inhibitor AZD1775. Thus, the enriched abundance of these proteins plays an important role in the process of CDDP resistance in OS cells. A new finding in this study is that Wee1/CDC2 and NF-κB signaling pathway molecules are simultaneously expressed at elevated levels under CDDP stress.
A number of studies [1012,22] have reported that Wee1 or NF-κB is related to CDDP resistance in tumors. It is still unknown whether Wee1 and NF-κB directly interact with each other to contribute to CDDP resistance in OS. This study confirmed that CDDP causes a strong DNA stress response. Subsequently, the NF-κB pathway is activated, and the level of phosphorylated RelA-S536 increases (Fig. 2). In addition, we observed that TNFα promoted increased levels of RelA-S536p accompanied by increased protein levels of Wee1 and an increase in phosphorylated CDC2-Y15 in CDDP-tolerant OS cells. In contrast, the inhibition of Wee1 by AZD1775 was accompanied by a reduction in the levels of phosphorylated CDC2-Y15 and RelA-S536 (Fig. 2). This indicates that the Wee1/CDC2 molecular axis and RelA in the NF-κB pathway are synergistically and mutually active.
Abnormal activation of NF-κB is closely related to the pathophysiology of tumors [5]. TNFα activation of NF-κB is accompanied by RelA-S536 phosphorylation, whereby RelA translocates from the cytoplasm to the nucleus and activates the transcription of its downstream molecules CCND1 and Bcl-2 [6,7]. Normally, an increase in CCND1 regulates cell cycle progression and cell proliferation [7]. Bcl-2 can enhance the resistance of tumor cells to DNA damage [9]. In contrast, cleaved caspase-3 functions by trimming full-length PARP into two cleaved PARP fragments, preventing DNA repair and ultimately resulting in cell death. In this study, after CDDP treatment in OS cells, Wee1 and RelA physically interacted with each other, and this interaction increased upon CDDP treatment (Fig. 3). CDC2 and RelA were activated by phosphorylation, and the nuclear translocation of RelA increased (Fig. 4). This study and others [1012] confirmed that the Wee1 and NF-κB signaling pathways are involved in the CDDP-induced DNA damage response in OS cells. Consistent with previous studies [6], after CDDP treatment in CDDP-tolerant OS cells (Saos2 and PDX-OS3), the protein levels of CCND1 and Bcl-2 increased. Compared to CDDP treatment alone, treatment with Wee1 inhibition significantly reduced the levels of CCND1 and Bcl-2 and increased the levels of cleaved caspase-3 and cleaved PARP. Consistently, this effect was more significant when CDDP was combined with Wee1 inhibition. This highlights the important role of the synergy of the Wee1/CDC2 and NF-κB signaling pathways in the response of CDDP-tolerant OS cells to CDDP damage.
Theoretically, CDDP exerts a relatively strong DNA damage effect in the replication phase and cleavage phase in the cell cycle but a relatively weak effect in the quiescent phase [23]. Tumor cells usually respond to the DNA stress damage induced by chemotherapeutic drugs such as CDDP by changing the cell cycle state and proliferation speed to first avoid cell death and then acquire drug resistance [23]. Consistent with this work, Wee1 affected cell proliferation and cell cycle progression and survival (Figs. 5 and 6). Wee1 can synergistically enhance cell resistance to CDDP through the NF-κB signaling pathway in CDDP-tolerant OS cells. In other words, OS cells could change the cell cycle and cell proliferation status by increasing and mutually activating the NF-κB signaling pathway and Wee1/CDC2 molecular axis to acquire CDDP resistance. Inhibiting Wee1 blocked this mutual effect and restored the DNA stress effect of CDDP.
Although Wee1 inhibition can clinically enhance the efficacy of conventional chemotherapy drugs used to kill cancer cells [13], it is worth noting that large-sample studies have shown extreme heterogeneity among OS patients. Many reports have indicated that the PDX model has strong predictive value for anti-drug resistance in drug response studies [24]. Studies have shown that the genome is stable during the process of collecting primary OS tumors to establish corresponding PDX models, and the genomic changes between primary OS tumors and the corresponding established PDX tumors are very small [19]. In addition, through multiple generations of PDXs and their derived cell lines, it was also found that the genome was highly consistent [25]. Many results indicate that the PDX model can be used as a reliable preclinical model for evaluating specific treatments for OS patients [26]. PDX-OS3 cells are a known drug-resistant cell line and show similar properties to conventional Saos2 cells derived from OS tissue from a patient who failed to respond to multiple chemotherapy drugs. Previous experiments using PDX-OS have shown that the results are consistent with those of the conventional OS cell line Saos2 [17]. We established a PDX nude mouse model with CDDP-resistant OS3 cells to further verify whether Wee1 inhibition of CDDP-resistant OS can restore CDDP drug sensitivity and improve prognoses. Our research also shows that, similar to a previous study [15], the experimental results of PDX tumors and their derivatory cells are consistent in that CDDP drug treatment alone has no significant effect in controlling the growth of PDX-OS compared with that of the control group. Inhibiting Wee1 has a certain inhibitory effect on the PDX model, and concomitant Wee1 inhibition and CDDP treatment can significantly inhibit tumor growth and prolong the median survival of the host (Fig. 7). Therefore, the results show that Wee1 inhibition not only can resensitize CDDP-resistant PDX-OS to CDDP drugs but also has a synergistic enhancement effect on OS, which has an ideal therapeutic effect. Clinically, these data suggest that Wee1 inhibition may be an ideal therapeutic option for OS with high expression of Wee1/CDC2 and NF-κB or CDDP resistance.
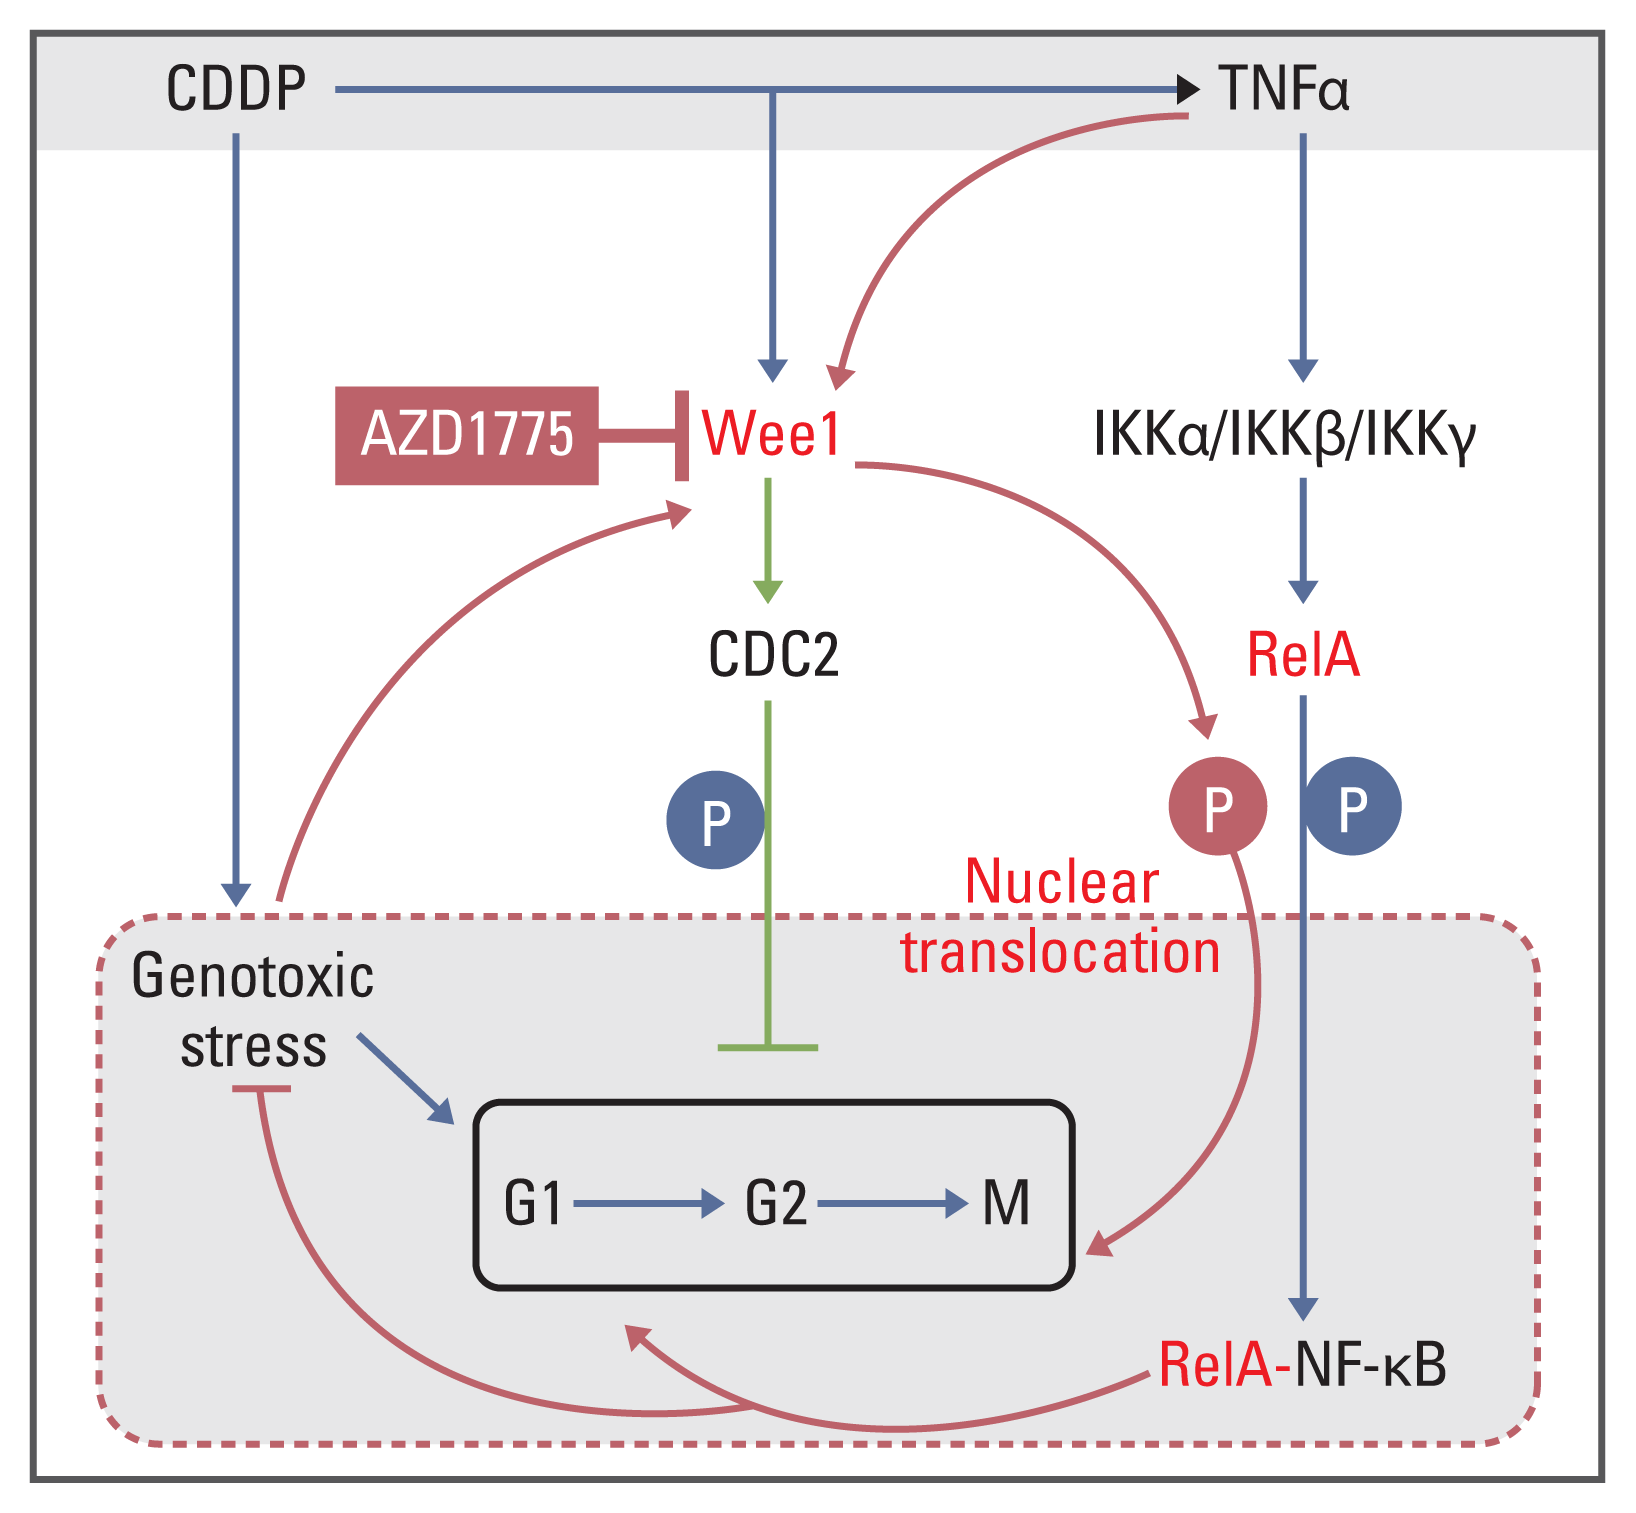
In conclusion, this study shows that OS presents a mechanism of CDDP tolerance by increasing the protein expression of both NF-κB signaling pathway molecules and Wee1/CDC2, in which RelA physically binds to Wee1 to promote the phosphorylation of RelA-S536 and CDC2-Y15. This allows RelA to translocate into the nucleus, which further regulates the expression of CCND1 and Bcl-2 and the apoptosis-related genes PARP and caspase-3 and affects tumor cell cycle progression and cell proliferation (Fig. 8). Inhibition of Wee1 can not only restore CDDP drug sensitivity but can also have a synergistic effect with CDDP on CDDP-tolerant OS cells with enriched expression of NF-kB signaling pathway molecules and Wee1/CDC2 molecules in vitro and PDX-OS in vivo, the latter of which extends the median survival of the host. In other words, this study clarifies a new molecular mechanism of CDDP resistance in OS cells: increased abundance of NF-κB signaling pathway molecules and the Wee1/CDC2 molecular axis and their mutually enhanced activities. For OS presenting this CDDP resistance mechanism, inhibition of Wee1 can be used as a reference strategy for clinical treatment.

Notes

Ethical Statement

All studies were conducted with patients who provided informed consent. The study parameters were approved by the Ethics Committee of Shaoguan Hospital Affiliated with Southern Medical University (approval No. 2017001). All mice were raised in animal facilities approved by Southern Medical University in accordance with the guidelines of the Animal Experiment Center of the Southern Medical University of China.

Author Contributions

Conceived and designed the analysis: Hu Z, Li L, Lan W, Wei X, Wen X, Wu P, Zhang X, Xi X, Li W, Liao X.

Collected the data: Hu Z, Li L, Lan W, Wei X, Wen X, Wu P, Zhang X, Xi X, Li Y, Wu L, Li W, Liao X.

Contributed data or analysis tools: Hu Z, Li L, Lan W, Wen X, Wu P, Zhang X, Xi X, Li Y, Li W, Liao X.

Performed the analysis: Hu Z, Li L, Lan W, Wei X, Xi X, Wu L, Li W, Liao X.

Wrote the paper: Hu Z, Li L, Lan W, Wei X, Wen X, Wu P, Zhang X, Li W, Liao X.

Conflicts of Interest

Conflict of interest relevant to this article was not reported.

Acknowledgments

This project is supported by the Natural Science Foundation of Guangdong, China (grant Nos. 2017A030307012 and 2018A03030-70013 to Zhengbo Hu). We thank Drs. Zhong Chen for reading this manuscript and providing helpful suggestions.

References

1. Isakoff MS, Bielack SS, Meltzer P, Gorlick R. Osteosarcoma: current treatment and a collaborative pathway to success. J Clin Oncol. 2015; 33:3029–35.
crossref
2. Makovec T. Cisplatin and beyond: molecular mechanisms of action and drug resistance development in cancer chemotherapy. Radiol Oncol. 2019; 53:148–58.
crossref
3. Dagogo-Jack I, Shaw AT. Tumour heterogeneity and resistance to cancer therapies. Nat Rev Clin Oncol. 2018; 15:81–94.
crossref
4. Dasari S, Tchounwou PB. Cisplatin in cancer therapy: molecular mechanisms of action. Eur J Pharmacol. 2014; 740:364–78.
crossref
5. Karin M, Greten FR. NF-kappaB: linking inflammation and immunity to cancer development and progression. Nat Rev Immunol. 2005; 5:749–59.
6. Wang Y, Fu Q, Zhao W. Tetramethylpyrazine inhibits osteosarcoma cell proliferation via downregulation of NF-kappaB in vitro and in vivo. Mol Med Rep. 2013; 8:984–8.
7. Gong Y, Zack TI, Morris LG, Lin K, Hukkelhoven E, Raheja R, et al. Pan-cancer genetic analysis identifies PARK2 as a master regulator of G1/S cyclins. Nat Genet. 2014; 46:588–94.
crossref
8. Miranda MA, Marcato PD, Mondal A, Chowdhury N, Gebeyehu A, Surapaneni SK, et al. Cytotoxic and chemosensitizing effects of glycoalkaloidic extract on 2D and 3D models using RT4 and patient derived xenografts bladder cancer cells. Mater Sci Eng C Mater Biol Appl. 2021; 119:111460.
crossref
9. Conde de la Rosa L, Schoemaker MH, Vrenken TE, Buist-Homan M, Havinga R, Jansen PL, et al. Superoxide anions and hydrogen peroxide induce hepatocyte death by different mechanisms: involvement of JNK and ERK MAP kinases. J Hepatol. 2006; 44:918–29.
crossref
10. Nam AR, Jin MH, Bang JH, Oh KS, Seo HR, Oh DY, et al. Inhibition of ATR increases the sensitivity to WEE1 inhibitor in biliary tract cancer. Cancer Res Treat. 2020; 52:945–56.
crossref
11. Yan M, Ni J, Song D, Ding M, Huang J. Activation of unfolded protein response protects osteosarcoma cells from cisplatin-induced apoptosis through NF-kappaB pathway. Int J Clin Exp Pathol. 2015; 8:10204–15.
12. Moiseeva TN, Qian C, Sugitani N, Osmanbeyoglu HU, Bakkenist CJ. WEE1 kinase inhibitor AZD1775 induces CDK1 kinase-dependent origin firing in unperturbed G1- and S-phase cells. Proc Natl Acad Sci U S A. 2019; 116:23891–3.
crossref
13. Geenen JJ, Schellens JH. Molecular pathways: targeting the protein kinase Wee1 in cancer. Clin Cancer Res. 2017; 23:4540–4.
crossref
14. Kuijjer ML, Hogendoorn PC, Cleton-Jansen AM. Genome-wide analyses on high-grade osteosarcoma: making sense of a genomically most unstable tumor. Int J Cancer. 2013; 133:2512–21.
crossref
15. Castillo-Tandazo W, Mutsaers AJ, Walkley CR. Osteosarcoma in the post genome era: preclinical models and approaches to identify tractable therapeutic targets. Curr Osteoporos Rep. 2019; 17:343–52.
crossref
16. Lu W, Chao T, Ruiqi C, Juan S, Zhihong L. Patient-derived xenograft models in musculoskeletal malignancies. J Transl Med. 2018; 16:107.
crossref
17. Li W, Zhang X, Xi X, Li Y, Quan H, Liu S, et al. PLK2 modulation of enriched TAp73 affects osteogenic differentiation and prognosis in human osteosarcoma. Cancer Med. 2020; 9:4371–85.
crossref
18. Lu H, Yang X, Duggal P, Allen CT, Yan B, Cohen J, et al. TNF-alpha promotes c-REL/DeltaNp63alpha interaction and TAp73 dissociation from key genes that mediate growth arrest and apoptosis in head and neck cancer. Cancer Res. 2011; 71:6867–77.
19. Blattmann C, Thiemann M, Stenzinger A, Roth EK, Dittmar A, Witt H, et al. Establishment of a patient-derived orthotopic osteosarcoma mouse model. J Transl Med. 2015; 13:136.
crossref
20. Hu ZB, Liao XH, Xu ZY, Yang X, Dong C, Jin AM, et al. PLK2 phosphorylates and inhibits enriched TAp73 in human osteosarcoma cells. Cancer Med. 2016; 5:74–87.
21. Cho JG, Choi JS, Lee JH, Cho MG, Kim HS, Noh HD, et al. MED28 over-expression shortens the cell cycle and induces genomic instability. Int J Mol Sci. 2019; 20:1746.
crossref
22. Duan Z, Gao Y, Shen J, Choy E, Cote G, Harmon D, et al. miR-15b modulates multidrug resistance in human osteosarcoma in vitro and in vivo. Mol Oncol. 2017; 11:151–66.
23. Lin X, Chen D, Zhang C, Zhang X, Li Z, Dong B, et al. Augmented antitumor activity by olaparib plus AZD1775 in gastric cancer through disrupting DNA damage repair pathways and DNA damage checkpoint. J Exp Clin Cancer Res. 2018; 37:129.
crossref
24. Woo XY, Giordano J, Srivastava A, Zhao ZM, Lloyd MW, de Bruijn R, et al. Conservation of copy number profiles during engraftment and passaging of patient-derived cancer xenografts. Nat Genet. 2021; 53:86–99.
25. Teng S, Li YE, Yang M, Qi R, Huang Y, Wang Q, et al. Tissue-specific transcription reprogramming promotes liver metastasis of colorectal cancer. Cell Res. 2020; 30:34–49.
crossref
26. Stewart E, Federico SM, Chen X, Shelat AA, Bradley C, Gordon B, et al. Orthotopic patient-derived xenografts of paediatric solid tumours. Nature. 2017; 549:96–100.
crossref

Fig. 1
Wee1/CDC2 and nuclear factor κB (NF-κB) signaling pathway molecules in parental tumor cells had heterogeneous expression levels and were upregulated by cisplatin (CDDP). Tumor cells were seeded in a 10-cm cell culture dish (1×10⁵ cells/dish) and cultured for 48 hours. Cells were treated with CDDP (25 μg/mL) in fresh medium for 6 hours when they reached 70%–80% confluence and then harvested. Parental cells were treated with fresh medium alone. Protein quantification was performed after cell lysis, and 30 μg protein per well was subjected to western blot analysis. The protein expression levels of Wee1/CDC2 and NF-κB pathway molecules IKKα, IKKβ, RelA, and IκB in conventional cells were significantly different, with the hierarchy Saos2 > U2OS > MG63 for OS cell lines (p < 0.01) (A), UN-SCC46 > UM-SCC47 > UM-SCC1 for head and neck squamous cell lines (p < 0.01) (B), and PDX-OS3 > PDX-OS2 > PDX-OS1 for PDX OS cell lines (p < 0.01) (C). CDDP significantly increased the protein expression levels of Wee1, IKKα, IKKβ, and RelA and decreased that of IκB in these tumor cells (p < 0.01).
crt-2021-320f1.gif
Fig. 2
AZD1775 abolished the effects of tumor necrosis factor α (TNFα), cisplatin (CDDP), and Wee1 treatment in CDDP-tolerant osteosarcoma cells by amplifying the phosphorylation of both CDC2-Y15 and RelA-S536. Cells were seeded at 1×10⁵ in a 10 cm cell culture dish, cultured for 48 hours, and harvested when the cells reached 70%–80% confluency. The cells were transfected with the plasmid Wee1 for 24 hours, after which they were treated with CDDP or TNFα for 6 hours. Vehicle treatment was used as a control. After cell lysis, the protein concentration was quantitated, and western blotting was performed with 25 μg of protein per sample. (A) In Saos2 cells, the levels of phosphorylated CDC2-Y15 (CDC2-Y15p) and RelA-S536 (RelA-S536p) in the TNFα treatment, Plasmid-Wee1 treatment and CDDP treatment groups were significantly amplified compared with that of the control group (p < 0.01) and were significantly reduced in the AZD1775 treatment group (p < 0.01). Compared with the TNFα treatment and Plasmid-Wee1 treatment groups, the Plasmid-Wee1+TNFα treatment group showed significantly increased CDC2-Y15p and RelA-S536p levels (p < 0.05). The levels of CDC2-Y15p and RelA-S536p in the TNFα+AZD1775 treatment group were significantly lower than those in the TNFα treatment group (p < 0.01), and the levels were significantly lower in the CDDP+AZD1775 treatment group than in the CDDP treatment group (p < 0.01). Moreover, these levels were significantly higher in the CDDP+TNFα treatment group than in the CDDP treatment group (p < 0.01). (B) In CDDP-resistant PDX-OS3 cells, the levels of CDC2-Y15 and RelA-S536 in each treatment group were basically consistent with those in the corresponding Saos2 cells. Interestingly, CDC2-Y15p and RelA-S536p levels were more obviously decreased in the treatment groups containing AZD1775, with statistical significance (p < 0.01). (C) Although the levels of CDC2-Y15p and RelA-S536 in PDX-OS1 cells were significantly increased in the CDDP-treated group compared to the control group, the levels of CDC2-Y15p in the CDDP+AZD1775 treatment group were decreased (p < 0.01), which was accompanied by increased RelA-S536 phosphorylation. In addition, the levels of RelA-S536p were amplified in the CDDP+TNFα group (p < 0.01), accompanied by a reduction in CDC2-Y15p levels. This is consistent with the results in U2OS and MG63 cells (data not shown).
crt-2021-320f2.gif
Fig. 3
The interaction between Wee1 and RelA, as indicated by coimmunocipitation assays in osteosarcoma cells. Cells were seeded at 1×10⁵ in a 10 cm cell culture dish and cultured for 48 hours. Cells were treated with different concentrations of cisplatin (CDDP; 5, 15, and 45 μg/mL) for 6 hours when they reached 70%–80% confluence and then harvested. Whole-cell lysate was used as the positive control, and IgG was used as the negative control. Protein quantification was performed after cell lysis, and the corresponding immunoprecipitants were obtained according to the method instructions, with 30 μg of immunoprecipitants per sample subjected to western blotting. In Saos2 cells (A), Wee1 binding to RelA showed a CDDP dose-dependent effect when treated with three different concentrations of CDDP. This result was reproduced in PDX-OS3 (B) and U2OS cells (C).
crt-2021-320f3.gif
Fig. 4
Wee1 affects the nuclear translocation of RelA in cisplatin (CDDP)-resistant osteosarcoma cells. In confocal immunofluorescence experiments, PDX-OS3 cells were seeded in a cell culture plate at 2×10⁴, cultured for 48 hours, treated with CDDP (25 μg/mL) for 6 hours when the cells reached 50%–60% confluence, and harvested. DMSO was used as a negative control. In PDX-OS3 cells, both Wee1 (green) and RelA (red) fluorescence signals were enhanced in the CDDP treatment group compared to the control group (row 1). Compared with the CDDP treatment group (row 2), the CDDP+AZD1775 group (row 3) showed Wee1 green signal distribution and aggregation mainly in the cytoplasm, while the RelA red signals were congested in the periphery of the nucleus and surrounded by Wee1 green signals. Furthermore, the RelA red signal in the nucleus was reduced. In addition, compared to the CDDP group, the CDDP+si-Wee1 treatment group (row 4) showed that the Wee1 green signal was obviously reduced, while the RelA red signal was also congested around the nucleus and was significantly reduced in the nucleus, which is consistent with the results from the CDDP+AZD1775 group. Scale bars=20 μm.
crt-2021-320f4.gif
Fig. 5
Inhibition of Wee1 restores the effects of cisplatin (CDDP) on cell cycle progression and survival in Saos2 cells. In the cell cycle assays, Saos2 cells were seeded in a 10 cm cell culture dish at 1×10⁵ and cultured for 48 hours. Cells were treated with si-Wee1 transfection or CDDP, nocodozale, tumor necrosis factor α (TNFα) and other treatments for 24 hours when the cells reached 70%–80% confluence, after which they were harvested. Vehicle treatment was used as a negative control (A), and the cell cycle G2 inhibitor nocodozale was used as a positive control (B). The proportion of G1 phase cells in the nocodozale treatment group was significantly decreased, while the proportion of G2 phase cells was significantly increased (p < 0.01). Compared with the negative control group, there was no significant difference in the proportion of cells in the different phases in the CDDP (C) or TNFα groups (D). Compared with the negative control and positive control groups, the proportion of cells in G2 and sub-G0 phases (cells dying after mitotic catastrophes) and the proportion of cells in G1 phase in the AZD1775 group (E) and siRNA-Wee1 group (F) were significantly increased, whereas the proportion of G1 phase cells was significantly decreased (p < 0.01). Compared with the TNFα treatment group (D), the AZD1775+TNFα treatment group (G) showed an increased proportion of G2 phase cells but a significant decrease in the proportion of sub-G0 phase cells (p < 0.01). Compared with the CDDP treatment group, the AZD1775+CDDP group (H) and siRNA-Wee1+CDDP group (I) showed significant decreases in the proportion of G1 phase cells (p < 0.01) and significant increases in the proportion of sub-G0 cell fragments (p < 0.01).
crt-2021-320f5.gif
Fig. 6
Inhibition of Wee1 restores the effects of cisplatin (CDDP) on cell proliferation and activation of cell death-related molecular pathways in osteosarcoma cells with high tolerance to CDDP. In the Saos2 cell proliferation experiment (A), there was no significant difference in the cell optical density (OD) value between the tumor necrosis factor α (TNFα) and CDDP treatment groups and the control group. Compared with the control and CDDP treatment groups, the AZD1775 treatment and siRNA-Wee1 treatment groups showed significantly smaller OD values (p < 0.05). Compared with the TNFα group, the AZD1775+TNFα group also showed significantly lower OD values (p < 0.05). Compared with the CDDP treatment group, the CDDP+AZD1775 treatment group and CDDP+si-Wee1 treatment group both had the most significant decreases in OD values (p < 0.01). In the PDX-OS3 cell proliferation experiment (B), similar to those in Saos2 cells, the OD value was significantly lower in the AZD1775 and siRNA-Wee1 treatment groups than in the control group (p < 0.05) and was significantly lower in the AZD1775+TNFα treatment group than in the TNFα treatment group (p < 0.05). Compared with the CDDP treatment group, the CDDP+AZD1775 treatment group and CDDP+si-Wee1 treatment group both had the most significant decreases in the OD value (p < 0.01). In the Saos2 western blot assay (C), compared with the control group, the CDDP treatment group showed a significant increase in the levels of the NF-κB downstream molecules Bcl-2 and CCND1 (p < 0.05), while the differences in the expression of the apoptosis-related proteins cleaved poly(ADP-ribose) polymerase (PARP) and cleaved caspase-3 were not statistically significant. Compared with the control group, the AZD1775 or siRNA-Wee1 treatment group showed significantly lower Bcl-2 and CCND1 expression levels (p < 0.05) and significantly higher cleaved PARP and cleaved caspase-3 levels (p < 0.05). Moreover, Bcl-2 and CCND1 levels were significantly decreased in the CDDP+AZD1775 group and CDDP+si-Wee1 group (p < 0.01), which were accompanied by simultaneous increases in the apoptosis-related proteins cleaved PARP and cleaved caspase-3 (p < 0.01). In PDX-OS3 cells (D), consistent with the results in Saos2 cells, Wee1 inhibition treatment significantly decreased Bcl-2 and CCND1 expression and simultaneously increased cleaved PARP and cleaved caspase-3 levels, especially in the CDDP combined with Wee1 inhibition group.
crt-2021-320f6.gif
Fig. 7
AZD1775 combined with cisplatin (CDDP) treatment enhanced and restored the therapeutic effect of CDDP, resulting in an extended median survival of the host. PDX-OS3 cells were transplanted into female nude mice and grown for 4 weeks, and the mice were randomly divided into four groups (5 mice per group) (A-D). CDDP 5 mg/kg was intraperitoneally injected once a week, and AZD1775 50 mg/kg was intragastrically administered twice a week for 3 weeks (E). Tumor volume changes were recorded regularly (F), and survival analysis was performed (G). Compared with the control group (A), the CDDP treatment group (B) showed a slightly decreased tumor volume, but the difference was not significant (p > 0.05). However, the tumor volume was significantly decreased in the CDDP+AZD775 group (C) (p < 0.01). The tumor volume was also significantly reduced in the AZD1775 treatment alone group (D) compared with the control group or CDDP treatment group (p < 0.05). The median survival of mice in the control, CDDP treatment, AZD1775 treatment and CDDP+AZD1775 treatment groups was 51, 53, 72, and 89 days, respectively. The median survival of the CDDP+AZD1775 treatment group was the longest, and the difference was significant (p < 0.01).
crt-2021-320f7.gif
Fig. 8
Molecular mechanism of the synergistic interaction of Wee1 with RelA to promote cisplatin (CDDP). NF-κB, nuclear factor κB; TNFα, tumor necrosis factor α.
crt-2021-320f8.gif
Table 1
The inhibitory potentials of cisplatin (CDDP) and AZD-1775 on the viability of tumor cells
Cell Compound/IC50
CDDP (μM) AZD1775 (nM)
MG63 7.873±0.161 202.156±9.379
U2OS 10.793±0.097 222.327±11.278
Saos2 15.643±0.193 297.478±17.378
PDX-OS1 16.215±0.203 237.891±27.889
PDX-OS2 21.712±0.172 245.791±23.475
PDS-OS3 49.219±0.618 301.256±19.578
UM-SCC1 5.612±0.713 267.452±20.313
UM-SCC47 15.331±0.122 361.722±15.622
UM-SCC46 17.231±0.211 372.125±17.236

Cells were seeded into 96-well plates at 5,000 cells per well. Each sample had six replicates, and the data were calculated and are expressed as the mean plus standard deviation (X±SD). Inhibitory rates were calculated by Microsoft Excel, and the half-maximal inhibitory concentration (IC50) values were calculated using PRIM 5.0 software.

TOOLS
Similar articles