Abstract
Purpose
Materials and Methods
Results
Notes
Electronic Supplementary Material
Supplementary materials are available at Cancer Research and Treatment website (https://www.e-crt.org).
Ethical Statement
This study was approved by the Institutional Review Board of the Seoul National University Bundang Hospital (IRB No. X-1608/360-906) and complied with the 1964 Declaration of Helsinki. Patient consent was waived due to the retrospective nature of this study using nationwide database, and which was approved by the Institutional Review Board.
ACKNOWLEDGMENTS
References
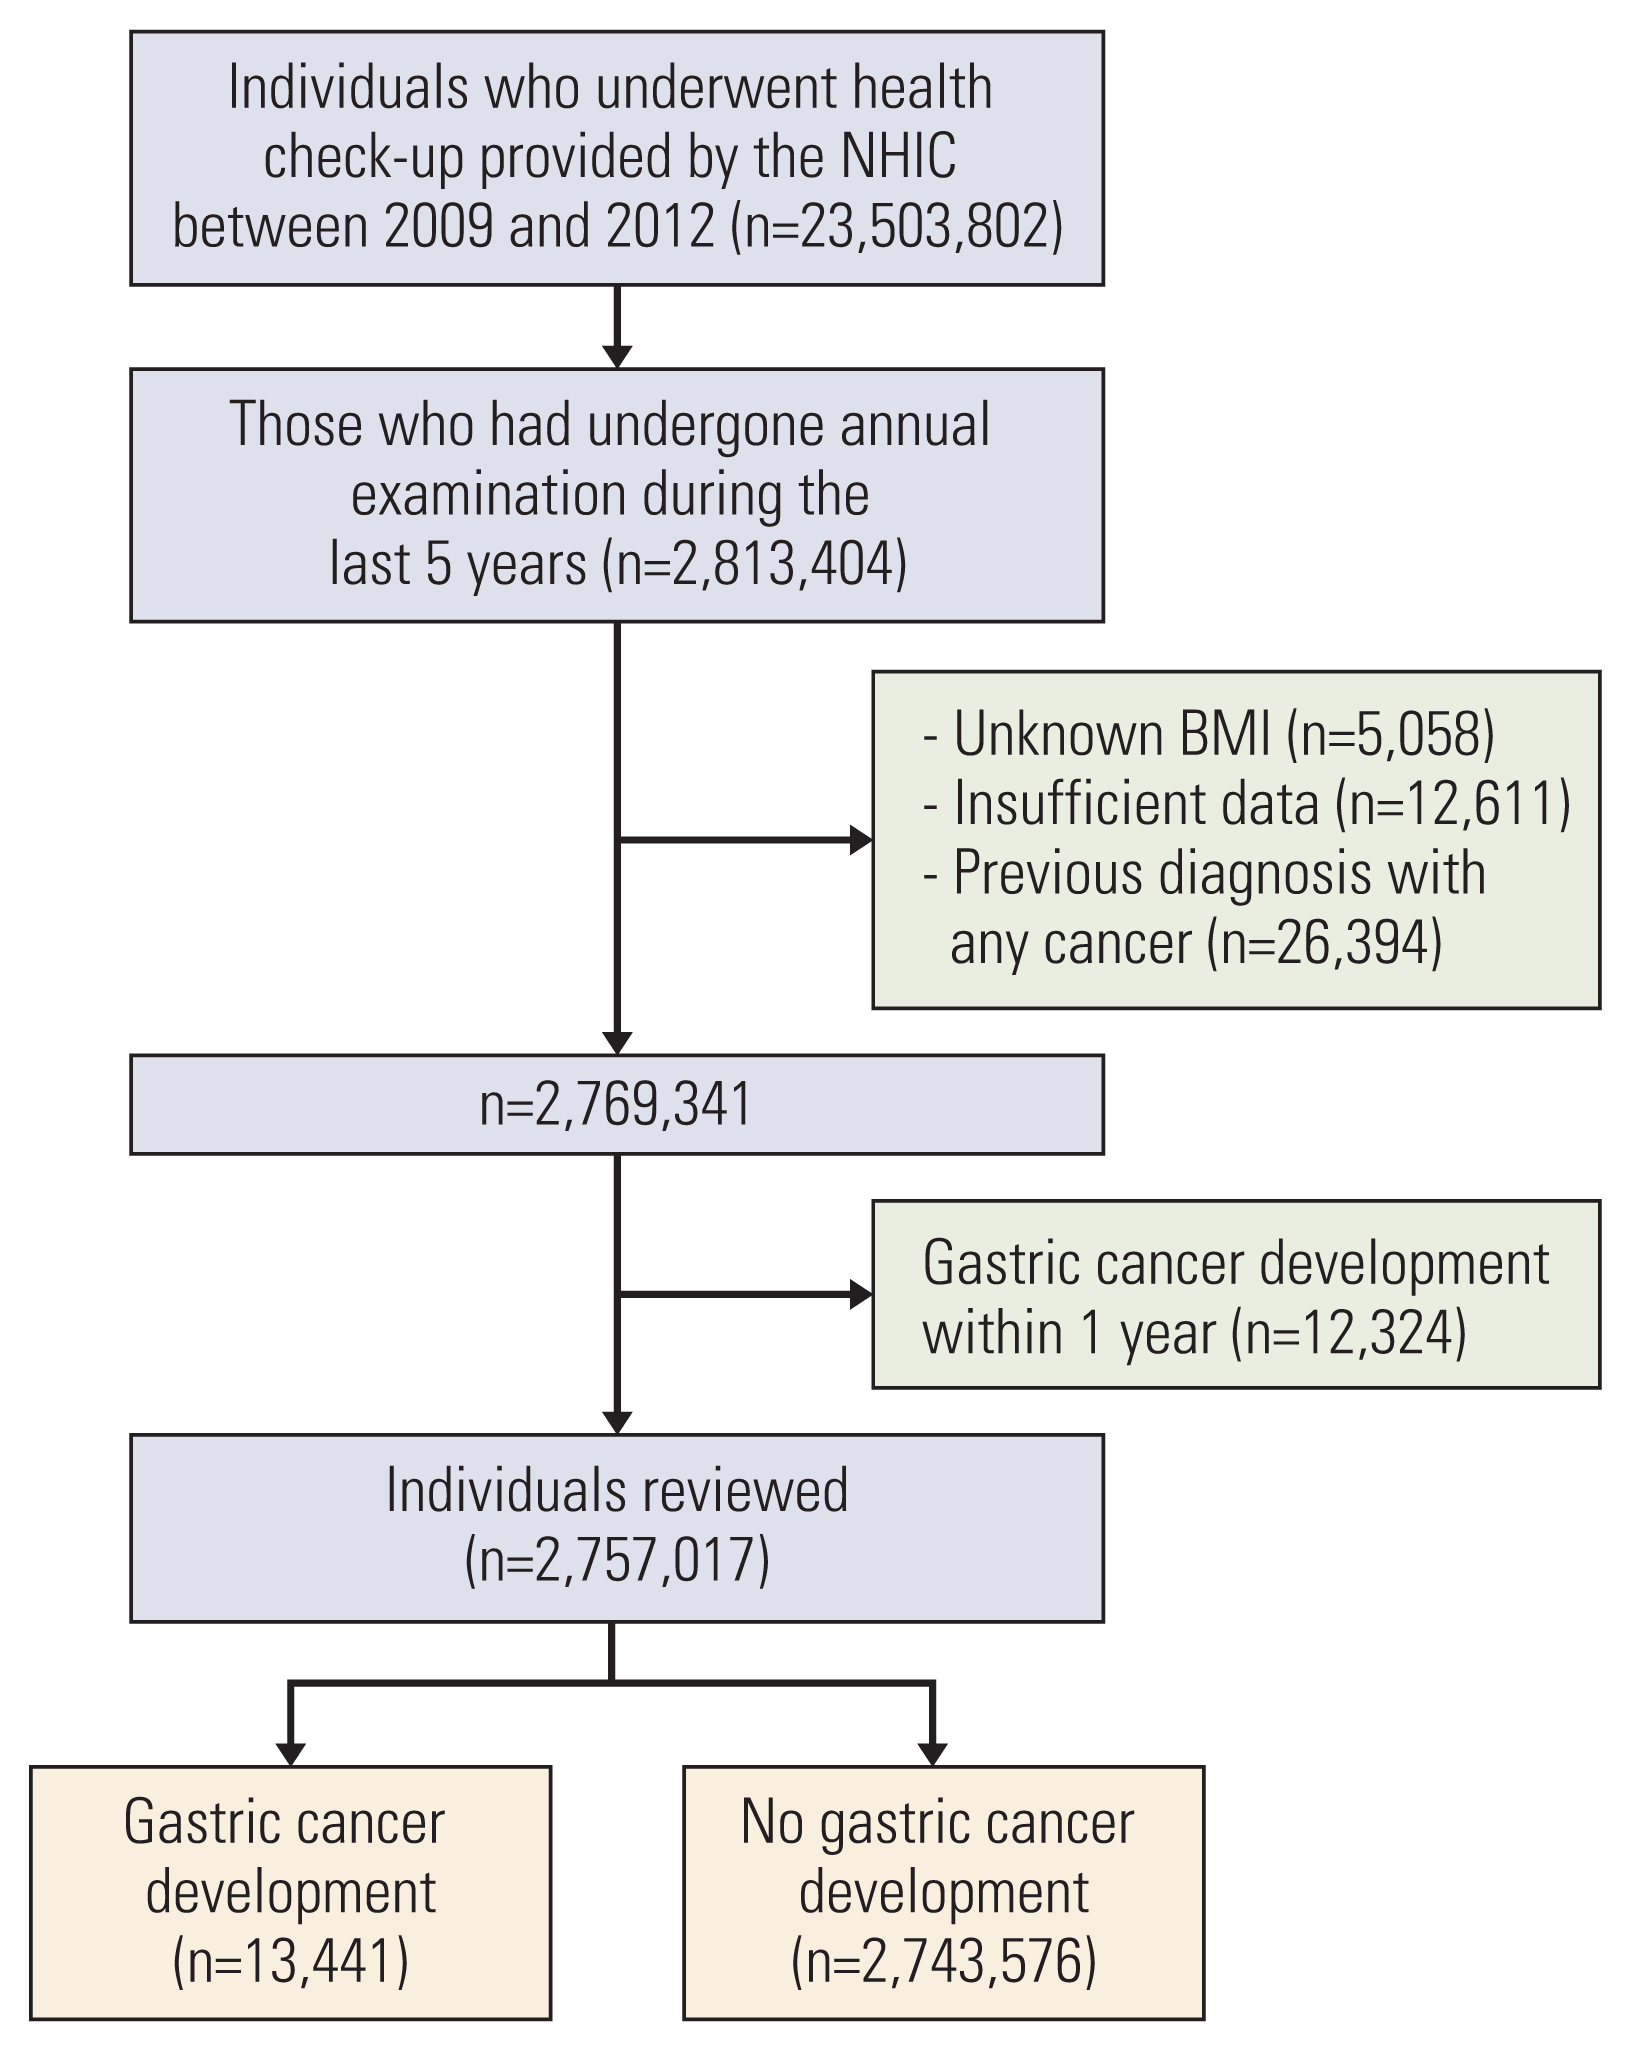
Fig. 1

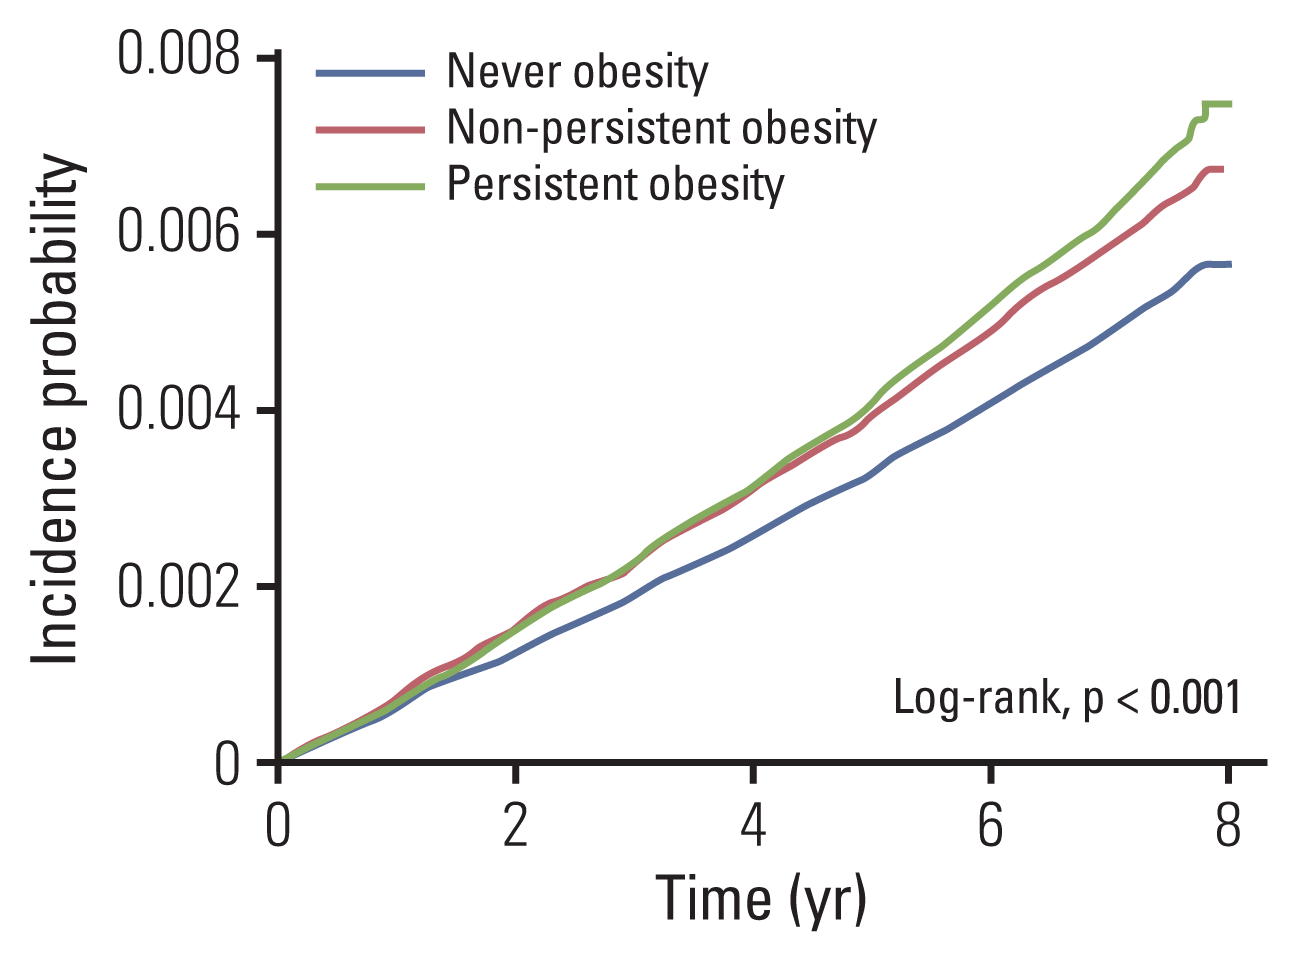
Fig. 2

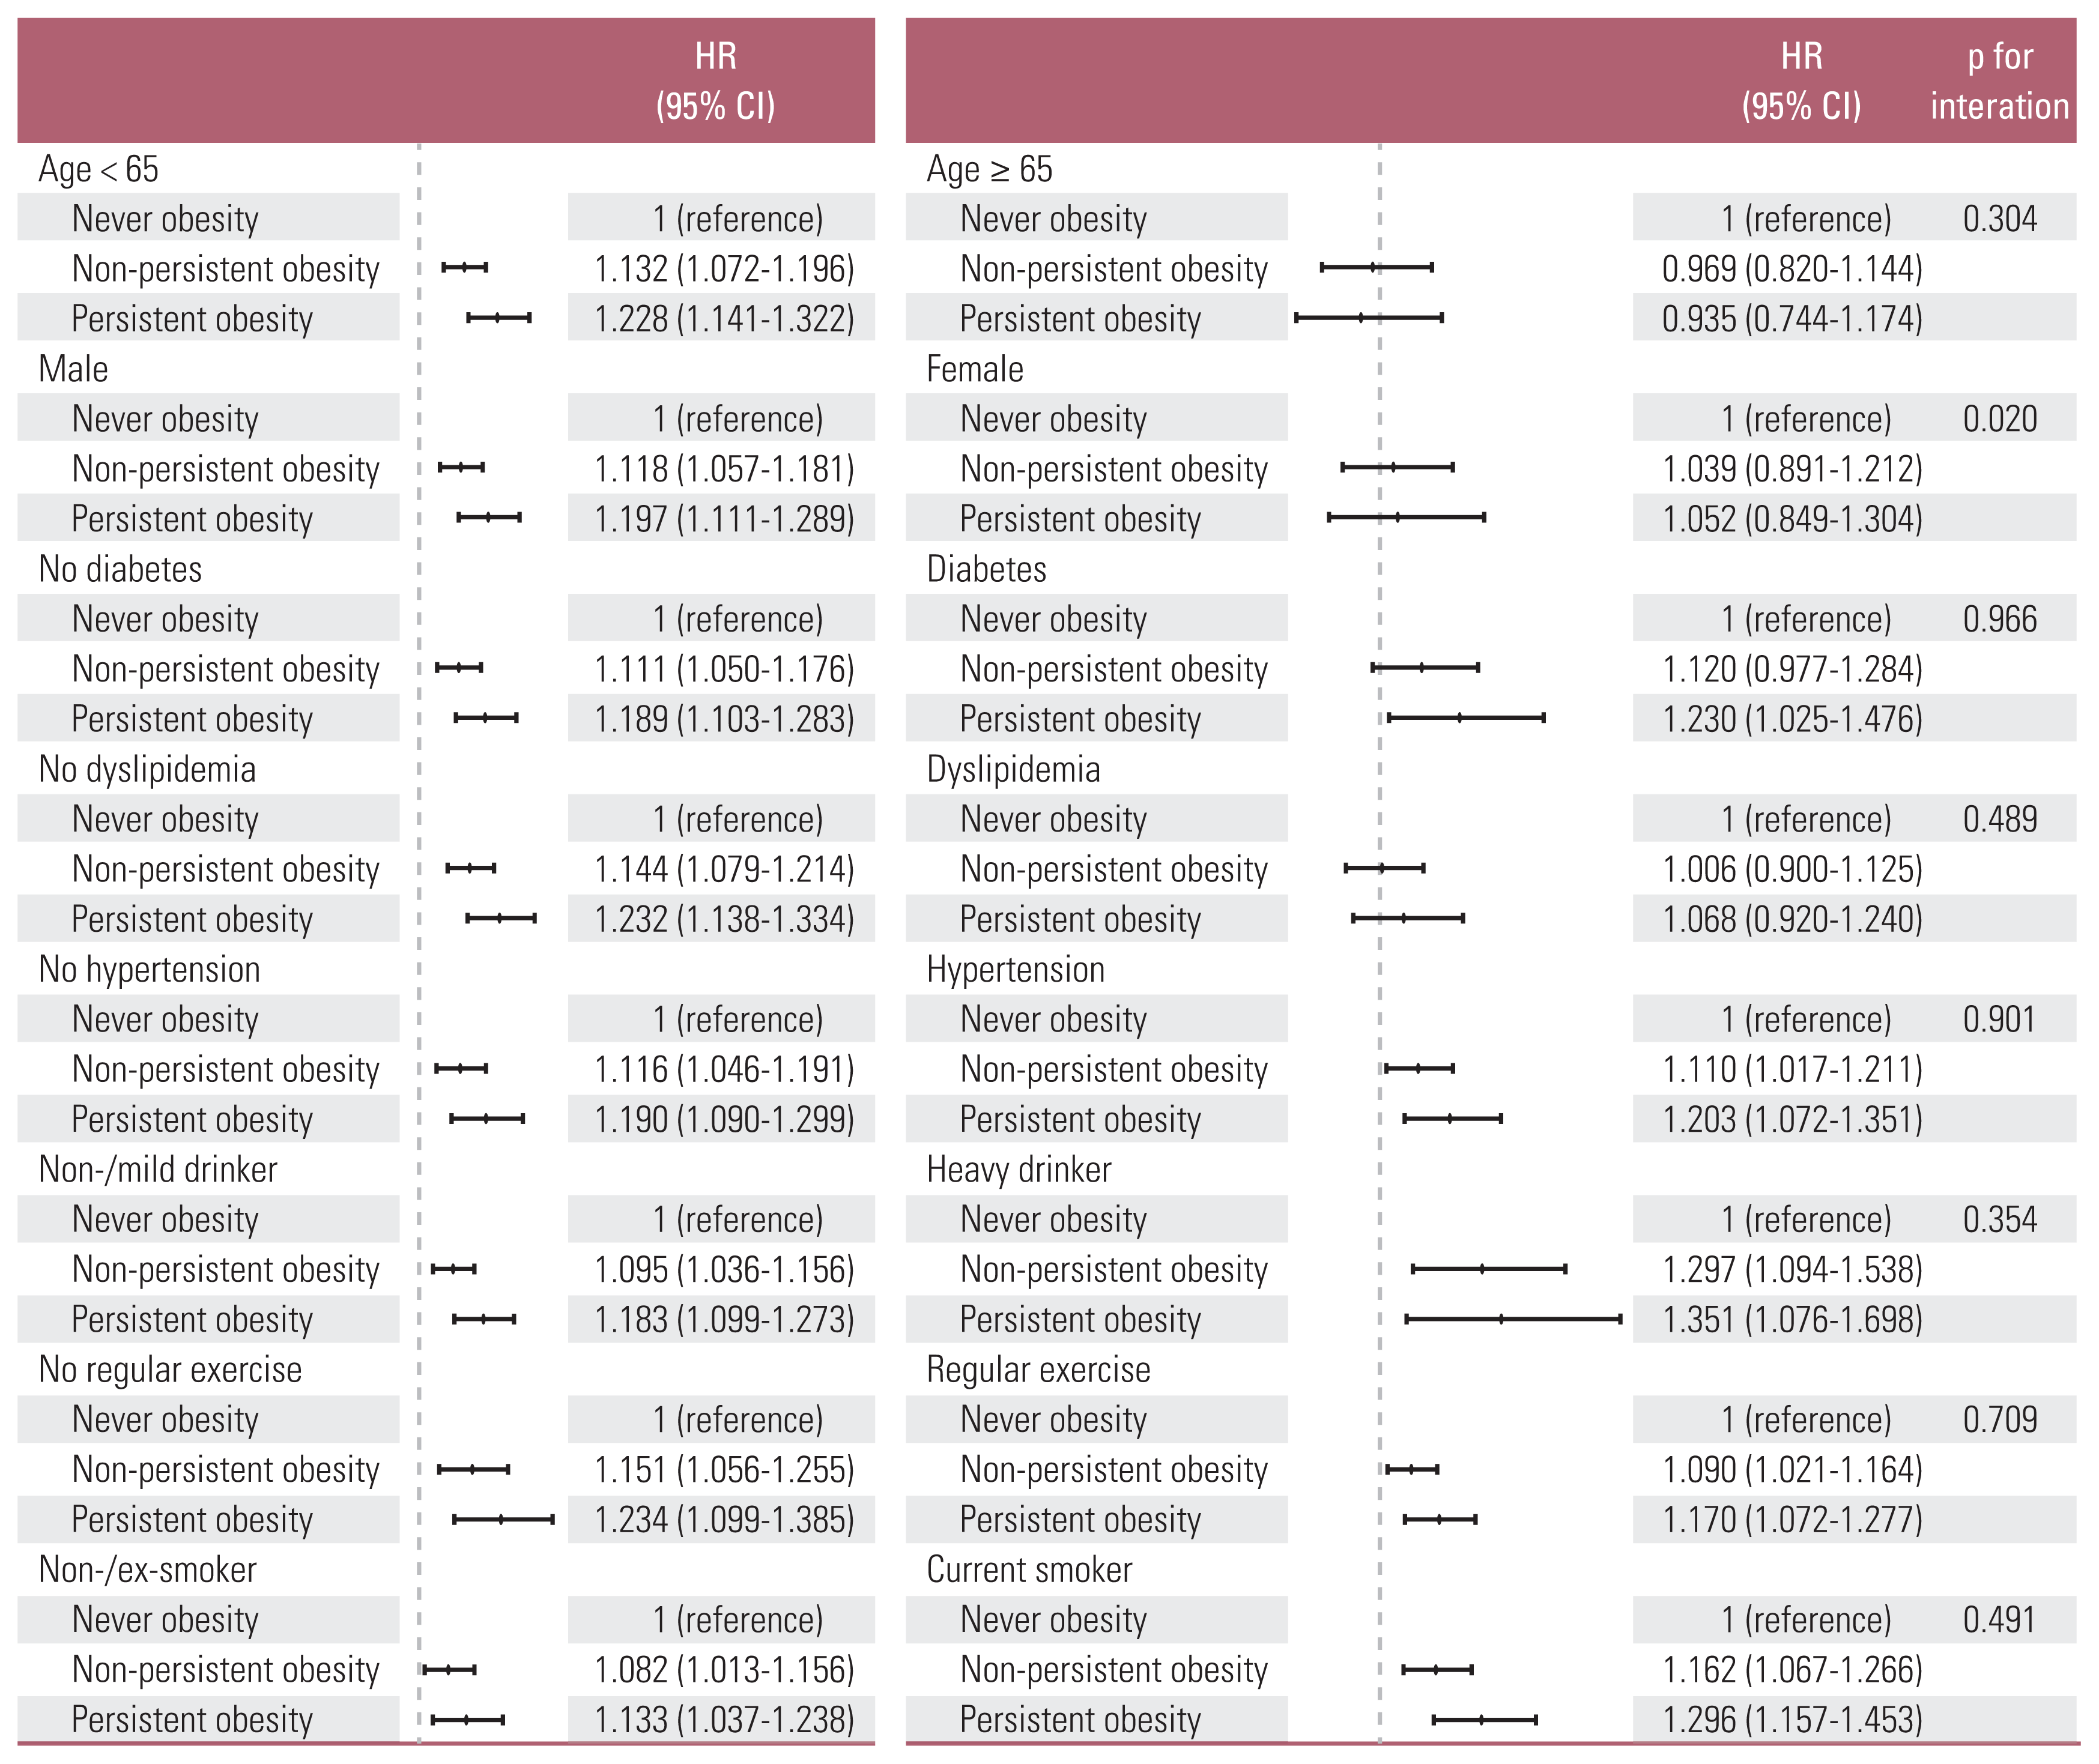
Fig. 3

Table 1
| Ever-obesitya) | Times of obesity diagnosis during the continuous 5 years | ||||||||
|---|---|---|---|---|---|---|---|---|---|
|
|
|
||||||||
| No (n=1,613,198) | Yes (n=1,143,819) | p-value | 1 (n=175,721) | 2 (n=124,172) | 3 (n=120,688) | 4 (n=153,739) | 5 (n=569,499) | p-value | |
| Age (yr) | 41.9±10.6 | 43.5±10.2 | < 0.001 | 43.0±10.6 | 43.1±10.4 | 43.2±10.4 | 43.6±10.3 | 43.9±9.9 | < 0.001 |
|
|
|||||||||
| 20–39 | 755,323 (46.8) | 469,483 (41.1) | < 0.001 | 75,922 (43.2) | 53,313 (42.9) | 51,382 (42.6) | 63,270 (41.2) | 225,596 (39.6) | < 0.001 |
|
|
|||||||||
| 40–64 | 767,454 (47.6) | 598,233 (52.3) | 88,039 (50.1) | 62,709 (50.5) | 61,365 (50.9) | 79,632 (51.8) | 306,488 (53.8) | ||
|
|
|||||||||
| ≥ 65 | 90,421 (5.6) | 76,103 (6.7) | 11,760 (6.7) | 8,150 (6.6) | 7,941 (6.6) | 10,837 (7.1) | 37,415 (6.6) | ||
|
|
|||||||||
| Male sex | 1,086,886 (67.4) | 953,807 (83.4) | < 0.001 | 136,107 (77.5) | 100,415 (80.9) | 98,996 (82.0) | 127,951 (83.2) | 490,338 (86.1) | < 0.001 |
|
|
|||||||||
| BMI (kg/m2) | 21.8±1.9 | 26.6±2.3 | < 0.001 | 24.4±1.3 | 25.0±1.1 | 25.4±1.2 | 26.0±1.4 | 28.0±2.1 | < 0.001 |
|
|
|||||||||
| < 18.5 | 95,080 (5.9) | 397 (0.03) | < 0.001 | 270 (0.2) | 35 (0.03) | 29 (0.02) | 63 (0.04) | 0 | < 0.001 |
|
|
|||||||||
| 18.5–23 | 1,036,096 (64.2) | 2,604 (2.3) | 17,672 (10.1) | 4,418 (3.6) | 2,278 (1.9) | 1,679 (1.1) | 0 | ||
|
|
|||||||||
| 23–25 | 482,022 (29.9) | 223,972 (19.6) | 101,395 (57.7) | 55,997 (45.1) | 38,327 (31.8) | 28,253 (18.4) | 0 | ||
|
|
|||||||||
| 25–30 | 0 | 803,186 (70.2) | 56,005 (31.9) | 63,553 (51.2) | 79,697 (66.0) | 121,830 (79.2) | 482,101 (84.7) | ||
|
|
|||||||||
| ≥ 30 | 0 | 90,217 (7.9) | 379 (0.2) | 169 (0.1) | 357 (0.3) | 1,914 (1.2) | 87,398 (15.4) | ||
|
|
|||||||||
| WC (cm) | 76.2±7.0 | 87.0±7.0 | < 0.001 | 82.2±5.8 | 83.6±5.5 | 84.5±5.5 | 85.9±5.6 | 90.1±6.6 | < 0.001 |
|
|
|||||||||
| Rural residence | 909,449 (56.4) | 659,387 (57.7) | < 0.001 | 100,973 (57.5) | 71,635 (57.7) | 69,720 (57.8) | 88,019 (57.3) | 329,040 (57.8) | < 0.001 |
|
|
|||||||||
| Low incomeb) | 296,126 (18.4) | 223,388 (19.5) | < 0.001 | 34,209 (19.5) | 24,365 (19.6) | 23,637 (19.6) | 30,995 (20.2) | 11,082 (19.4) | < 0.001 |
|
|
|||||||||
| Smoking | |||||||||
|
|
|||||||||
| Never | 813,106 (50.4) | 442,672 (38.7) | < 0.001 | 76,087 (43.3) | 50,534 (40.7) | 48,098 (39.9) | 59,883 (39.0) | 208,070 (36.5) | < 0.001 |
|
|
|||||||||
| Former | 283,182 (17.6) | 274,738 (24.0) | 39,605 (22.5) | 29,665 (23.9) | 28,937 (24.0) | 37,449 (24.4) | 139,082 (24.4) | ||
|
|
|||||||||
| Current | 516,910 (32.0) | 426,409 (37.3) | 60,029 (34.2) | 43,973 (35.4) | 43,653 (36.2) | 56,407 (36.7) | 222,347 (39.0) | ||
|
|
|||||||||
| Alcohol | |||||||||
|
|
|||||||||
| None | 661,031 (41.0) | 393,159 (34.4) | < 0.001 | 65,135 (37.1) | 44,013 (35.5) | 42,077 (34.9) | 53,599 (34.9) | 188,335 (33.1) | < 0.001 |
|
|
|||||||||
| Mildc | 849,087 (52.6) | 638,080 (55.8) | 95,969 (54.6) | 69,520 (56.0) | 65,525 (56.0) | 85,777 (55.8) | 319,287 (56.1) | ||
|
|
|||||||||
| Heavyd) | 103,080 (6.4) | 112,580 (9.8) | 14,617 (8.3) | 10,639 (8.6) | 11,084 (9.2) | 14,363 (9.3) | 61,877 (10.9) | ||
|
|
|||||||||
| Regular exercise | 971,031 (60.2) | 758,148 (66.3) | < 0.001 | 112,436 (64.0) | 81,303 (65.5) | 79,368 (65.8) | 102,096 (66.4) | 382,945 (67.2) | < 0.001 |
|
|
|||||||||
| Diabetes | 68,504 (4.3) | 106,608 (9.3) | < 0.001 | 11,374 (6.5) | 8,832 (7.1) | 9,300 (7.7) | 13,362 (8.7) | 63,740 (11.2) | < 0.001 |
|
|
|||||||||
| Hypertension | 211,457 (13.1) | 319,950 (28.0) | < 0.001 | 35,072 (20.0) | 26,835 (21.6) | 28,249 (23.4) | 39,769 (25.9) | 190,025 (33.4) | < 0.001 |
|
|
|||||||||
| Dyslipidemia | 174,977 (10.9) | 241,345 (21.1) | < 0.001 | 29,456 (16.8) | 22,228 (17.9) | 22,578 (18.7) | 31,285 (20.4) | 135,798 (23.9) | < 0.001 |
|
|
|||||||||
| Follow-up duration, median (Q1–Q3) | 6.76 (5.33–7.35) | 6.82 (5.4–7.39) | < 0.001 | 6.77 (5.37–7.37) | 6.74 (5.35–7.35) | 6.74 (5.36–7.35) | 6.75 (5.35–7.35) | 6.76 (5.30–7.35) | < 0.001 |
Values are presented as mean±standard deviation or numbers (percentage excluding missing data). Data were from the final health check-up of each individual. BMI, body mass index; WC, waist circumference.
Table 2
| Gastric cancer | Duration (person-years) | Incidence rate (per 1,000 person-years) | aHR (95% CI)a) | |
|---|---|---|---|---|
| BMIb) | ||||
| < 18.5 | 314 | 602,029.76 | 0.52 | 1.152 (1.027–1.292) |
| 18.5–23 | 4,634 | 6,769,453.49 | 0.68 | 1 (reference) |
| 23–25 | 3,744 | 4,520,560.49 | 0.83 | 0.977 (0.935–1.020) |
| 25–30 | 4,403 | 5,108,345.76 | 0.86 | 1.027 (0.985–1.072) |
| ≥ 30 | 346 | 560,217.27 | 0.62 | 0.985 (0.881–1.100) |
| BMI | ||||
| < 25 | 8,692 | 11,892,043.75 | 0.73 | 1 (reference) |
| ≥ 25 | 4,749 | 5,668,563.03 | 0.84 | 1.031 (0.994–1.069) |
| WC, M/F (cm)b) | ||||
| < 80/< 75 | 3,623 | 6,607,430.37 | 0.55 | 0.951 (0.906–0.998) |
| 80–85/75–80 | 3,685 | 4,578,966.61 | 0.80 | 0.966 (0.922–1.013) |
| 85–90/80–85 | 3,308 | 3,496,236.26 | 0.95 | 1 (reference) |
| 90–95/85–90 | 1,832 | 1,821,759.93 | 1.01 | 0.997 (0.942–1.056) |
| 95–100/90–95 | 693 | 708,149.86 | 0.98 | 0.997 (0.928–1.082) |
| ≥ 105/≥ 100 | 300 | 348,063.75 | 0.86 | 1.004 (0.892–1.131) |
| WC, M/F (cm) | ||||
| < 90/< 85 | 10,342 | 14,139,457.95 | 0.73 | 1 (reference) |
| ≥ 90/≥ 85 | 3,099 | 3,421,148.83 | 0.91 | 1.008 (0.967–1.050) |
aHR, adjusted hazard ratio; BMI, body mass index; CI, confidence interval; F, female; M, male; WC, waist circumference.
Table 3
| No. of diagnosis with obesitya) | Gastric cancer | Duration (person-years) | Incidence rate (per 1,000 person-years) | HR (95% CI)b) |
|---|---|---|---|---|
| 0 | 7,187 | 10,292,257.46 | 0.70 | 1 (reference) |
| 1–4 | 3,043 | 3,653,452.65 | 0.83 | 1.113 (1.056–1.172) |
| 5 | 3,211 | 3,614,896.68 | 0.89 | 1.197 (1.117–1.284) |


 PDF
PDF Citation
 Print
Print


 XML Download