Journal List > Cancer Res Treat > v.53(4) > 1154750

Ma, Cui, Sun, Liu, Liu, Li, Wei, Fu, Liu, and Cao: Fasting Blood Glucose, Cholesterol, and Risk of Primary Liver Cancer: The Kailuan Study

Abstract

Purpose

The influence of fasting blood glucose (FBG) and cholesterolemia primary liver cancer (PLC) in China was analyzed via a large prospective cohort study based on a community population, and the combined effects between them were investigated.

Materials and Methods

Overall, 98,936 staff from the Kailuan Group who participated in and finished physical examinations between 2006 and 2007 were included in the cohort study. Their medical information was collected and they were followed up after examination. The correlations of serum FBG or total cholesterol (TC) with PLC were analyzed. Then, we categorized all staff into four groups: normal FBG/non-hypocholesterolemia, normal FBG/hypocholesterolemia, elevated FBG/non-hypocholesterolemia, elevated FBG/hypocholesterolemia, and normal FBG/non-hypocholesterolemia was used as a control group. The combined effects of elevated FBG and hypocholesterolemia with PLC were analyzed using the Age-scale Cox proportional hazard regression model.

Results

During 1,134,843.68 person-years follow-up, a total of 388 PLC cases occurred. We found the elevated FBG and hypocholesterolemia increase the risk for PLC, respectively. Compared with the non-hypocholesterolemia/normal FBG group, the risk of PLC was significantly increased in the non-hypocholesterolemia/elevated FBG group (hazard artio [HR], 1.19; 95% confidence interval [CI], 0.88 to 1.62) and hypocholesterolemia/normal FBG group (HR, 1.53; 95% CI, 1.19 to 1.97), and in the hypocholesterolemia/elevated FBG group (HR, 3.16; 95% CI, 2.13 to 4.69). And, a significant interaction effect was found of FBG and TC on PLC. All results were independent from the influence of liver disease.

Conclusion

Elevated serum FBG and hypocholesterolemia are risk factors for PLC, especially when combined. Thus, for the prevention and treatment of PLC, serum FBG and TC levels should be investigated.

Introduction

Primary liver cancer (PLC) is a common malignant tumor in the digestive system. According to a statistical report on global cancer, the incidence of liver cancer is increasing yearly. The age-standardized incidence increased from 8.1% in 2008 to 13.9% in 2018 [1,2]. The incidence of PLC in China increased on average by 1% per year from 2000 to 2011 [3]. Hepatitis B virus infection is an important risk factor for the PLC incidence in China [4]. Recently, the rate of hepatitis B virus infection has been controlled with an increase in the rate of hepatitis B vaccination [5]. Although this has slowed the increase in PLC incidence, it has failed to reduce it [6]. Thus, the onset of PLC cannot be entirely attributed to viral hepatitis, and identifying other potential risk factors might be important for the prevention and treatment of PLC.
An epidemiological study reported that disorders of glycolipid metabolism might increase the risk of PLC. A meta-analysis study summarizing 10 cohort studies including 2,000 PLC patients reported that the onset of PLC was closely related to fasting blood glucose (FBG) levels. The risk of PLC increased by 11% per 0.56 mmol/L (10 mg/dL) increase in FBG [7]. In addition, numerous other studies have found that total cholesterol (TC) levels had a U-shape association with diverse chronic diseases, such as hemorrhagic stroke, cancer mortality and non-cardiovascular mortality [8,9]. A reduction in TC was shown to increase the risk of PLC in Nordic and Asian people [1012]. Nderitu et al. [13] demonstrated that elevated FBG and reduced serum TC were independent risk factors that influenced PLC in the AMORIS study. However, previous studies only analyzed the influence of FBG or TC on PLC alone, without considering their combined effects. The study in Kailuan was initiated in 2006, and is an ongoing prospective cohort study to investigate PLC risk factors and intervention, based on a functional community population. The study subjects received periodic examinations every 2 years, including FBG and serum TC, and the onset of malignant tumors such as PLC, which was followed up. This study provided an opportunity to explore the combined effects of FBG and serum TC in the cohort of Kailuan

Materials and Methods

1. Study subjects

The Kailuan study is a population-based prospective cohort study based on the Kailuan community in Tangshan, China, as detailed elsewhere [14]. Briefly, from 2006 to 2007, 101,510 participants (81,110 men and 20,400 women, aged 18 years or older) in the Kailuan community were enrolled, and follow-up surveys were conducted biennially.
Participants who met the following criteria were excluded: 1,255 subjects were excluded because of a lack of TC or FBG data, 380 because of a history of cancer, and 939 because of the administration of statins. Finally, 98,936 were enrolled for statistical analysis.

2. Baseline information

Information including age, sex, lifestyle (smoking, drinking, diet and exercise), education degree, malignant tumor history, administration of statins, cirrhosis and hepatitis B surface antigen was collected via questionnaires. The content of the questionnaire was described in our previously published paper [14]. Height, body weight, and blood pressure were measured by trained medical staff. Body mass index (BMI)=body mass (kg)/height2 (m2). The measurement of biochemical parameters including alanine aminotransferase (ALT) and hypersensitive C-reactive protein (Hs-CRP) was performed using a previously published method [15]. Smoking was defined as smoking at least 1 cigarette daily recently within 1 year, and drinking was defined as alcohol intake (alcohol content > 50%) ≥ 100 mL daily within 1 year, which lasted for more than 1 year. Physical exercise was defined as ≥ 4 times weekly persistent for ≥ 30 minutes each time. Education degree was classified into general education level and higher education level. Fatty liver was defined as none or mild, moderate and severe, according to ultrasound information [16].

3. Serum TC and FBG

Elbow venous blood (5 mL) was collected into an anticoagulant tube containing EDTA between 7:00 and 9:00 am after overnight fasting for ≥ 8 hours, and centrifuged at 3,000 ×g for 10 minutes to collect serum. Serum TC and FBG were measured within 4 hours. Serum TC was measured using a colorimetric method with an upper detection limit of 25.85 mmol/L. Serum FBG was measured by a hexokinase method with an upper limit detection limit of 33.3 mmol/L. The above indices were measured and analyzed using an automatic biochemistry analyzer (Hitachi 747, Hitachi, Tokyo, Japan).

4. Following up for PLC

New PLC onset cases were retrieved and surveyed from the data provided from Kailuan Group medical insurance system (Tangshan medical insurance system and the discharge information system of Kailuan General Hospital). Strictly trained investigators from the Cancer Hospital, Chinese Academy of Medical Sciences, were assigned to the hospitals to diagnose and treat new cases as well as record disease history information and confirm diagnoses. New tumor cases were inputted and checked using CanReg 4.0 software provided by the International Agency for Research on Cancer, World Health Organization (IARC/WHO) (http://www.iacr.com.fr.canreg4.htm), and further defined according to the 10th revision of the International Statistical Classification of Diseases and Related Health Problems (ICD-10). The PLC included hepatocellular carcinoma and cholangiocarcinoma (C22.0 and C22.2–C22.9).

5. Statistical analysis

According to the serum FBG and TC levels of the subjects who participated in the first physical examinations, those with FBG higher than 6.0 mmol/L and ≤ 6.0 mmol/L were assigned into the elevated FBG and normal FBG groups, respectively. Subjects with serum TC lower than 4.14 mmol/L, 4.14–6.20 mmol/L, and > 6.20 mmol/L were assigned into the hypocholesterolemia group, normal group and hypercholesterolemia group, respectively. In the analysis of the combined effect, we combined the normal cholesterol group with the high cholesterol group. Finally, all subjects were assigned into four groups: non-hypocholesterolemia and normal FBG group (G1), non-hypocholesterolemia, and elevated FBG group (G2), hypocholesterolemia and normal FBG group (G3), and hypocholesterolemia and elevated FBG group (G4). G1 was used as a control group.
The correlation between TC and FBG was analyzed by Pearson’s chi-squared test. Then, the baseline characteristics of the TC status, FBG status, and four groups were compared. Measurement data in accordance with a normal distribution were expressed as the mean±standard deviation, and the comparison between groups was analyzed by one-way analysis of variance. Measurement data in accordance with a skewed distribution were expressed as M (Q25–Q75), and the comparison between groups was analyzed by a non-parametric test (Kruskal-Wallis). Enumeration data were expressed as number (%), and the comparison between groups was analyzed by the chi-square test. The annual human incidence of PLC in each group was calculated. The accumulative incidence of PLC in different groups was calculated by the life table method and compared by the log-rank test. Hazard ratios (HR) and 95% confidence intervals (CI) of serum TC alone, serum FBG alone, and their combination on PLC were analyzed by the age-scale Cox proportional hazard model. We tested the PH assumption by examination of log-log survival curves, Schoenfield residuals, and the extended Cox models and found that the PH assumption was satisfied. Finally, exposure factors were introduced into the multivariate model as an interaction term to test the interaction between elevated FBG and hypocholesterolemia. In the Cox and interaction models, the adjusted variables included sex, age, BMI, serum TC, FBG, ALT, Hs-CRP, triglycerides (TG), serum total bilirubin (Tbil), hepatitis B surface antigen positive (HBSAg(+)), cirrhosis, smoking, drinking, exercise, fatty liver, and education degree. In the sensitivity analysis, to exclude the influence of chronic liver diseases on the results, subjects that were HBSAg(+), cirrhosis or serum ALT > 40 (U/L) were excluded from the Cox regression model analysis. To validate the result, those diagnosed as PLC within the first 2 years of follow-up were excluded. SAS ver. 9.4 (SAS Institute Inc., Cary, NC) was used to analyze the data. p < 0.05 (bilateral) indicated statistical significance.

Results

1. General condition

Among the 98,936 subjects included in the statistical analysis, there were 79,097 men and 19,839 women, with a mean age of 51.81±12.66 years, a mean FBG of 5.47±1.68 mmol/L, and a mean TC of 4.95±1.15 mmol/L. The baseline characteristics of the different TC status and FBG status are shown in Table 1. The baseline characteristics of the G1–G4 groups are shown in Table 2. Statistically significant differences were found between factors in the four groups (p < 0.01) (Table 2). The correlation coefficient between FBG and serum TC was r=0.12.

2. Cumulative incidence in different groups

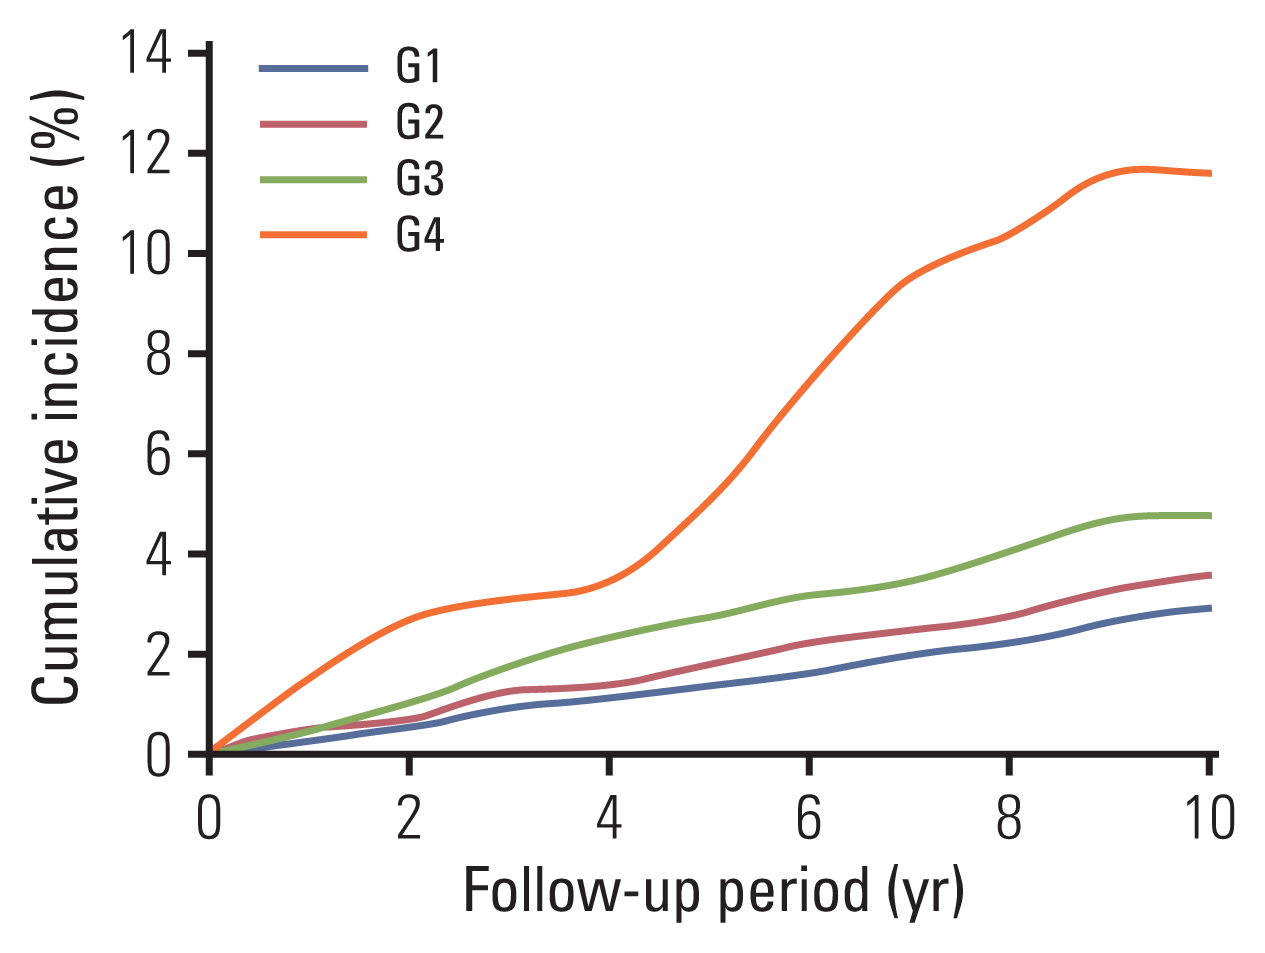
The mean follow-up period was 11.47±1.87 years, and there were 388 cases (362 men and 26 women). As shown in Fig. 1, the 10-year cumulative incidences of the G1–G4 groups were 3.35‰, 4.60‰, 6.09‰, and 11.60‰, respectively. Statistical significance was found between the four groups via the log-rank test.

3. Influence of serum TC and FBG on PLC

As shown in Table 3, the results of the univariate Cox proportional hazard model indicated that the risk of PLC was increased in the hypocholesterolemia group and the elevated FBG group compared with the control group. In the multivariate model after correction for sex, age, BMI, TC, FBG, ALT, Hs-CRP, TG, Tbil, HBSAg(+), cirrhosis, smoking, drinking, exercise, fatty liver, and education degree, the risk of PLC in the hypocholesterolemia group (serum TC < 4.14 mmol/L) was 1.71 times that in the normal group (95% CI, 1.36 to 2.13). After correction for the same confounding factors, the risk of PLC in the elevated FBG group (serum FBG ≥ 6.10 mmol/L) was 1.47 times that in the normal FBG group (95% CI, 1.14 to 1.89).

4. The combined effects of serum TC and FBG on PLC

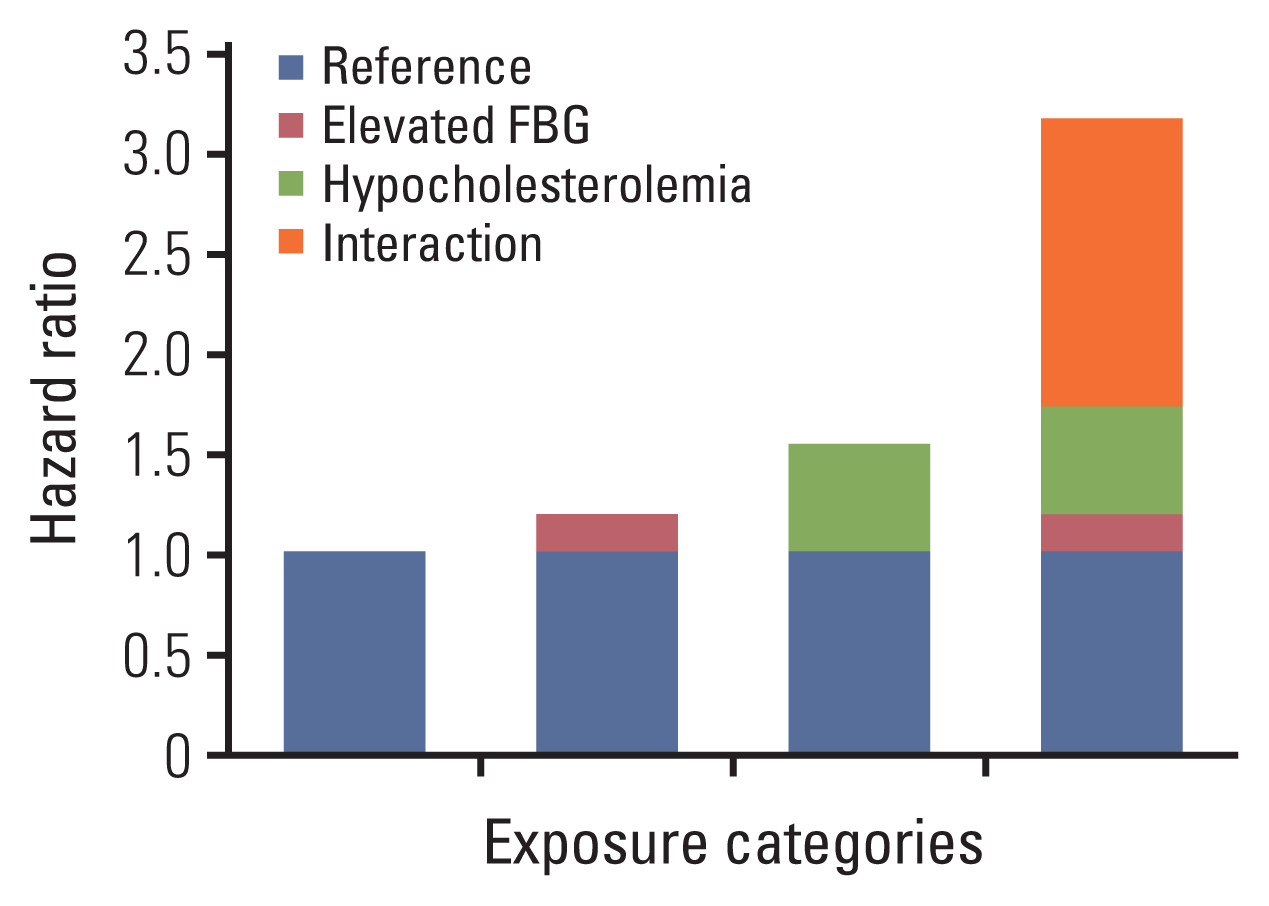
As shown in Table 4, in the univariate Cox model, the HR value of PLC risk in the G4 group (elevated FBG and hypocholesterolemia group) was higher than in the G1–G3 groups. The result of the multivariate Cox proportional hazard model indicated that after correction for confounding factors, the risk in the G4 group was increased 3.16 times (95% CI, 2.13 to 4.69) compared with the G1 group (non-hypocholesterolemia and normal FBG group). In addition, the HR in the G4 group was higher than that in the G2 (HR, 1.19; 95% CI, 0.88 to 1.62) and G3 (HR, 1.53; 95% CI, 1.19 to 1.97) groups (Table 3, Fig. 2). After correction for the same confounding factors, a significant statistical difference was found for the interaction between elevated FBG and hypocholesterolemia (relative excess risk of interaction, 1.44; 95% CI, 0.19 to 2.68 and the synergy index, 2.99; 95% CI, 1.23 to 7.24) (Table 5).
Regarding previous study on factors associated with liver cancer, obesity which is usually presented as BMI index and socioeconomic status which is measures as education degree were considered as potential factors. We therefore performed two subgroup analyses to observe the effect of BMI and educational level on development of liver cancer. As shown in Table 6, the result of the multivariate Cox proportional hazard model indicated that the risk in the G4 group in the non-obese and obese was increased 2.76 times (95% CI, 1.71 to 4.48) and 4.44 times (95% CI, 2.20 to 8.99) compared with the G1 group (non-hypocholesterolemia and normal FBG group), respectively. The results of educational level are similar.

5. Sensitivity analysis

After excluding the subjects with HBSAg(+), cirrhosis, and serum ALT > 40 (U/L), Cox regression analysis was performed. As shown in Table 7, the trend did not change for PLC risk in the hypocholesterolemia group, elevated FBG group, and G4 group. After excluding subjects with a follow-up period < 2 years, the trend did not change in the three groups.

Discussion

Using this large population-based cohort study among Chinese, we found that high FBG and low serum TC have combined effects on PLC risk. Furthermore, we confirmed the previous findings where elevated FBG and decreased serum TC were reported to be risk factors for PLC [7,11,12].
In this study, we found that elevated FBG and hypocholesterolemia had combined effects on PLC. The HR of PLC caused by the two factors simultaneously was 3.16 times (95% CI, 2.13 to 4.69) than that of the non-hypocholesterolemia and normal FBG groups, and higher than that of a single factor (hypocholesterolemia HR, 1.71; 95% CI, 1.36 to 2.13; elevated FBG HR, 1.47; 95% CI, 1.14 to 1.89). In addition, we found that elevated FBG and hypocholesterolemia had combined effects on PLC regardless of the degree of obesity, but the risk of PLC was higher in obese people. Therefore, participants with obesity and higher education level will present a higher risk of PLC due to metabolic disorders.
To the best of our knowledge, this is the first study to report a combination of elevated FBG and hypocholesterolemia leading to an increase in PLC risk. The result was compared with a meta-analysis of PLC risk factor in Chinese people, and it was found that the risks caused by elevated FBG and hypocholesterolemia ranked only second to cirrhosis, hepatitis, and liver cancer family history (odds ratio values, 11.97, 11.34, and 3.49, respectively) [17]. This suggests that not only patients with cirrhosis, hepatitis, and liver cancer family history [18], but also those with elevated FBG combined with hypocholesterolemia should be strictly observed to prevent PLC.
This study also confirmed a previous study finding where elevated FBG was an independent risk factor for PLC. Han et al. [7] reported a meta-analysis of eight cohort studies. They showed that the PLC risk increased when the FBG was higher than 6.5 mmol/L, which was consistent with our findings: elevated FBG (> 6.0 mmol/L) increased the risk of PLC (HR, 1.47; 95% CI, 1.14 to 1.89). Even though patients receiving hypoglycemic drugs were excluded, the increasing tendency of PLC did not change. A National Health Insurance Service cohort study from South Korea reported that male patients with chronic hepatitis B had increased PLC risk with increased FBG [19], although this finding was only limited to specific groups, which might not be representative for all patients. In this study, the increasing tendency did not change for subjects with or without chronic liver disease. Thus, our result is convincing.
Our study also indicated that hypocholesterolemia in Northern Chinese is an independent risk factor for PLC (HR, 1.71; 95% CI, 1.36 to 2.13). A Japan Public Health Center-Based Prospective Study in Japan also obtained similar results: hypocholesterolemia (< 4.14 mmol/L) was a risk factor for PLC (HR, 2.62; 95% CI, 1.44 to 4.76) [12], and a national cohort study in South Korea reported the same conclusion [11]. After excluding subjects with ALT > 40 μ/L, HBSAg(+), or cirrhosis, this tendency did not change. This suggests that a reduction in serum TC is a risk factor for PLC, independent from the influence of chronic disease among Northern Chinese. Thus, hypocholesterolemia should be investigated to prevent PLC. The current blood lipid guidelines in China recommend the appropriate level of serum TC should be lower than 5.2 mmol/L, but does not set the lower limit [20]. It is thought that lower cholesterol levels should reduce the risk of cerebrovascular and cardiovascular disease [21], although this is controversial. For example, lower cholesterol levels did not lower the risk of brain hemorrhage [8]. It was also reported that low TC levels led to a higher risk of all-cause mortality [22]. In addition, hypocholesterolemia increased the risk for gastric cancer and colorectal cancer [23,24]. Thus, low serum TC is beneficial for humans. When determining the appropriate range for cholesterol levels, both the risk caused by elevated cholesterol and the harm from reduced cholesterol should be considered.
Patients with chronic liver disease often develop glycolipid metabolic disorders related to abnormal liver function [25,26]. In particular, in patients with cirrhosis, insulin resistance reduces the capability of using glucose in peripheral tissues and the activities of enzymes participating in glucose metabolism, resulting in reduced glycogen synthesis and elevated blood glucose. FBG increased as the severity of chronic liver disease increased [27,28]. However, damage to hepatocytes leads to a decline in the synthesis and secretion of serum cholesterol, followed by a reduction in serum TC. Therefore, some experts suggest that the increased PLC risk is caused by chronic liver disease; however, this is not supported by our study. First, after subjects that were HBSAg(+), or with cirrhosis or abnormal liver function (ALT > 40 U/L) were excluded, the tendency did not change. Second, the numbers of subjects in the elevated FBG alone group (n=13,791) and hypocholesterolemia alone group (n=17,319) were different, and higher than that in the combination elevated FBG and hypocholesterolemia group, suggesting elevated FBG and reduced TC were not caused by chronic liver disease.
The reasons why the combined effects of high FBG and hypocholesterolemia lead to PLC remains unclear, but might be related to insulin resistance, chronic inflammation and oxidative stress. Elevated blood glucose often accompanies insulin resistance, resulting in the release of proinflammatory factors such as tumor necrosis factor-α and interleukin-6, which induce chronic inflammation that damages tissues in the body [29]. However, elevated blood glucose also increases the generation and use of insulin like growth factor 1, which promotes the proliferation of cancer cells and inhibits apoptosis [3032], thus causing liver cancer. Furthermore, the serum antioxidant reserve capacity depends on serum TC, and hypocholesterolemia may increase susceptibility to oxidative stress and promote liver cancer [33]. Previous studies found that elevated FBG and hypocholesterolemia-induced inflammation is mediated through the generation of reactive oxygen species and activation of the mitogen-activated protein kinases and nuclear factor κB signaling pathways, leading to hepatocytes abnormal change and proliferation.
This study demonstrated that combined elevated FBG and serum TC affected PLC risk. Thus, during PLC screening, traditional risk factors such as chronic hepatitis and cirrhosis as well as FBG and serum TC should be detected. If a combination of elevated FBG and hypocholesterolemia is found, patients should be given information about early effective interventions such as a healthy lifestyle and timely consultation with a doctor to reduce PLC risk.

1. Advantage of this study

To the best of our knowledge, this is the first study to report the combination of elevated FBG and hypocholesterolemia increases PLC risk. A Kailuan cohort study with a large sample size was used to determine the correlation of FBG and serum cholesterol with PLC risk among general Chinese people. A combination effect was found for these two factors. Because this was a large cohort study, we avoided selection or recall bias in the control group. In addition, the data source was from conventional physical examinations rather than examinations at the time of PLC diagnosis. We also adjusted concomitant variables as much as possible, including lifestyle, serum biochemical parameters, cancer family history, and chronic liver diseases (cirrhosis, hepatitis B surface antigen, fatty liver), which ensured we reduced the influence of potential confounding factors. Finally, in the sensitivity analysis, after we excluded subjects with HBSAg(+), cirrhosis, and ALT > 40 U/L, the tendency remained, indicating that the effects of high FBG and low serum TC on PLC were independent of chronic liver disease.

2. Limitations

This study had some limitations. First, the study outcome cannot differentiate between hepatocellular carcinoma and cholangiocarcinoma, or explain the influence of FBG and serum cholesterol on PLC cancer type. Hepatocellular carcinoma accounts for 80%–90% of PLC; therefore, our results are a reference value. Second, there was no information of hepatitis C virus infection in the study, although the epidemiology survey data indicated the PLC risk in Chinese people suffering from viral hepatitis is low. Finally, we only used single measurement data, without exploring the influence of long-term FBG and serum TC change on PLC. Therefore, whether such changes affect PLC requires further study.
In conclusion, our study suggested that elevated FBG and decreased serum TC are associated with increased risk of PLC, repectively and high FBG and low serum TC have combined effects on PLC risk.

Notes

Ethical Statement

This study was approved by the Ethics Committees of the Kailuan General Hospital (No. 200605). Written informed consent was provided by all participants. The study was performed in accordance with the Declaration of Helsinki.

Author Contributions

Conceived and designed the analysis: Cui H, Sun M.

Collected the data: Liu X, Li G, Wei Y.

Contributed data or analysis tools: Wei Y, Fu Q, Liu S.

Performed the analysis: Cui H, Liu Q.

Wrote the paper: Ma X, Cui H, Cao L.

Conflict of interest

Conflict of interest relevant to this article was not reported.

ACKNOWLEDGMENTS

The authors thank all the members of the Kailuan Study Team for their contributions and the participants who contributed their data.

References

1. Jemal A, Bray F, Center MM, Ferlay J, Ward E, Forman D. Global cancer statistics. CA Cancer J Clin. 2011; 61:69–90.
crossref
2. Siegel RL, Miller KD, Jemal A. Cancer statistics, 2018. CA Cancer J Clin. 2018; 68:7–30.
crossref
3. Zuo T, Zheng R, Zeng H, Zhang S, Chen W. Analysis of liver cancer incidence and trend in China. Zhonghua Zhong Liu Za Zhi. 2015; 37:691–6.
4. Yuen MF, Hou JL, Chutaputti A. Asia Pacific Working Party on Prevention of Hepatocellular Carcinoma. Hepatocellular carcinoma in the Asia pacific region. J Gastroenterol Hepatol. 2009; 24:346–53.
crossref
5. Polaris Observatory Collaborators. Global prevalence, treatment, and prevention of hepatitis B virus infection in 2016: a modelling study. Lancet Gastroenterol Hepatol. 2018; 3:383–403.
6. Chang MH, You SL, Chen CJ, Liu CJ, Lee CM, Lin SM, et al. Decreased incidence of hepatocellular carcinoma in hepatitis B vaccinees: a 20-year follow-up study. J Natl Cancer Inst. 2009; 101:1348–55.
crossref
7. Han H, Zhang T, Jin Z, Guo H, Wei X, Liu Y, et al. Blood glucose concentration and risk of liver cancer: systematic review and meta-analysis of prospective studies. Oncotarget. 2017; 8:50164–73.
crossref
8. Ma C, Gurol ME, Huang Z, Lichtenstein AH, Wang X, Wang Y, et al. Low-density lipoprotein cholesterol and risk of intracerebral hemorrhage: a prospective study. Neurology. 2019; 93:e445–57.
9. Ukawa S, Tamakoshi A, Murakami Y, Kiyohara Y, Yamada M, Nagai M, et al. Pooled analysis of the associations between body mass index, total cholesterol, and liver cancer-related mortality in Japan. Asian Pac J Cancer Prev. 2018; 19:2089–95.
10. Strohmaier S, Edlinger M, Manjer J, Stocks T, Bjorge T, Borena W, et al. Total serum cholesterol and cancer incidence in the Metabolic syndrome and Cancer Project (Me-Can). PLoS One. 2013; 8:e54242.
crossref
11. Kitahara CM, Berrington de Gonzalez A, Freedman ND, Huxley R, Mok Y, Jee SH, et al. Total cholesterol and cancer risk in a large prospective study in Korea. J Clin Oncol. 2011; 29:1592–8.
crossref
12. Iso H, Ikeda A, Inoue M, Sato S, Tsugane S. JPHC Study Group. Serum cholesterol levels in relation to the incidence of cancer: the JPHC study cohorts. Int J Cancer. 2009; 125:2679–86.
crossref
13. Nderitu P, Bosco C, Garmo H, Holmberg L, Malmstrom H, Hammar N, et al. The association between individual metabolic syndrome components, primary liver cancer and cirrhosis: a study in the Swedish AMORIS cohort. Int J Cancer. 2017; 141:1148–60.
crossref
14. Feng X, Wang G, Li N, Lyu Z, Chen S, Wei L, et al. The association between fasting blood glucose and the risk of primary liver cancer in Chinese males: a population-based prospective study. Br J Cancer. 2017; 117:1405–11.
crossref
15. Wang G, Li N, Chang S, Bassig BA, Guo L, Ren J, et al. A prospective follow-up study of the relationship between C-reactive protein and human cancer risk in the Chinese Kailuan Female Cohort. Cancer Epidemiol Biomarkers Prev. 2015; 24:459–65.
crossref
16. Shen X, Jin C, Wu Y, Zhang Y, Wang X, Huang W, et al. Prospective study of perceived dietary salt intake and the risk of non-alcoholic fatty liver disease. J Hum Nutr Diet. 2019; 32:802–9.
crossref
17. Luo RH, Zhao ZX, Zhou XY, Gao ZL, Yao JL. Risk factors for primary liver carcinoma in Chinese population. World J Gastroenterol. 2005; 11:4431–4.
crossref
18. European Association for the Study of the Liver. EASL clinical practice guidelines: management of hepatocellular carcinoma. J Hepatol. 2018; 69:182–236.
19. Kim K, Choi S, Park SM. Association of fasting serum glucose level and type 2 diabetes with hepatocellular carcinoma in men with chronic hepatitis B infection: a large cohort study. Eur J Cancer. 2018; 102:103–13.
crossref
20. Joint committee for guideline revision. 2016 Chinese guidelines for the management of dyslipidemia in adults. J Geriatr Cardiol. 2018; 15:1–29.
21. Boekholdt SM, Hovingh GK, Mora S, Arsenault BJ, Amarenco P, Pedersen TR, et al. Very low levels of atherogenic lipoproteins and the risk for cardiovascular events: a meta-analysis of statin trials. J Am Coll Cardiol. 2014; 64:485–94.
22. Tanamas SK, Saulnier PJ, Hanson RL, Nelson RG, Hsueh WC, Sievers ML, et al. Serum lipids and mortality in an American Indian population: a longitudinal study. J Diabetes Complications. 2018; 32:18–26.
crossref
23. Asano K, Kubo M, Yonemoto K, Doi Y, Ninomiya T, Tanizaki Y, et al. Impact of serum total cholesterol on the incidence of gastric cancer in a population-based prospective study: the Hisayama study. Int J Cancer. 2008; 122:909–14.
crossref
24. Yao X, Tian Z. Dyslipidemia and colorectal cancer risk: a meta-analysis of prospective studies. Cancer Causes Control. 2015; 26:257–68.
crossref
25. Chrostek L, Supronowicz L, Panasiuk A, Cylwik B, Gruszewska E, Flisiak R. The effect of the severity of liver cirrhosis on the level of lipids and lipoproteins. Clin Exp Med. 2014; 14:417–21.
crossref
26. Khalili M, Lombardero M, Chung RT, Terrault NA, Ghany MG, Kim WR, et al. Diabetes and prediabetes in patients with hepatitis B residing in North America. Hepatology. 2015; 62:1364–74.
crossref
27. Guo CH, Sun TT, Weng XD, Zhang JC, Chen JX, Deng GJ. The investigation of glucose metabolism and insulin secretion in subjects of chronic hepatitis B with cirrhosis. Int J Clin Exp Pathol. 2015; 8:13381–6.
28. Zhao Y, Xing H. A different perspective for management of diabetes mellitus: controlling viral liver diseases. J Diabetes Res. 2017; 2017:5625371.
crossref
29. Papa S, Bubici C, Zazzeroni F, Franzoso G. Mechanisms of liver disease: cross-talk between the NF-kappaB and JNK pathways. Biol Chem. 2009; 390:965–76.
30. Weng CJ, Hsieh YH, Tsai CM, Chu YH, Ueng KC, Liu YF, et al. Relationship of insulin-like growth factors system gene polymorphisms with the susceptibility and pathological development of hepatocellular carcinoma. Ann Surg Oncol. 2010; 17:1808–15.
crossref
31. Adachi Y, Nojima M, Mori M, Matsunaga Y, Akutsu N, Sasaki S, et al. Insulin-like growth factor-related components and the risk of liver cancer in a nested case-control study. Tumour Biol. 2016; 37:15125–32.
crossref
32. Wiencke JK. Impact of race/ethnicity on molecular pathways in human cancer. Nat Rev Cancer. 2004; 4:79–84.
crossref
33. Muldoon MF, Kritchevsky SB, Evans RW, Kagan VE. Serum total antioxidant activity in relative hypo- and hypercholesterolemia. Free Radic Res. 1996; 25:239–45.
crossref

Fig. 1
Accumulative incidence curves of primary liver cancer in G1–G4 groups.
crt-2020-817f1.gif
Fig. 2
Influence of the combined effects of serum total cholesterol and fasting blood glucose (FBG) on primary liver cancer by the multivariate Cox proportional hazard model.
crt-2020-817f2.gif
Table 1
The baseline characteristics of the different TC status and FBG status
Normal FBG group Elevated FBG group p-value Hypocholesterolemia group Normal group Hypercholesterolemia group p-value
No. 82,514 16,422 19,950 68,119 10,599
Male sex 65,117 (78.9) 13,980 (85.1) <0.001 16,034 (80.3) 54,448 (79.9) 8,393 (79.2) 0.048
Age (yr) 51.19±12.87 54.96±11.05 < 0.001 50.17±14.21 52.03±12.36 53.48±11.06 < 0.001
BMI (kg/m2) 24.84±3.46 26.02±3.47 < 0.001 24.66±3.56 25.05±3.47 25.59±3.38 < 0.001
TC (mmol/L) 4.90±1.12 5.19±1.26 < 0.001 3.48±0.78 5.06±0.55 6.94±1.04 < 0.001
FBG (mmol/L) 4.95±0.58 8.09±2.66 < 0.001 5.26±1.44 5.46±1.62 5.95±2.25 < 0.001
ALT (U/L) 18.00 (12.70–24.00) 19.00 (14.00–26.80) < 0.001 18.00 (12.00–24.00) 18.00 (13.00–24.00) 19.00 (13.00–29.00) < 0.001
Hs-CRP (mmol/L) 0.80 (0.30–2.27) 1.11 (0.43–2.75) < 0.001 0.80 (0.27–2.40) 0.83 (0.30–2.38) 1.00 (0.40–2.40) < 0.001
TG (mmol/L) 1.22 (0.86–1.83) 1.56 (1.09–2.43) < 0.001 1.11 (0.75–1.78) 1.26 (0.91–2.86) 1.69 (1.20–2.59) < 0.001
Tbil (mmol/L) 12.30 (9.80–15.30) 12.10 (9.70–14.90) < 0.001 11.90 (9.40–15.20) 12.40 (9.90–15.40) 12.10 (9.60–14.70) < 0.001
HBSAg(+) 2,225 (2.7) 419 (2.6) 0.414 768 (3.9) 1,705 (2.5) 168 (1.6) < 0.001
Cirrhosis 261 (0.3) 71 (0.4) 0.019 110 (0.6) 205 (0.3) 17 (0.2) < 0.001
Smoking 24,804 (30.9) 4,923 (30.8) 0.845 5,530 (28.5) 20,464 (30.9) 3,632 (34.9) < 0.001
Drinking 14,196 (17.7) 3,104 (19.4) < 0.001 2,773 (14.3) 11,927 (17.9) 2,530 (24.3) < 0.001
Physical exercise 12,023 (15.1) 2,785 (17.6) 0.136 2,698 (14.1) 10,164 (15.5) 1,888 (18.2) < 0.001
Higher education level 16,583 (20.8) 2,444 (15.5) < 0.001 4,666 (24.2) 12,474 (18.9) 1,839 (17.7) < 0.001

Values are presented as number (%) or mean±SD. ALT, alanine aminotransferase; BMI, body mass index; FBG, fasting blood glucose; HBSAg, hepatitis B surface antigen; Hs-CRP, hypersensitive C-reactive protein; SD, standard deviation; Tbil, total bilirubin; TC, total cholesterol; TG, triacylglycerol.

Table 2
Comparison of the general condition in different groups
G1 G2 G3 G4 p-value
No. 65,195 13,791 17,319 2,631 -
Male sex 51,388 (78.8) 11,675 (84.7) 13,729 (79.3) 2,305 (87.6) < 0.001
Age (yr) 51.64±12.40 55.00±10.79 49.48±14.35 54.72±12.33 < 0.001
BMI (kg/m2) 24.93±3.43 26.05±3.46 24.48±3.54 25.84±3.51 < 0.001
TC (mmol/L) 5.27±0.87 5.52±1.02 3.49±0.78 3.43±0.82 < 0.001
FBG (mmol/L) 4.98±0.57 8.13±2.71 4.87±0.60 7.87±2.37 < 0.001
ALT (U/L) 18.00 (13.00–24.00) 19.00 (14.00–27.00) 17.00 (12.00–23.00) 19.00 (14.00–26.00) < 0.001
Hs-CRP (mmol/L) 0.80 (0.30–2.23) 1.13 (0.45–2.79) 0.75 (0.25–2.35) 1.01 (0.37–2.60) < 0.001
TG (mmol/L) 1.26 (0.91–1.86) 1.59 (1.11–2.42) 1.07 (0.73–1.69) 1.41 (0.95–2.49) < 0.001
Tbil (mmol/L) 12.40 (9.80–15.30) 12.10 (9.80–15.00) 12.00 (9.40–15.20) 11.80 (9.40–14.50) < 0.001
HBSAg(+) 1,557 (2.4) 319 (2.3) 668 (3.9) 100 (3.9) < 0.001
Cirrhosis 172 (0.3) 50 (0.4) 89 (0.5) 21 (0.8) < 0.001
Smoking 19,999 (31.5) 4,198 (31.2) 4,805 (28.5) 725 (28.5) < 0.001
Drinking 11,842 (18.6) 2,685 (20.0) 2,354 (14.0) 419 (16.5) < 0.001
Physical exercise 9,726 (15.5) 2,384 (17.9) 2,297 (13.8) 401 (16.0) < 0.01
Higher education level 12,405 (19.7) 1,956 (14.7) 4,178 (24.9) 488 (19.5) < 0.001

Values are presented as number (%) or mean±SD. G1, non-hypocholesterolemia and normal FBG group; G2, non-hypocholesterolemia and elevated FBG group; G3, hypocholesterolemia and normal FBG group; G4, hypocholesterolemia and elevated FBG group. ALT, alanine aminotransferase; BMI, body mass index; FBG, fasting blood glucose; HBSAg, hepatitis B surface antigen; Hs-CRP, hypersensitive C-reactive protein; SD, standard deviation; Tbil, total bilirubin; TC, total cholesterol; TG, triacylglycerol.

Table 3
Influence of serum TC and FBG on PLC
Univariate model Multivariate model
Serum TC
 Normal group Reference Reference
 Hypocholesterolemia group 2.03 (1.64–2.52) 1.71 (1.36–2.13)
 Hypercholesterolemia group 0.64 (0.42–0.96) 0.81 (0.53–1.24)
 Continuous TC 0.72 (0.66–0.78) 0.78 (0.72–0.86)
Serum FBG
 Normal FBG group Reference Reference
 Elevated FBG group 1.25 (0.98–1.60) 1.47 (1.14–1.89)
 Continuous FBG 1.05 (1.00–1.10) 1.06 (1.01–1.11)

The multi-factor model was adjusted for sex, age, BMI, TC, FBG, ALT, Hs-CRP, TG, Tbil, HBSAg(+), cirrhosis, smoking, drinking, physical exercise, fatty liver, and education degree. ALT, alanine aminotransferase; BMI, body mass index; FBG, fasting blood glucose; HBSAg, hepatitis B surface antigen; Hs-CRP, hypersensitive C-reactive protein; PLC, primary liver cancer; Tbil, total bilirubin; TC, total cholesterol; TG, triacylglycerol.

Table 4
Influence of combined effects of serum TC and FBG on PLC
No. No. of cases Incidence (10K/person-year) Univariate model Multivariate model
G1 65,195 207 2.75 Reference Reference
G2 13,791 55 3.47 1.15 (0.86–1.55) 1.19 (0.88–1.62)
G3 17,319 97 4.88 2.01 (1.58–2.55) 1.53 (1.19–1.97)
G4 2,631 29 9.96 3.36 (2.28–4.95) 3.16 (2.13–4.69)

The multi-factor model was adjusted for sex, age, BMI, TC, FBG, ALT, Hs-CRP, TG, Tbil, HBSAg(+), cirrhosis, smoking, drinking, physical exercise, fatty liver, and education degree. G1, non-hypocholesterolemia and normal FBG group; G2, non-hypocholesterolemia and elevated FBG group; G3, hypocholesterolemia and normal FBG group; G4, hypocholesterolemia and elevated FBG group. ALT, alanine aminotransferase; BMI, body mass index; FBG, fasting blood glucose; HBSAg, hepatitis B surface antigen; Hs-CRP, hypersensitive C-reactive protein; PLC, primary liver cancer; Tbil, total bilirubin; TC, total cholesterol; TG, triacylglycerol.

Table 5
Index of interactive effect between serum TC and FBG on PLC
RERI (95% CI) SI (95% CI)
Total 1.44 (0.19 to 2.68) 2.99 (1.23 to 7.24)
Non-obese 0.93 (−0.45 to 2.30) 2.05 (0.78 to 5.41)
Obese 3.08 (0.10 to 6.07) 10.60 (0.31 to 6.91)
General education level 1.28 (0.04 to 2.52) 3.20 (1.08 to 9.49)
Higher education level 2.95 (−2.04 to 7.94) 3.53 (0.51 to 24.43)

The multi-factor model was adjusted for sex, age, BMI, TC, FBG, ALT, Hs-CRP, TG, Tbil, HBSAg(+), cirrhosis, smoking, drinking,physical exercise, fatty liver, and education degree. ALT, alanine aminotransferase; BMI, body mass index; CI, confidence interval; FBG, fasting blood glucose; HBSAg, hepatitis B surface antigen; Hs-CRP, hypersensitive C-reactive protein; PLC, primary liver cancer; RERI, relative excess risk of interaction; SI, the synergy index; Tbil, total bilirubin; TC, total cholesterol; TG, triacylglycerol.

Table 6
Influence of combined effects of serum TC and FBG on PLC in subgroup
Non-obese Obese General education level Higher education level
G1 Reference Reference Reference Reference
G2 1.31 (0.92–1.86) 0.94 (0.50–1.77) 1.17 (0.85–1.62) 1.05 (0.35–3.14)
G3 1.56 (1.18–2.06) 1.41 (0.75–2.66) 1.41 (1.07–1.85) 2.12 (0.98–4.97)
G4 2.76 (1.71–4.48) 4.44 (2.20–8.99) 2.86 (1.87–4.41) 5.12 (1.87–14.05)

The multi-factor model was adjusted for sex, age, BMI, TC, FBG, ALT, Hs-CRP, TG, Tbil, HBSAg(+), cirrhosis, smoking, drinking, physical exercise, fatty liver, and education degree. Obese: BMI ≥ 24 kg/m2. G1, non-hypocholesterolemia and normal FBG group; G2, non-hypocholesterolemia and elevated FBG group; G3, hypocholesterolemia and normal FBG group; G4, hypocholesterolemia and elevated FBG group. ALT, alanine aminotransferase; BMI, body mass index; FBG, fasting blood glucose; HBSAg, hepatitis B surface antigen; Hs-CRP, hypersensitive C-reactive protein; PLC, primary liver cancer; Tbil, total bilirubin; TC, total cholesterol; TG, triacylglycerol.

Table 7
Sensitivity analysis of the influence of the combined effects of serum TC and FBG on PLC
Sensitivity analysis 1a Sensitivity analysis 2a Sensitivity analysis 3a Sensitivity analysis 4a
Serum TC
 Normal group Reference Reference Reference Reference
 Hypocholesterolemia group 1.76 (1.30–2.38) 1.55 (1.21–1.99) 1.75 (1.39–2.20) 1.71 (1.36–2.13)
 Hypercholesterolemia group 0.81 (0.49–1.34) 0.75 (0.49–1.17) 0.83 (0.54–1.28) 0.81 (0.53–1.24)
 Normal group 0.78 (0.69–0.87) 0.79 (0.72–0.87) 0.78 (0.71–0.86) 0.78 (0.72–0.86)
Serum FBG
 Normal FBG Reference Reference Reference Reference
 Elevated FBG 1.47 (1.06–2.02) 1.46 (1.11–1.91) 1.42 (1.09–1.84) 1.47 (1.14–1.89)
 Continuous FBG 1.08 (1.02–1.15) 1.06 (1.01–1.11) 1.06 (1.01–1.11) 1.06 (1.01–1.11)
Serum TC and FBG
 G1 Reference Reference Reference Reference
 G2 1.13 (0.76–1.67) 1.23 (0.89–1.69) 1.14 (0.83–1.58) 1.19 (0.88–1.62)
 G3 1.50 (1.06–2.11) 1.46 (1.12–1.94) 1.56 (1.20–2.02) 1.53 (1.19–1.97)
 G4 3.54 (2.17–5.76) 2.85 (1.84–4.43) 3.16 (2.10–4.76) 3.16 (2.13–4.69)
 RERI 1.92 (0.21–3.63) 1.16 (−0.10–2.43) 1.46 (0.17–2.75) 1.44 (0.19–2.68)
 SI 4.08 (1.18–14.04) 2.69 (0.97–7.40) 3.08 (1.22–7.81) 2.99 (1.23–7.24)

The multi-factor model was adjusted for sex, age, BMI, TC, FBG, Hs-CRP, TG, Tbil, smoking, drinking, physical exercise, fatty liver, and education degree. G1, non-hypocholesterolemia and normal FBG group; G2, non-hypocholesterolemia and elevated FBG group; G3, hypocholesterolemia and normal FBG group; G4, hypocholesterolemia and elevated FBG group. Sensitivity analysis 1: 2,644 cases with HBSAg(+) were excluded; Sensitivity analysis 2: 332 cases with cirrhosis were excluded; Sensitivity analysis 3: 6,334 cases with ALT > 40 (U/L) were excluded; Sensitivity analysis 4: 26 PLC patients with a follow-up period < 2 years were excluded. ALT, alanine aminotransferase; BMI, body mass index; FBG, fasting blood glucose; HBSAg, hepatitis B surface antigen; Hs-CRP, hypersensitive C-reactive protein; PLC, primary liver cancer; RERI, relative excess risk of interaction; SI, synergy index; Tbil, total bilirubin; TC, total cholesterol; TG, triacylglycerol.

TOOLS
Similar articles