Journal List > Cancer Res Treat > v.53(1) > 1154690

Sun, Chang, Liu, Jiang, Gong, Ma, Zhao, and Wu: Adherence to Cancer Prevention Guidelines and Endometrial Cancer Risk: Evidence from a Systematic Review and Dose-Response Meta-analysis of Prospective Studies

Abstract

Purpose

The evidence of adherence to cancer prevention guidelines and endometrial cancer (EC) risk has been limited and controversial. This study summarizes and quantifies the relationship between adherence to cancer prevention guidelines and EC risk.

Materials and Methods

The online databases PubMed, Web of Science, and EMBASE were searched for relevant publications up to June 2, 2020. This study had been registered at PROSPERO. The registration number is CRD42020149966. Study quality evaluation was performed based on the Newcastle-Ottawa Scale. The I2 statistic was used to estimate heterogeneity among studies. Egger’s and Begg’s tests assessed potential publication bias. Summary hazard ratios (HRs) and 95% confidence intervals (CIs) for the relationship between adherence to cancer prevention guidelines score was assigned to participants by summarizing individual scores for each lifestyle-related factor. The scores ranged from least healthy (0) to most healthy (20) and the EC risk was calculated using a random-effects model.

Results

Five prospective studies (four cohort studies and one case-cohort study) consisted of 4,470 EC cases, where 597,047 participants were included. Four studies had a low bias risk and one study had a high bias risk. Summary EC HR for the highest vs. lowest score of adherence to cancer prevention guidelines was 0.54 (95% CI, 0.40 to 0.73) and had a high heterogeneity (I2=86.1%). For the dose-response analysis, an increment of 1 significantly reduced the risk of EC by 6%. No significant publication bias was detected.

Conclusion

This study suggested that adherence to cancer prevention guidelines was negatively related to EC risk.

Introduction

Endometrial cancer (EC) is the sixth leading cancer in women around the world [1]. Compared to less developed nations (5.9 per 100,000), researchers have observed a higher rate of this disease in more developed nations (13.0 per 100,000) [1]. The incidence rate of EC has been increasing over the last few decades [2]. According to the GLOBOCAN 2018 statistics, there will be 382,069 new EC cases and 89,929 EC-associated deaths worldwide [3]. EC is the most common gynecologic malignancy in the United States and the fourth most common type of cancer in women after lung, breast, and colorectal cancers [4]. Although a U.S. study has shown that EC rates have been stable between 1992 and 2002 (in women between the ages of 50 and 70), they have been increasing by 2.5% yearly, with a 10% increase between 2006 and 2012 [5]. These data indicate that the incidence of EC has been increasing.
Increasing evidence from experimental and epidemiological researches has indicated that modifiable lifestyle-related factors could influence the EC risk [6,7]. Prior research has determined that a higher body mass index (BMI), poor dietary habits, excess alcohol consumption, and physical inactivity are established risk factors of EC [810]. Since an individual’s lifestyle habits typically cluster, existing evidence suggests that a greater decrease or increase in risk of chronic diseases might be attributed to combined lifestyle-related factors compared to effects of each individual factor [11]. Therefore, simultaneous associations of these lifestyle habits should be considered. The American Cancer Society (ACS) and the World Cancer Research Fund/American Institute for Cancer Research (WCRF/AICR) publish cancer prevention recommendations for individuals and community action.
Adherence to cancer prevention guidelines scores can be developed on the basis of multiple lifestyle-related factors, including physical activity, BMI, alcohol consumption, and various aspects of a healthy diet. According to the individual scores for each lifestyle-related factor, the present study assigned an adherence score to participants by summarizing them which the scores ranged from least healthy (0) to most healthy (20), with intervals of 1 or 0.5 [1214]. Using these adherence scores might allow to investigate overall behavioral patterns. Although several studies have assessed the association between adherence to cancer prevention guidelines score and EC risk, their results have not been consistent [1217]. To date, none of study has comprehensively evaluated this topic. Additionally, the dose-response evidence between adherence to cancer prevention guidelines score and EC risk are needed. Therefore, we carried out this systematic review and dose-response meta-analysis on adherence to cancer prevention guidelines score and the risk of EC by synthesizing published original studies.

Materials and Methods

The current systematic review and meta-analysis was performed in compliance with the Preferred Reporting Items for Systematic Reviews and Meta-Analyses guidelines and the Meta-analysis of observational studies in epidemiology guidelines. Its protocol has been registered in the International Prospective Register of Systematic Reviews (PROSPERO; registration number: CRD42020149966).

1. Literature search

The literature search was performed independently by two researchers (Jiang YT and Gong TT) using PubMed, EMBASE, and Web of Science databases up to June 2, 2020 for studies investigating the association between adherence to cancer prevention guidelines score and EC risk. The following search strategy was used: (lifestyle habit OR cancer prevention OR nutrition OR physical activity OR healthy lifestyle index OR adherence OR dietary quality OR cancer prevention guideline) AND ((endometrial OR endometrium) AND (cancer OR neoplasm OR carcinoma)). Additionally, we manually checked the references lists of included studies to identify other potentially eligible publications. The search studies were limited to human studies.

2. Study selection

Published studies meeting the following criteria were included: (1) studies with prospective design; (2) interest exposure was adherent to cancer prevention guidelines score; (3) cancer prevention guidelines included at least two related lifestyle factors; (4) adherence score was made up of related lifestyle factors, with more points indicating healthier behavior; (5) incidence of EC was the primary interest outcome; (6) participant age was ≥ 18 years; (7) risk estimates available or adequate data necessary for calculation are present. When overlapping data appeared in multiple publications, only the study containing largest sample size was included.

3. Data extraction

Two investigators (Sun H and Liu YS) independently conducted the data extraction. Any disagreement has been carefully discussed and resolved. The following data were extracted from the eligible publications: publication year, first author, study geographical location, duration of follow-up, person-year, study design, number of cases, score category and corresponding risk estimate, and covariates adjusted in multivariable analyses. The most fully adjusted relative risks (RRs)/hazard ratios (HRs) were chosen when several estimates for the same exposure were reported with different levels of adjustment.

4. Quality assessment

Two investigators (Sun H and Jiang YT) independently conducted the quality assessment. Any nonconformity has been discussed and resolved. The Newcastle-Ottawa assessment scale was used to evaluate the methodological quality of included studies [18]. Studies that achieved a full rating in at least two categories of the three assessments were considered to have a low risk of bias [19].

5. Statistical analysis

In the current study, random-effects model was used to calculate the summarized effect sizes [20].
A method proposed by Greenland and Orsini was used to evaluate the linear dose-response association between adherence to cancer prevention guidelines score and risk of EC [21]. In the mentioned method, distribution of cases and RRs/HRs with the variance estimates for ≥ 3 quantitative categories of exposure were required. The midpoint of adherence to cancer prevention guidelines score in each category was defined as the corresponding RRs/HRs estimate. The midpoint in each category was estimated by calculating the mean of the lower and upper boundary for studies that have reported a range for adherence to cancer prevention guidelines score. The length of these open-ended intervals was assumed to be the same as that of the adjacent intervals when the highest and lowest categories were open-ended. On the basis of current studies, the pooled HRs/RRs of the dose-response meta-analyses are presented in increments of one unit a time for adherence to the cancer prevention guidelines score [12,13]. Due to insufficient data in the primary analyses, this study was unable to assess possible non-linear association between adherence to cancer prevention guidelines score and the risk of EC.
The I2 statistic was used to estimate heterogeneity among studies. Sensitivity analyses were performed by excluding one study at a time to explore whether the results were strongly influenced by any specific study. Potential publication bias was assessed using Egger’s and Begg’s tests. Both tests are formalized statistical tests for assessing funnel plot asymmetry and are considered a standard procedure for meta-analysis. A p < 0.05 was considered significant. Statistical analyses were performed with STATA ver. 12.0 (Stata Corp., College Station, TX).

Results

1. Literature search, study characteristics, and quality assessment

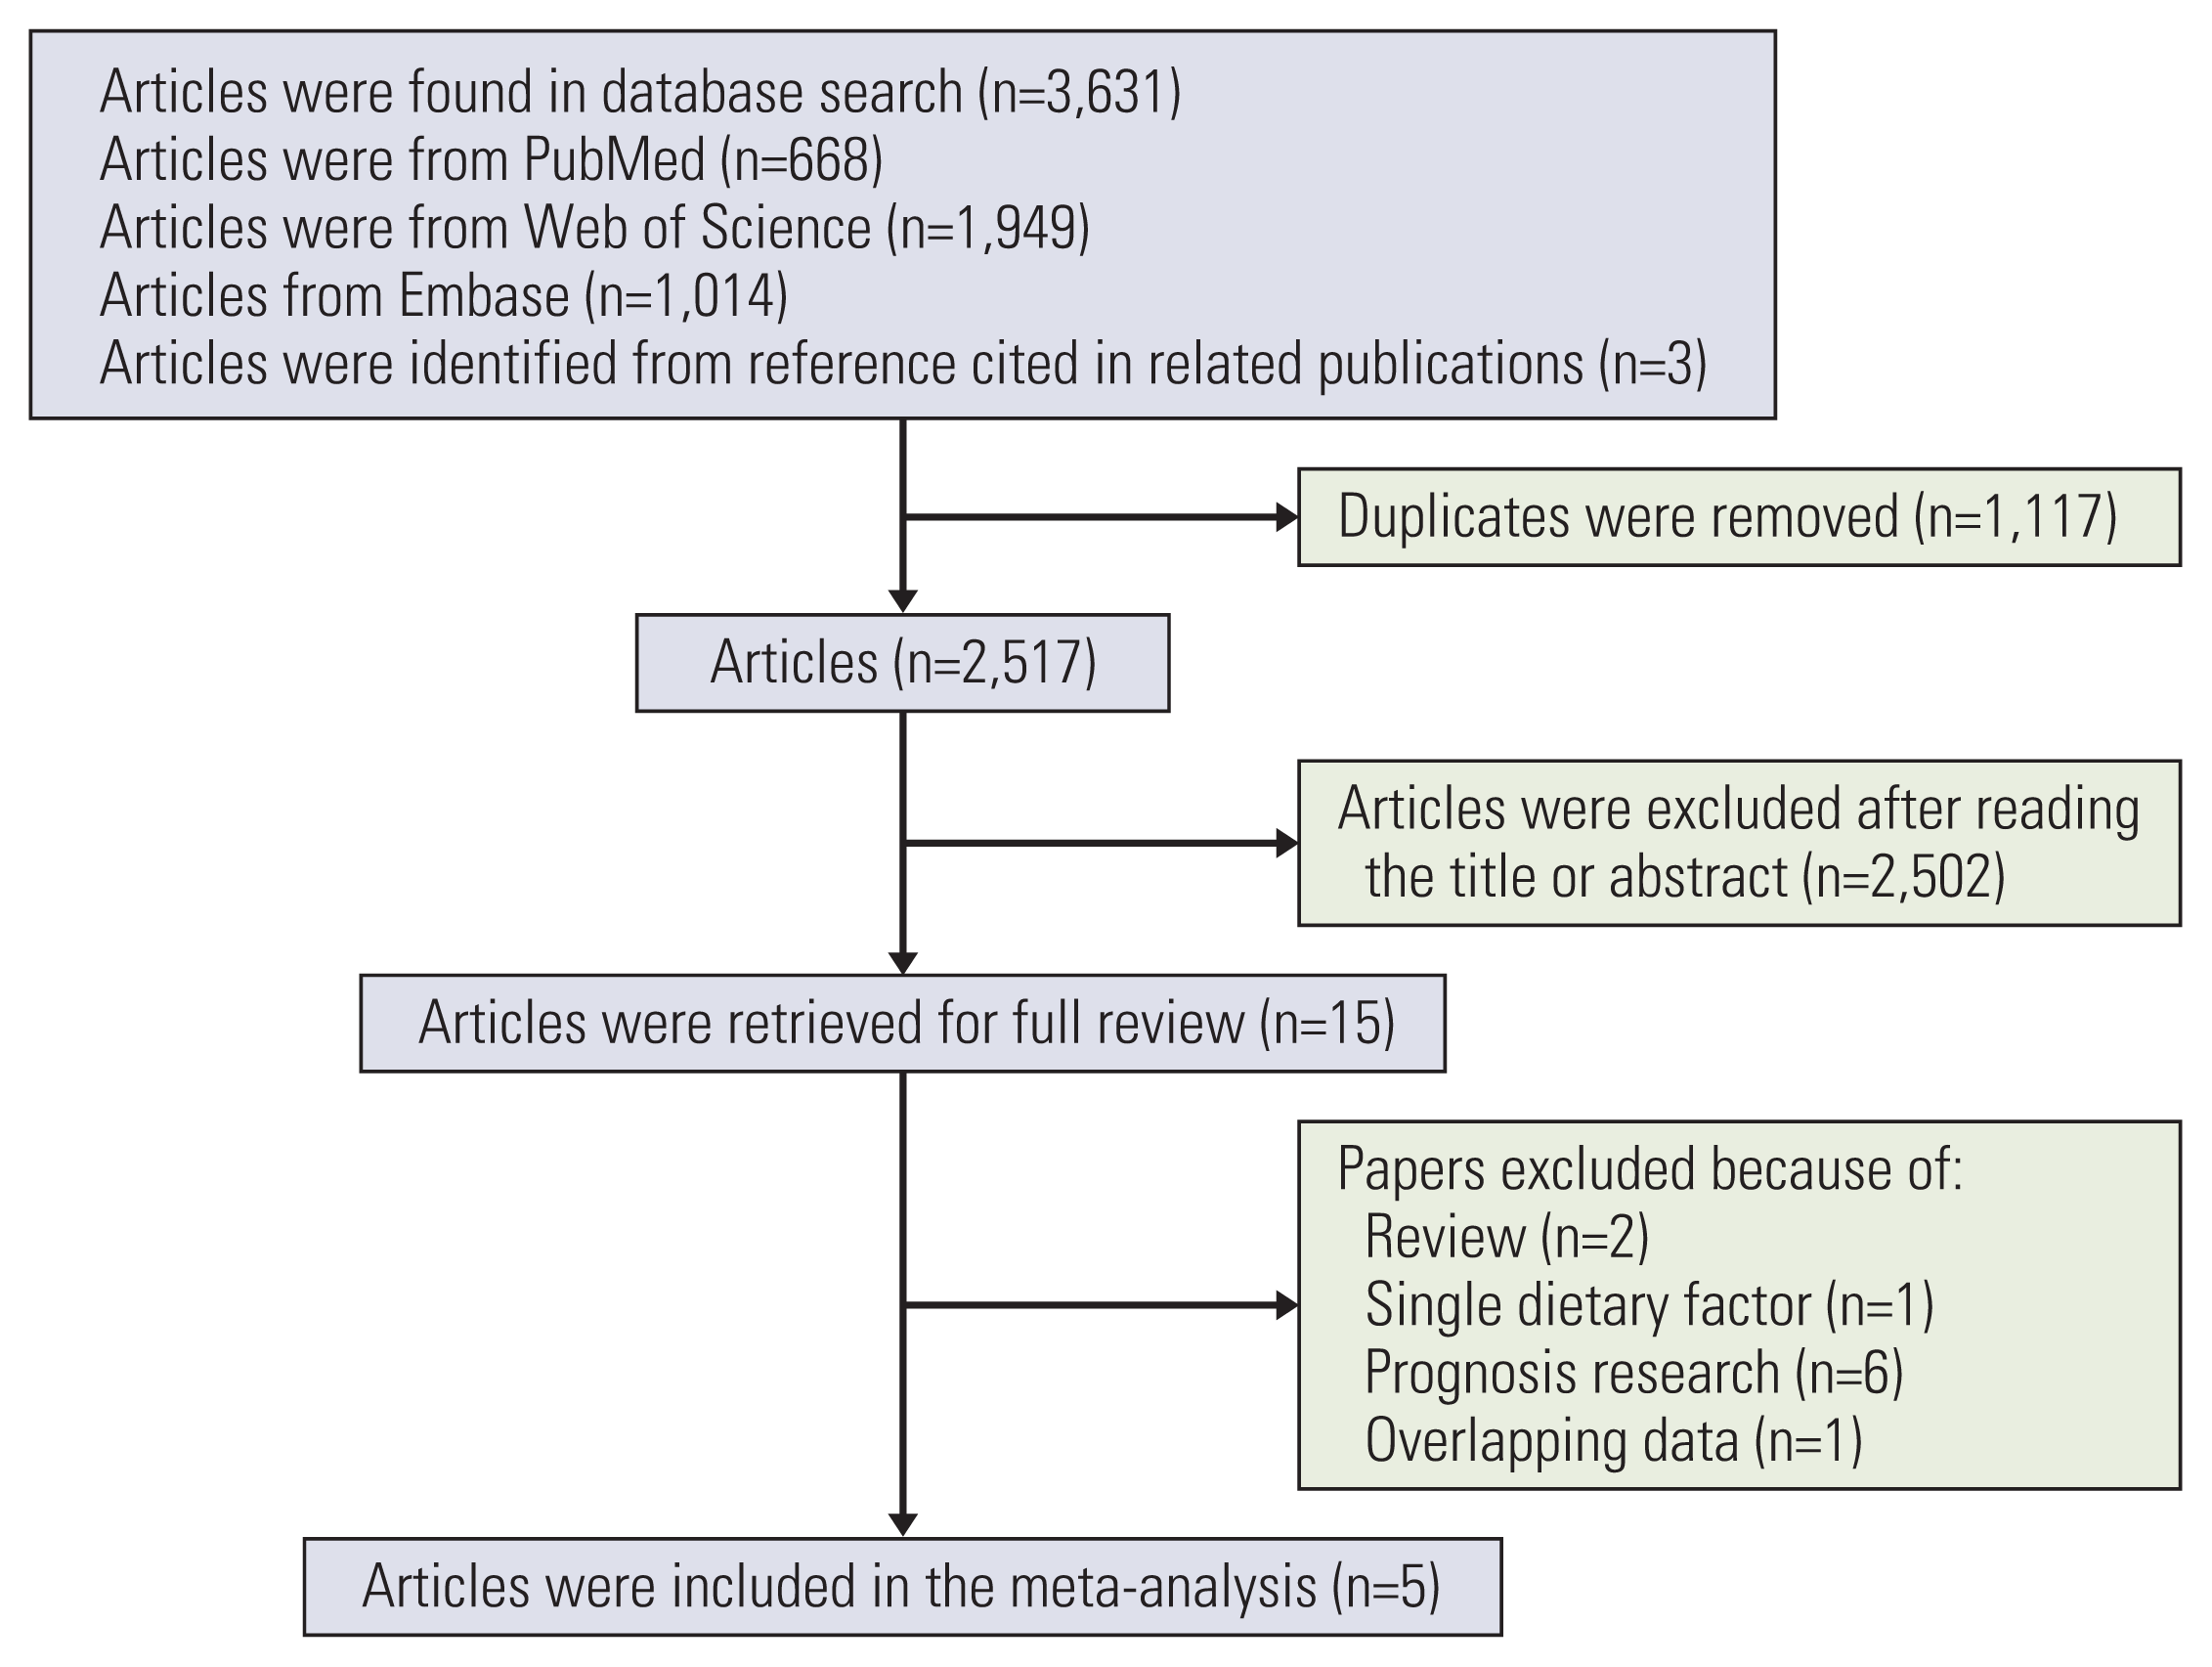
The flow diagram for the publication search is presented in Fig. 1. A total of 668 citations were identified from PubMed, 1,949 citations were from Web of Science, 1,014 citations were from EMBASE database, and three articles were identified from references cited in related publications. Of these, 2,517 articles were left after deleting duplicates. Irrelevant articles were excluded and the full text for 15 articles was retried to evaluate whether they met the inclusion criteria after reviewing the title and abstract. After examining the full text, two reviews were excluded, one article included only the dietary factors, six article participants were cancer survivors, and one article offered overlapping data. Although two studies were performed on the basis of the Women’s Health Initiative (WHI) [12,15], only the study with the largest sample size was included [12]. Finally, five articles that met the inclusion criteria were identified [1214,16,17].
The meta-analysis included four cohort studies [12,14, 16,17] and one case-cohort study [13], which involved 4,470 cases and 597,047 participants. Of the included studies, five reported that adherence to cancer prevention guidelines significantly decreased the risk of EC [1214,16,17]. The original articles were published between 2012 and 2019. Among these studies, two were conducted in the United States [12,16], two in Europe [14,17], and one in Canada [13]. The duration of follow-up ranged from 10.5 to 17.9 years. Individuals were aged between 25 and 79 years old. Two studies used the healthy lifestyle index [12,13]. One study used the ACS scores [16], one used the WCRF/AICR scores [17], and one used the Health index [14]. All included studies had reported adjusted HRs and 95% confidence intervals (CIs) for the association between adherence to cancer prevention guidelines score and the risk of EC. All five studies had considered those with the lowest cancer prevention guidelines score as a reference group. Characteristics for five studies that evaluated the association between adherence to cancer prevention guidelines score and the EC risk are provided in Table 1. Quality assessment results using the Newcastle-Ottawa Scale are demonstrated in Table 2. Four studies were of low bias risk [12,13,16,17] and one study was of high bias risk [14]. Furthermore, we documented confounder adjustment methods of these included studies (Table 3).

2. Highest vs. lowest scores of adherence to cancer prevention guidelines

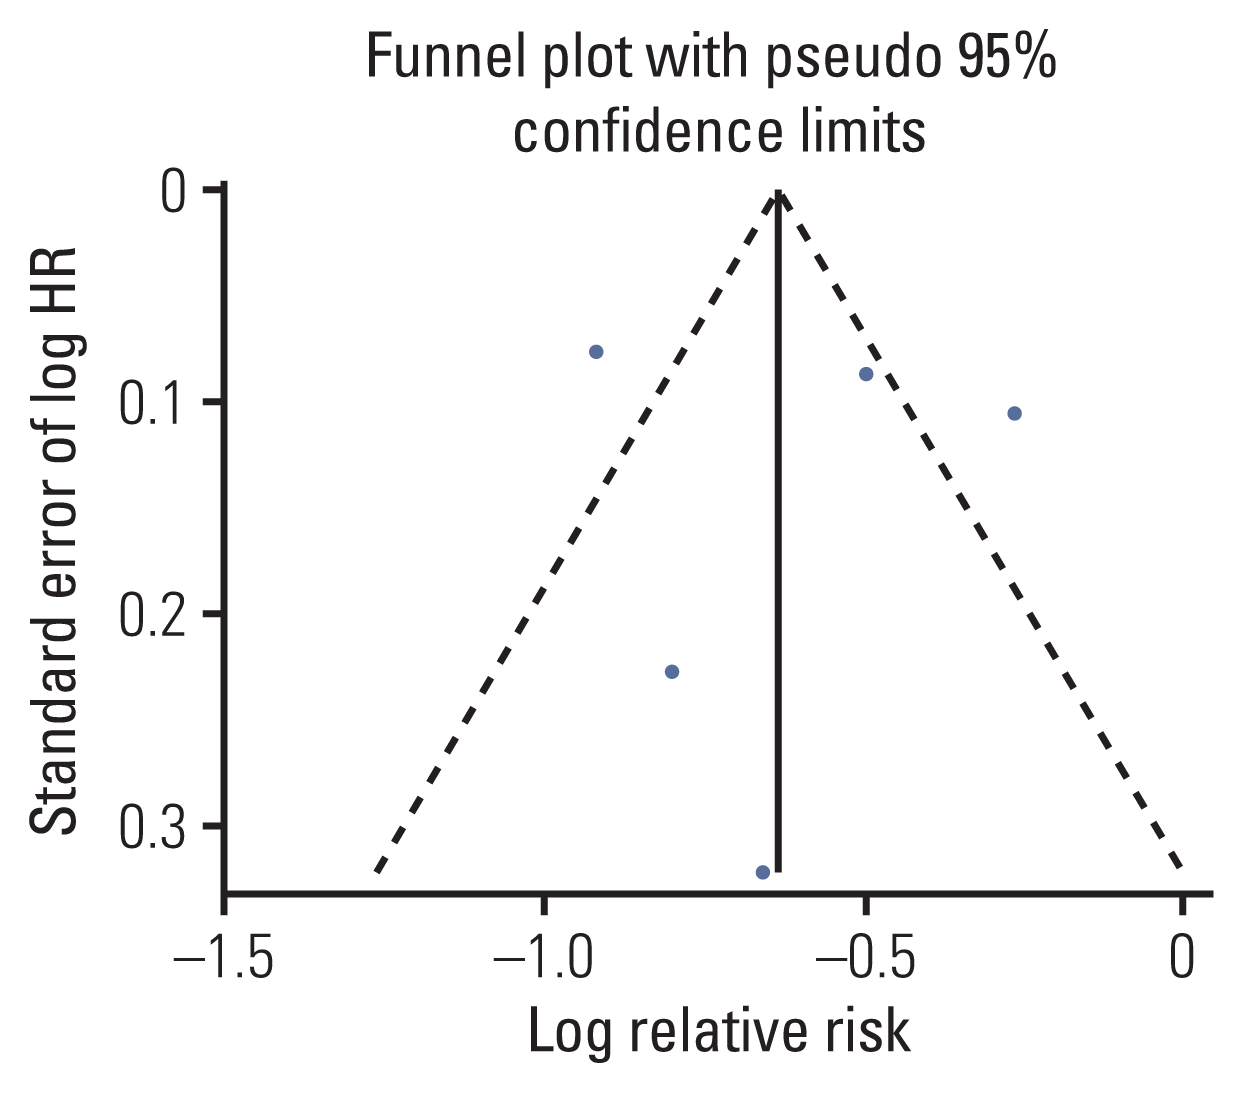
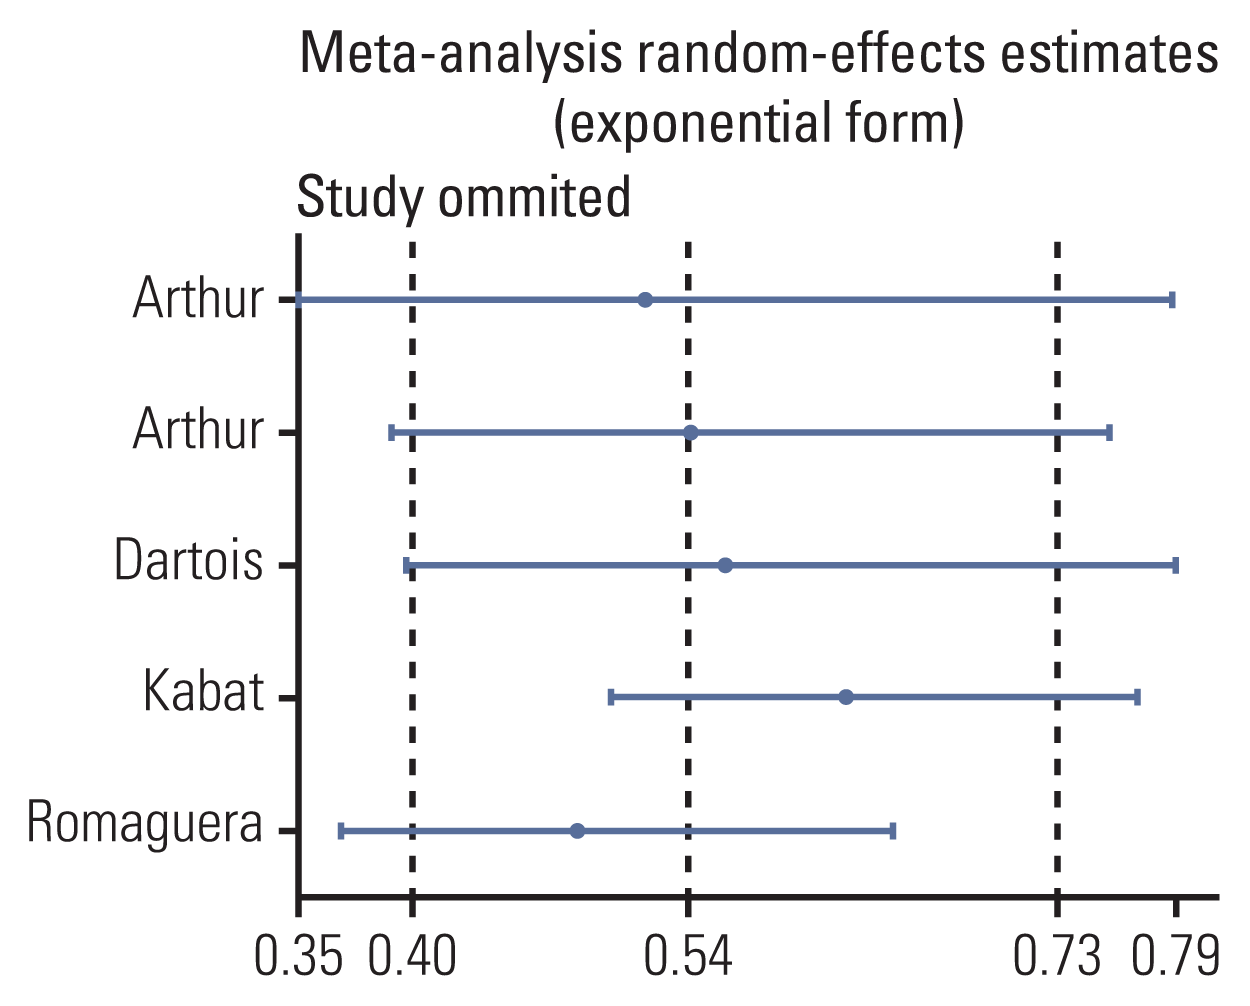
A total of five studies were included in the present analysis [1214,16,17]. Overall analysis of association between adherence to cancer prevention guidelines score and risk of EC is illustrated in Fig. 2. Main analysis revealed a significant relationship between adherence to cancer prevention guidelines score and EC risk (HR, 0.54; 95% CI, 0.40 to 0.73) with a high level of heterogeneity (I2=86.1%, p < 0.01). No publication bias evidence was uncovered based on visual inspection of funnel plots (Fig. 3) and according to Egger’s (p=0.844) and Begg’s (p=0.806) test results. Sensitivity analysis revealed that removing one study at a time did not substantially change the overall effect (Fig. 4). Of note, considering the special design outlined in the WHI, which included participants from both cohort and clinical trials, the Arthur et al.’s study [12] was included in the main analysis. The Thomson et al.’s study [15] that only investigated the topic within observational WHI study was included in the sensitivity analysis. As expected, sensitivity analysis results were robust (Fig. 5).

3. Dose-response analyses

Two studies failed to provide sufficient data for the dose-response analysis were excluded [14,16], while the remaining three studies were included in the study [12,13,17]. Score increment of 1 reduced the risk of EC by 6% (HR, 0.94; 95% CI, 0.93 to 0.96) without heterogeneity (I2=0%) (Fig. 6).

Discussion

To our knowledge, we first summarize the findings for the relationship between adherence to cancer prevention guidelines score and EC risk. Based on recent evidence, adherence to cancer prevention guidelines score is inversely associated with EC risk. This dose-response analysis determined that there is a 6% decrease in the relative EC risk per 1 score increase in adherence to cancer prevention guidelines score. The present study provided a more accurate evidence necessary to advocate for following cancer prevention recommendations.
Several factors need to be considered when interpreting meta-analysis results. Although subgroup analysis was not carried out, it is possible that menopausal status of the participants in the original study may have impact on the results. Obesity may account for up to 40% of the observed EC incidence. Compared to women of normal weight, obese women have a two- to five-fold increased risk of developing EC [22]. In general, obesity is associated with higher levels of circulating estrogen in postmenopausal women, likely accounting for their increased risk of EC. Beyond that, data from observational studies report that postmenopausal status in women is associated with an increased risk of EC [23]. More research is needed to explore the relationship between adherence to cancer prevention guidelines score and EC risk in postmenopausal women. Furthermore, five studies generated four types of adherence scores on the basis of guidelines from either the WCRF/AICR or ACS. Although WCRF/AICR and ACS guidelines are similar, interpretation of how to measure their recommendations varies. These studies differ in construction of the adherence score, some measurements of individual score components, and analytic methods. A previous study has observed that obesity is strongly associated with an increased risk of EC. On the contrary, alcohol intake and physical activity were not related to any of the outcomes [13]. Multiple risk factors may have a stronger effect on the risk of chronic diseases than individual factors. Therefore, these adherence scores may underestimate the potential impact of adhering to the recommendations. In addition, the studies included in this meta-analysis were from the United States, France, Canada, and other European countries. The living habits of people in different countries generally vary greatly. This may explain some of the heterogeneity observed among studies.
Among the included studies, two studies were performed on the basis of the WHI [12,15]. Surprisingly, results of these two studies were inconsistent when the ACS and healthy lifestyle index scores were used [12,15]. One study found that the guideline score was not associated with EC when the highest group was compared to the reference group [15]. The other study found that the higher the score, the lower the risk of EC [12]. The ACS score in Thomson et al.’s study [15] was derived from individual components of the 2006 and more-recent 2012 ACS guidelines on physical activity and nutrition for cancer prevention [24,25], including diet, physical activity, BMI, as well as alcohol drinking. The healthy lifestyle index score in Arthur et al.’s study [12] was developed based on public health guidelines for cancer prevention. This score is a combination of five common lifestyle behaviors, including BMI, alcohol intake, smoking, diet, as well as physical activity. In addition, the study investigating the relationship between ACS score and EC risk was conducted within the WHI observational study, with a mean follow-up period of 12.6 years [15]. Another study conducted within the WHI study had a median follow-up of 17.9 years [12]. Furthermore, the sample size and number of cases in Arthur et al.’s study [12] were greater than those in the Thomson et al.’s study [15]. At the same time, since dietary changes were required to make for all women in the intervention group of the dietary modification arm, Arthur et al. [12] excluded these women in the analysis. Therefore, the present meta-analysis included the Arthur et al.’s study [12] in order to more accurately study the relationship between adherence to cancer prevention guidelines score and EC risk. The study of Thomson et al. [15] was included in the sensitivity analysis, which was consistent with the main study findings.
The observed negative correlation between lifestyle-related risk factors and risk of EC might be explained through several potential biological mechanisms. In recent years, evidence has increased that insulin-like growth factor 1 as well as nutrition-associated hormones insulin may be vital in carcinogenesis [26,27]. High levels of these hormones may increase the risk of several cancers. Epidemiologic evidence indicates that the main etiologic drivers of EC risk might be attributed to increase a woman’s exposure to circulating estrogen [28]. Obesity is related to lower levels of sex hormone-binding globulin (SHBG), which brings about higher bioavailable levels of estrogen and insulin and elevating EC risk [29]. Physical activity likely somewhat mediates EC risk by enabling weight control and reducing adipose stores [30]. Furthermore, physical activity is related to higher SHBG levels resulting in less bioavailable estrogen [30]. Diets habit with low antioxidant-rich foods intake and correspondingly high alcohol intake may cause several metabolic changes including increasing estrogen concentrations, leading to enhanced aromatase activity, increasing concentrations of bioavailable insulin-like growth factor 1, and increasing production of inflammatory markers that may accelerate carcinogenesis through inducing oxidative stress, deoxyribonucleic acid damage, as well as mutagenesis by inhibiting apoptosis [30].
The present study has several advantages. Primarily, to our knowledge, this is the first systematic review and dose-response meta-analysis to explore the relationship between adherence to cancer prevention guidelines score and EC risk. Second, meta-analysis included prospective study design that avoids recall bias and provides less possibility for selection bias. Because of the large number of cases, we may have sufficient statistical power to detect the aforementioned topic. Third, sensitivity analysis has shown that pooled estimates did not vary substantially after elimination of any one study, demonstrating stability of the pooled estimates. Egger’s and Begg’s test results demonstrated no publication bias, which also verified the stability of these results.
The present study has several limitations. First, dose-response meta-analysis was based on a relatively limited number of included studies and heterogeneity among studies was high. However, there were not enough studies for subgroup analysis to evaluate the sources of heterogeneity. Furthermore, confounding by other risk factors cannot be entirely excluded. Even after adjusting for a large number of potential covariates, such as education, age, smoking pack-years, baseline aspirin use, baseline multivitamin use, race/ethnicity, total energy intake, and family history of cancer, the study was not able to explain the potential effects of dietary habits or behavior. In addition, frequency questionnaires were used by previous studies to capture physical activity and diet information. Measurement error could not be avoided by these self-reported measures This issue may greatly affect the accuracy of the research. Furthermore, researchers collected the components of the adherence score baseline. Subsequently, they use these measures to assess EC risk over time. Although follow-up periods ranged from 10.5 to 17.9 years, this might not be sufficient to investigate the role of adherence to cancer prevention guidelines. Finally, EC types in patients were not stratified because few studies have focused on the relationship between adherence to cancer prevention guidelines scores and EC types.
In summary, our results indicated that adherence to cancer prevention guidelines is related to a decreased risk of EC. Further studies are warranted to substantiate these findings, which may be significant for public health due to potential prevention of EC through lifestyle interventions.

Notes

Author Contributions

Conceived and designed the analysis: Zhao YH, Wu QJ.

Collected the data: Jiang YT, Gong TT.

Contributed data or analysis tools: Sun H, Ma XX.

Performed the analysis: Sun H, Liu YS.

Wrote the paper: Sun H, Chang Q.

Conflicts of Interest

Conflicts of interest relevant to this article was not reported.

ACKNOWLEDGMENTS

This study was supported by grants from the National Key R&D Program of China (No. 2017YFC0907405 to Yu-Hong Zhao), the LiaoNing Revitalization Talents Program (No. XLYC1907102 to Qi-Jun Wu), and 345 Talent Program to Qi-Jun Wu.

References

1. Ferlay J, Parkin DM, Steliarova-Foucher E. Estimates of cancer incidence and mortality in Europe in 2008. Eur J Cancer. 2010; 46:765–81.
crossref
2. Jemal A, Bray F, Center MM, Ferlay J, Ward E, Forman D. Global cancer statistics. CA Cancer J Clin. 2011; 61:69–90.
crossref
3. Bray F, Ferlay J, Soerjomataram I, Siegel RL, Torre LA, Jemal A. Global cancer statistics 2018: GLOBOCAN estimates of incidence and mortality worldwide for 36 cancers in 185 countries. CA Cancer J Clin. 2018; 68:394–424.
crossref
4. Sorosky JI. Endometrial cancer. Obstet Gynecol. 2012; 120:383–97.
crossref
5. Constantine GD, Kessler G, Graham S, Goldstein SR. Increased incidence of endometrial cancer following the Women’s Health Initiative: an assessment of risk factors. J Womens Health (Larchmt). 2019; 28:237–43.
crossref
6. Avgerinos KI, Spyrou N, Mantzoros CS, Dalamaga M. Obesity and cancer risk: emerging biological mechanisms and perspectives. Metabolism. 2019; 92:121–35.
crossref
7. Linkov F, Goughnour SL, Adambekov S, Edwards RP, Donnellan N, Bovbjerg DH. Lifestyle interventions to reduce the risk of obesity-associated gynecologic malignancies: a focus on endometrial cancer. Berger M, Klopp A, Lu K, editors. Focus on gynecologic malignancies. Energy balance and cancer. 13. Cham: Springer;2018. p. 137–65.
crossref
8. Gierach GL, Chang SC, Brinton LA, Lacey JV Jr, Hollenbeck AR, Schatzkin A, et al. Physical activity, sedentary behavior, and endometrial cancer risk in the NIH-AARP Diet and Health Study. Int J Cancer. 2009; 124:2139–47.
crossref
9. Kawachi A, Shimazu T, Budhathoki S, Sawada N, Yamaji T, Iwasaki M, et al. Association of BMI and height with the risk of endometrial cancer, overall and by histological subtype: a population-based prospective cohort study in Japan. Eur J Cancer Prev. 2019; 28:196–202.
crossref
10. Dunneram Y, Greenwood DC, Cade JE. Diet, menopause and the risk of ovarian, endometrial and breast cancer. Proc Nutr Soc. 2019; 78:438–48.
crossref
11. Pronk NP, Anderson LH, Crain AL, Martinson BC, O’Connor PJ, Sherwood NE, et al. Meeting recommendations for multiple healthy lifestyle factors: prevalence, clustering, and predictors among adolescent, adult, and senior health plan members. Am J Prev Med. 2004; 27:25–33.
12. Arthur R, Brasky TM, Crane TE, Felix AS, Kaunitz AM, Shadyab AH, et al. Associations of a healthy lifestyle index with the risks of endometrial and ovarian cancer among women in the Women’s Health Initiative Study. Am J Epidemiol. 2019; 188:261–73.
crossref
13. Arthur R, Kirsh VA, Kreiger N, Rohan T. A healthy lifestyle index and its association with risk of breast, endometrial, and ovarian cancer among Canadian women. Cancer Causes Control. 2018; 29:485–93.
crossref
14. Dartois L, Fagherazzi G, Boutron-Ruault MC, Mesrine S, Clavel-Chapelon F. Association between five lifestyle habits and cancer risk: results from the E3N cohort. Cancer Prev Res (Phila). 2014; 7:516–25.
crossref
15. Thomson CA, McCullough ML, Wertheim BC, Chlebowski RT, Martinez ME, Stefanick ML, et al. Nutrition and physical activity cancer prevention guidelines, cancer risk, and mortality in the women’s health initiative. Cancer Prev Res (Phila). 2014; 7:42–53.
crossref
16. Kabat GC, Matthews CE, Kamensky V, Hollenbeck AR, Rohan TE. Adherence to cancer prevention guidelines and cancer incidence, cancer mortality, and total mortality: a prospective cohort study. Am J Clin Nutr. 2015; 101:558–69.
crossref
17. Romaguera D, Vergnaud AC, Peeters PH, van Gils CH, Chan DS, Ferrari P, et al. Is concordance with World Cancer Research Fund/American Institute for Cancer Research guidelines for cancer prevention related to subsequent risk of cancer? Results from the EPIC study. Am J Clin Nutr. 2012; 96:150–63.
crossref
18. Wells GA, Shea B, O’Connell D, Peterson J, Welch V, Losos M, et al. The Newcastle-Ottawa Scale (NOS) for assessing the quality of nonrandomised studies in meta-analyses. Ottawa: University of Ottawa;2013.
19. Gong TT, Wu QJ, Lin B, Ruan SK, Kushima M, Takimoto M. Observational studies on the association between post-diagnostic metformin use and survival in ovarian cancer: a systematic review and meta-analysis. Front Oncol. 2019; 9:458.
crossref
20. DerSimonian R, Laird N. Meta-analysis in clinical trials. Control Clin Trials. 1986; 7:177–88.
crossref
21. Greenland S, Longnecker MP. Methods for trend estimation from summarized dose-response data, with applications to meta-analysis. Am J Epidemiol. 1992; 135:1301–9.
crossref
22. Chang SC, Lacey JV Jr, Brinton LA, Hartge P, Adams K, Mouw T, et al. Lifetime weight history and endometrial cancer risk by type of menopausal hormone use in the NIH-AARP diet and health study. Cancer Epidemiol Biomarkers Prev. 2007; 16:723–30.
crossref
23. Lee SC, Kaunitz AM, Sanchez-Ramos L, Rhatigan RM. The oncogenic potential of endometrial polyps: a systematic review and meta-analysis. Obstet Gynecol. 2010; 116:1197–205.
crossref
24. Kushi LH, Doyle C, McCullough M, Rock CL, Demark-Wahnefried W, Bandera EV, et al. American Cancer Society guidelines on nutrition and physical activity for cancer prevention: reducing the risk of cancer with healthy food choices and physical activity. CA Cancer J Clin. 2012; 62:30–67.
crossref
25. Kushi LH, Byers T, Doyle C, Bandera EV, McCullough M, McTiernan A, et al. American Cancer Society Guidelines on Nutrition and Physical Activity for cancer prevention: reducing the risk of cancer with healthy food choices and physical activity. CA Cancer J Clin. 2006; 56:254–81.
crossref
26. Giovannucci E. Insulin, insulin-like growth factors and colon cancer: a review of the evidence. J Nutr. 2001; 131:3109S–20S.
crossref
27. Lee C, Kim SJ, Na JY, Park CS, Lee SY, Kim IH, et al. Alterations in promoter usage and expression levels of insulin-like growth factor-II and H19 genes in cervical and endometrial cancer. Cancer Res Treat. 2003; 35:314–22.
crossref
28. Renehan AG, Tyson M, Egger M, Heller RF, Zwahlen M. Body-mass index and incidence of cancer: a systematic review and meta-analysis of prospective observational studies. Lancet. 2008; 371:569–78.
crossref
29. Gunter MJ, Hoover DR, Yu H, Wassertheil-Smoller S, Manson JE, Li J, et al. A prospective evaluation of insulin and insulin-like growth factor-I as risk factors for endometrial cancer. Cancer Epidemiol Biomarkers Prev. 2008; 17:921–9.
crossref
30. Giovannucci E. Nutrition, insulin, insulin-like growth factors and cancer. Horm Metab Res. 2003; 35:694–704.
crossref

Fig. 1
Flowchart for the selection of the original studies on the association between adherence to cancer prevention guidelines score and the endometrial cancer risk included in the meta-analysis.
crt-2020-546f1.tif
Fig. 2
Forest plot for the association between adherence to cancer prevention guidelines score and the endometrial cancer risk using a random-effects model [1214,16,17]. The squares indicate study-specific hazard ratio (size of the square reflects the study-specific statistical weight); the horizontal lines indicate 95% confidence intervals (CIs); and the diamond indicates the summary hazard ratio (HR) estimate with its 95% CI.
crt-2020-546f2.tif
Fig. 3
Funnel plot with pseudo 95% confidence limits for the analysis of adherence to cancer prevention guidelines score and the endometrial cancer risk. HR, hazard ratio.
crt-2020-546f3.tif
Fig. 4
Sensitivity analysis was performed by removing each study in turn and recalculating the summary hazard ratios estimate [1214,16,17].
crt-2020-546f4.tif
Fig. 5
Forest plot for the association between adherence to cancer prevention guidelines score and the endometrial cancer risk using a random-effects model in sensitivity analysis [1317]. The squares indicate study-specific hazard ratio (size of the square reflects the study-specific statistical weight); the horizontal lines indicate 95% confidence intervals (CIs); and the diamond indicates the summary hazard ratio (HR) estimate with its 95% CI.
crt-2020-546f5.tif
Fig. 6
Forest plot for the dose-response meta-analysis of the relationship between adherence to cancer prevention guidelines scores and the endometrial cancer risk using a random-effects model [12,13,17]. The squares indicate study-specific hazard ratio (HR) (size of the square reflects the study-specific statistical weight); the horizontal lines indicate 95% confidence intervals (CIs); and the diamond indicates the summary HR estimate with its 95% CI.
crt-2020-546f6.tif
Table 1
Characteristics of studies included in the meta-analysis
Study Age range (yr) Menopausal status Sample size No. of cases Duration of follow-up (yr) Exposure Assessment of endometrial cancer Score HR (95% CI)
Romaguera et al. (2012) [17], Europe 25–70 Total 260,098 1,148 11.0 WCRF/AICR score Medical record ≥ 0 to ≤ 3 1.00 (reference)
> 3 to < 4 0.88 (0.75–1.04)
≥ 4 to < 5 0.79 (0.68–0.93)
≥ 5 to ≤ 7 0.77 (0.62–0.94)

Dartois et al. (2014) [14], French 43–68 Total 64,732 270 15.0 Health indexa) Self-reported and medical record ≥ 0 to ≤ 2 1.00 (reference)
≥ 2.5 to ≤ 3 0.61 (0.39–0.97)
≥ 3.5 to ≤ 4 0.48 (0.31–0.73)
≥ 4.5 to ≤ 5 0.45 (0.29–0.71)

Kabat et al. (2015) [16], USA 50–71 Total 189,575 1,518 10.5 ACS score Medical record ≥ 0 to ≤ 3 1.00 (reference)
≥ 4 to ≤ 5 0.71 (0.61–0.83)
6 0.62 (0.52–0.73)
7 0.48 (0.40–0.57)
≥ 8 to ≤ 11 0.40 (0.34–0.46)

Arthur et al. (2018) [13], Canada 47–70 Total 2,519 177 11.0 Healthy lifestyle index scoreb) Medical record ≥ 0 to ≤ 10 1.00 (reference)
≥ 11 to ≤ 12 0.85 (0.51–1.41)
≥ 13 to ≤ 14 0.52 (0.41–0.98)
≥ 15 to ≤ 20 0.52 (0.28–0.99)

Arthur et al. (2019) [12], USA 50–79 Post 80,123 1,357 17.9 Healthy lifestyle index score Medical record ≥ 0 to ≤ 10 1.00 (reference)
≥ 11 to ≤ 12 0.70 (0.60–0.82)
13 0.79 (0.66–0.95)
≥ 14 to ≤ 15 0.65 (0.55–0.76)
≥ 16 to ≤ 20 0.61 (0.51–0.72)

ACS, the American Cancer Society, including diet, physical activity, body mass index, and alcohol consumption; CI, confidence interval; HR, hazard ratio; WCRF/AICR, the World Cancer Research Fund and the American Institute of Cancer Research, including body fatness, physical activity, consumption of foods and drinks that promote weight gain, consumption of plant foods, consumption of animal foods, consumption of alcoholic drinks, and breastfeeding in women.

a) Including smoking, body mass index, alcohol consumption, fruit and vegetable consumption, and physical activity,

b) Including diet, smoking, alcohol consumption, physical activity, and body mass index.

Table 2
Quality assessment scores according to the Newcastle-Ottawa Scale
Study Selection Comparability Outcome


Representativeness of the exposed cohort Selection of unexposed cohort Ascertainment of exposure Outcome of interest not present at start of study Control for important factor or additional factora) Assessment of outcome Follow-up long enough for outcomes to occurb) Adequacy of follow-up of cohortsc)
Romaguera et al. [17] - * * * ** * * *

Dartois et al. [14] - * - * ** - * *

Kabat et al. [16] - * * * ** * * *

Arthur et al. [13] - * * * ** * * *

Arthur et al. [12] - * * * ** * * *

A study could be awarded a maximum of one star for each item except for the item control for important factor or additional factor. The definition/explanation of each column of the Newcastle-Ottawa Scale is available from (http://www.ohri.ca/programs/clinical_epidemiology/oxford.asp).

a) A maximum of 2 stars could be awarded for this item. Studies that controlled for use of menopausal hormone therapy, age at first menarche received one star, whereas studies that controlled for other important confounders such as level of education received an additional star,

b) A cohort study with a median follow-up time ≥ 10 years was assigned one star,

c) A cohort study with a follow-up rate > 75% was assigned one star.

* One asterisk represents a condition that meets the evaluation criteria,

** The two asterisks represent two conditions that meet the evaluation criteria.

Table 3
Confounders and adjustment methods of studies included in the meta-analysis
Study Confounders Adjustment methods
Romaguera et al. (2012) [17] Energy intake, level of education, smoking status, intensity of smoking, presence of chronic diseases at baseline, ever use of contraceptive pills, ever use of hormone replacement therapy, age at first menarche, age at first pregnancy, menopausal status Cox regression model
Dartois et al. (2014) [14] Level of education, residence, first-degree family history of any cancer, professional activity, use of oral contraceptives, age at menarche and number of children, age at first full-term pregnancy, menopausal status, use of menopausal hormone therapy Cox proportional hazards regression models
Kabat et al. (2015) [16] Age, educational level, ethnicity, smoking status, marital status, energy intake, menopausal status, age at menarche, age at first birth, parity, hormone therapy use Cox proportional hazards models
Arthur et al. (2018) [13] Education, non-alcohol energy intake, smoking status, alcohol intake, BMI, history of oophorectomy, diet score, physical activity, age at menarche, parity, menopause, HRT use, oral contraceptive use, family history of breast cancer Cox regression models
Arthur et al. (2019) [12] Age at entry, education, non-alcohol energy intake, ethnicity, age at menarche, parity, combined estrogen and progesterone therapy, unopposed estrogen therapy, oral contraceptive use, family history of endometrial cancer, age at menopause Cox proportional hazards models

BMI, body mass index; HRT, hormone replacement therapy.

TOOLS
Similar articles