Journal List > Cancer Res Treat > v.53(1) > 1154676

Park, Bang, Nam, Jin, Seo, Kim, Oh, Kim, and Oh: Prognostic Value of Serum Soluble Programmed Death-Ligand 1 and Dynamics During Chemotherapy in Advanced Gastric Cancer Patients

Abstract

Purpose

The soluble form programmed death-ligand 1 (sPDL1) has immunosuppressive properties and is being studied as a candidate biomarker for immuno-oncology drug development. We measured the serum sPDL1 at pre-and post-chemotherapy and evaluated its prognostic implication and dynamics during chemotherapy in advanced gastric cancer (GC).

Materials and Methods

We prospectively enrolled 68 GC patients who were candidates for palliative standard first-line chemotherapy, and serially collected blood at baseline and after one cycle of chemotherapy, at the best response and after disease progression. sPDL1 was measured using an enzyme-linked immunosorbent assay. Response to chemotherapy, overall survival (OS), progression-free survival (PFS) and other prognostic factors including neutrophil-lymphocyte ratio (NLR) were obtained. The cut-off value of sPDL1 levels for survival analysis was found using C-statistics.

Results

The median baseline sPDL1 was 0.8 ng/mL (range, 0.06 to 6.06 ng/mL). The median OS and PFS were 14.9 months and 8.0 months, respectively. sPDL1 and NLR showed a weak positive correlation (Spearman’s rho=0.301, p=0.013). Patients with low levels of sPDL1 at diagnosis (< 1.92 ng/mL) showed a better OS and PFS than patients with a high sPDL1. The baseline sPDL1 before treatment was higher in the progressive disease group than in the stable disease and partial response groups. Patients whose sPDL1 increased after the first cycle of chemotherapy showed worse PFS and OS. Following disease progression, sPDL1 increased compared with the baseline.

Conclusion

sPDL1 at prechemotherapy confers a prognostic value for PFS and OS in GC patients under palliative first-line chemotherapy. Dynamics of sPDL1 during chemotherapy correlates with disease progression.

Introduction

Gastric cancer (GC) is the fifth most common cancer in the world and is the third most common cause of cancer-related death [1]. There is a high incidence in East Asia including Korea, Japan, and China [2].
Early GC can be cured with endoscopic mucosal resection or curative surgery. In patients with advanced GC, chemotherapy improves symptoms and increases overall survival (OS) [3,4]. In addition, trastuzumab and ramucirumab have been approved as targeted therapies for suitable patients [5,6].
Following the development of anticancer immunotherapeutic agents, the anti-programmed death-1 (PD-1) antibody, pembrolizumab received U.S. Food and Drug Administration approval for treatment of GC patients with programmed death-ligand 1 (PD-L1) expression with disease progression on after two or more prior lines of therapy [7]. Nivolumab showed a survival benefit in a heavily pretreated patient population compared with placebo without consideration of PD-L1 expression [8].
Recently, the most important issue is to select which biomarker is suitable for specific patients who benefited from immunotherapy in GC. Microsatellite instability (MSI) is a proven biomarker, it is also applied to GC [9]. Although tumor mutational burden is presented as a biomarker for immunotherapy in various cancers, little is known about its role in GC [10]. Most biomarkers use tumor tissue, which is usually difficult to obtain. This poses a limitation in clinical practice where repeated tumor biopsies are performed as treatment progresses.
Currently, the soluble form of PD-L1 (sPDL1) can be measured from the blood of cancer patients. The relationship between sPDL1 levels and prognosis of patients has been studied in several cancers. These studies suggest that the higher the serum level of sPDL1, the worse the prognosis of the tumor [1114]. Controversial studies have been published on the level of sPDL1 in the blood of advanced GC patients and their prognosis [15,16]. Furthermore, it is not yet known how the serum level of sPDL1 changes in patients with GC according to disease progression and how they relate to treatment response. Because it is a liquid biopsy-based test, it can overcome the limitation of obtaining tumor tissue samples, and it is relatively easy to obtain samples repeatedly in the course of therapy.
This study was carried out to investigate the role of sPDL1 in GC.

Materials and Methods

1. Patients and data collection

We prospectively enrolled pathologically diagnosed metastatic or recurrent GC patients who provided informed consent for the biomarker analysis study at Seoul National University Hospital. A total of 68 patients were enrolled. Their blood samples were collected before initiation of palliative first-line chemotherapy, after the first cycle of chemotherapy, at the best response, and after disease progression. First-line chemotherapy was fluorouracil and platinum doublet. Trastuzumab was given to human epidermal growth factor receptor 2 (HER2)–positive patients. The chemotherapy response was evaluated every two cycles. Patients’ blood samples were taken every outpatient visit for chemotherapy. The sample of the first registered patient was 2013-11-27. The data censored at May 2018. The number of patients included in the analysis at baseline and after first cycle was 68, 67 at the best response, and 42 after disease progression, respectively.
Data of baseline characteristics, laboratory data including whole blood cell count with neutrophils, lymphocytes, monocytes and platelets, carcinoembryonic antigen (CEA), cancer antigen 19-9 (CA 19-9) were collected. The neutrophil-to-lymphocyte ratio (NLR), monocyte-to-lymphocyte ratio (MLR), and platelet-to-lymphocyte ratio (PLR) were calculated by dividing the neutrophils, monocytes or platelet counts by the lymphocyte counts.
The serum level of sPDL1 was measured using an enzyme-linked immunosorbent assay (PDCD1LG1 ELISA kit, USCN Life Science, Wuhan, China) in each sample according to the manufacturer’s instructions [13]. Each sample was analyzed in duplicate.

2. Statistical analysis

A t test was used for comparison of means. ANOVA was used for comparison of the mean between the three groups and Turkey’s multiple comparison method was used for post-hoc analysis. OS was defined as the time from day 1 of chemotherapy to the date of death or last follow-up. Median OS was calculated using the Kaplan-Meier method and comparisons of difference between groups were assessed using log-rank tests. Median follow-up duration was calculated using the reverse Kaplan-Meier method. Of the 68 patients, 15 had survived at the time of data-cut off and were therefore censored in the survival analysis. All statistical tests were two-sided, with significance defined as p < 0.05.
Cut-off values of each variable (sPDL1, NLR, MLR, and PLR) for OS were found by using the C-statistics [17]. To find the cut-off, we divided the variables into 100 sections and calculate the C-value and the p-value based on the Cox proportional hazard model, and then selected the most significant value.
We performed this analysis using R ver. 3.6.0 (R Foundation for Statistical Computing, Vienna, Austria) and SPSS software ver. 23 (IBM Corp., Armonk, NY).

Results

1. Patient characteristics

A total of 68 patients were prospectively enrolled (Table 1). The median age at diagnosis was 56 years old (range, 28 to 80 years). The median follow-up duration was 44.3 months (95% confidence interval [CI], 41.0 to not applicable), and OS was 14.9 months (95% CI, 7.3 to 22.5 months).
All patients received fluorouracil and platinum doublet (XELOX or FOLFOX) as first-line palliative chemotherapy. Among them, 13 HER2-positive patients received trastuzumab on top of chemotherapy. Three patients had MSI-high tumors, three patients had MSI-low tumors, 27 patients had microsatellite stable tumors, and the rest were unknown. Ten patients recurred after curative surgery and the rest were metastatic GC patients, 19 of whom underwent palliative surgery. PD-L1 expression was evaluated in 16 patients (23.5%) using immunohistochemistry. Two patients had PD-L1–postive GC. One was in lower level of sPDL1 group and the other was in high level of sPDL1 group. All patients received immune checkpoint inhibitor on the 1st line and 2nd line were excluded. Only two patients received nivolumab in the 3rd and the 4th line, respectively. Both of them belonged to the low baseline sPDL1 group and survived for more than 3 years. Thirty-four patients (50%) had target lesion at baseline.
The best response of first-line chemotherapy was partial response (PR) in 34 patients (50%), stable disease (SD) in 29 patients (42.6%), and progressive disease (PD) in five patients (7.4%).

2. Association between sPDL1 and other variables

The baseline sPDL1 median value was 0.80 ng/mL (range, 0.06 to 6.06 ng/mL) and mean value was 1.31 ng/mL (range, 0.98 to 1.63 ng/mL). Median NLR was 2.38 (range, 0.45 to 15.00) in baseline samples of all patients (Table 2).
The correlation between baseline sPDL1 and other variables in the non-parametric test showed a significant correlation between sPDL1 and NLR, white blood cell count, platelet count, MLR, and PLR (S1 Fig.).

3. Prognostic value of sPDL1

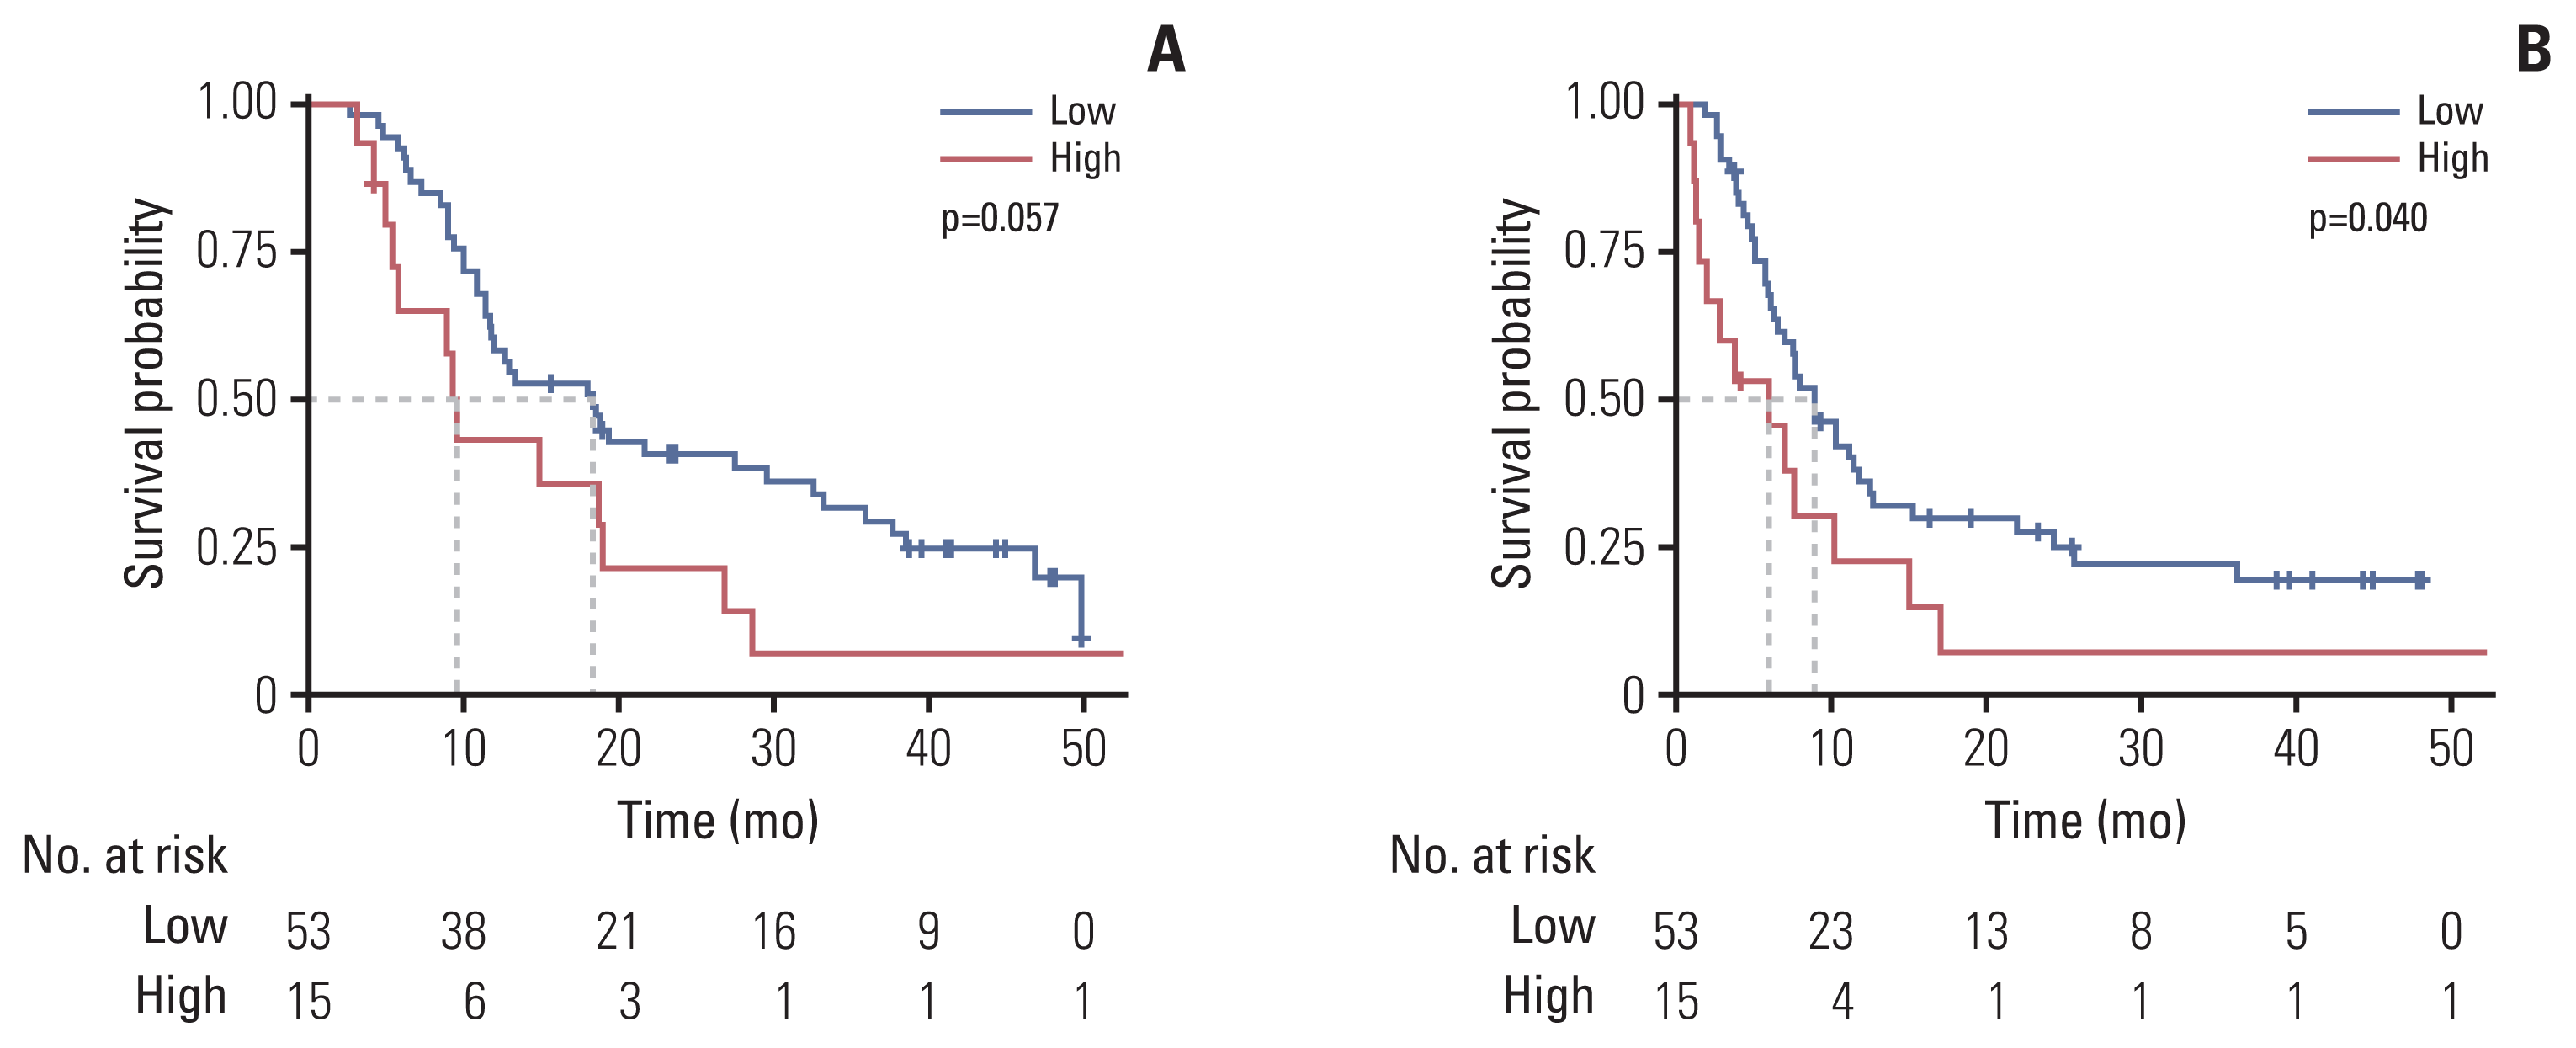
Using C-statistics, the cut-off value of sPDL1 with the most significant C-value and p-value was found to be 1.92 ng/mL (S2 Fig.). Patients were divided into two groups according to baseline sPDL1, and OS was compared (Fig. 1A). Patients with lower levels of sPDL1 at baseline showed a better OS and progression-free survival (PFS) than the patients with higher levels of sPDL1 (OS: 18.3 months vs. 9.5 months, p=0.057; PFS: 8.9 vs. 6.0 months, p=0.040) (Fig. 1).
In the univariate analysis for OS, high baseline sPDL1 being associated with shorter OS (hazard ratio [HR], 1.837; 95% CI, 0.975 to 3.458; p=0.061) (Table 3). However, in multivariate analysis, no significant effect of baseline sPDL1 on OS was found (HR, 1.408; 95% CI, 0.685 to 2.895; p=0.352). The history of resection surgery, no peritoneal seeding, and lower baseline NLR, MLR, PLR were favor prognostic factors in the univariate analysis. But, In the multivariate analysis, lower baseline NLR was the only favor prognostic factors. Other tumor markers (CEA, CA 19-9) showed no prognostic role in this study.

4. Dynamics of sPDL1

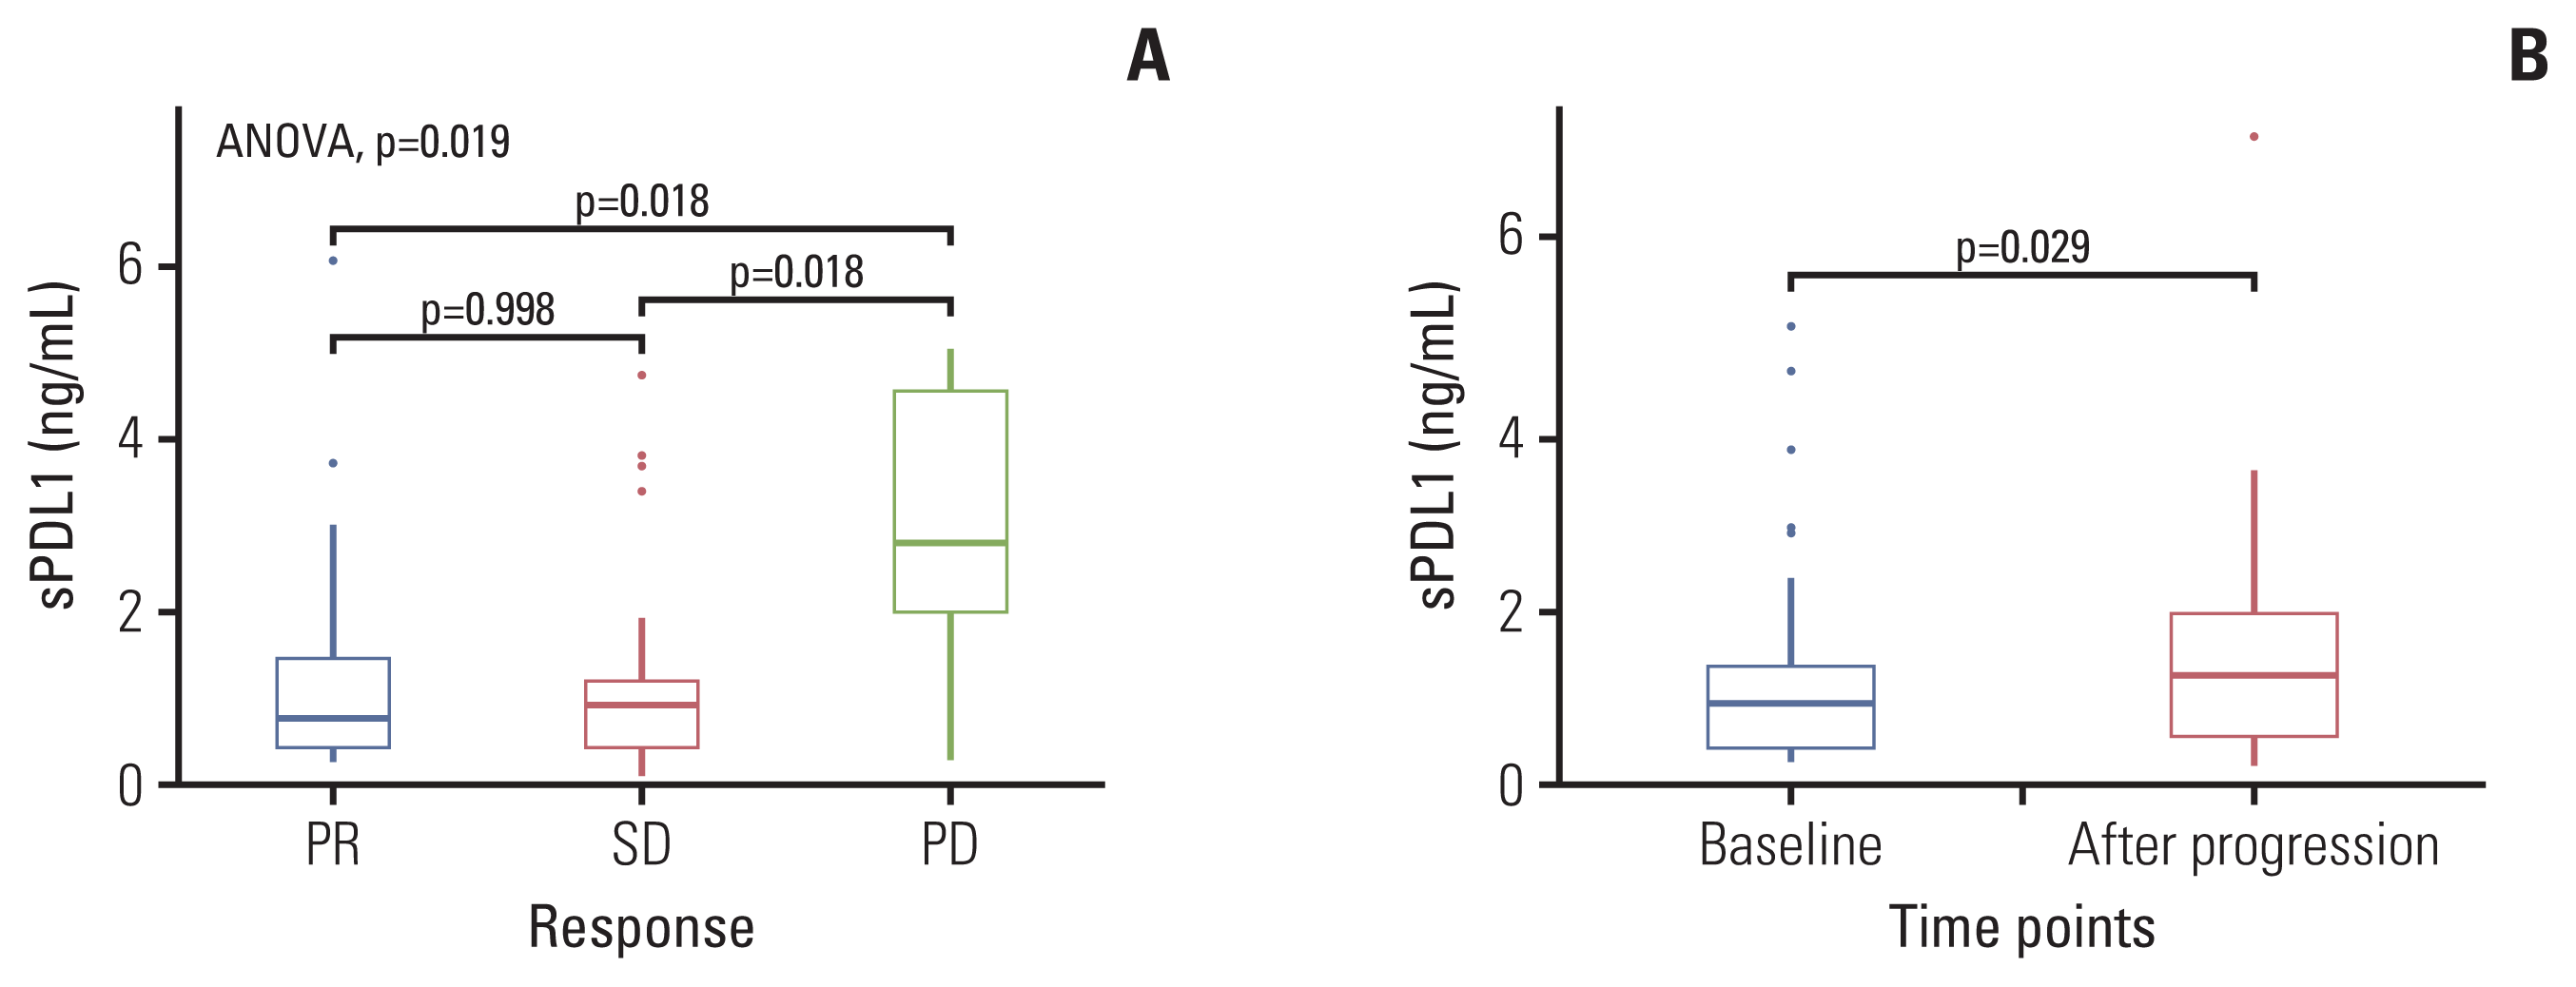
Table 4 summarizes the sPDL1 values at baseline, after the first cycle, at the best response, and after disease progression by dividing patients according to the best response to chemotherapy. Baseline sPDL1 was the highest in the PD group than in the SD and PR groups (mean, 2.91, 1.17, 1.19; p=0.019) (Fig. 2A).
In all patients who had matched sample, sPDL1 value increased after progression compared with baseline (Fig. 2B). In the PR group and the SD group, the level of sPDL1 was increased with disease progression.

Discussion

Currently, there is no reliable biomarker to predict the response of chemotherapy. Previous studies have examined whether sPDL1 might have a prognostic implication of advanced cancers [1114]. Our previous studies have examined the value of sPDL1 as a biomarker in biliary tract cancer and pancreatic cancer patients [13,18,19]. The current prospective study examines the role of sPDL1 as a biomarker. In this study, we found that higher pre-chemotherapy sPDL1 is associated with shorter OS and PFS in GC patients, indicating that sPDL1 has a prognostic role in patients with metastatic or recurrent GC. There are conflicting results of sPDL1 value and prognosis in GC [15,16]. In one study, sPDL1 did not play a role as a prognostic factor, meanwhile the subgroup of patients with high sPDL1 had a better prognosis [15]. In another study, higher sPDL1 predicted a worse prognosis [16]. We suggested the association of high baseline sPDL1 with poor prognosis of GC patients through this prospective study.
The PD-1/PD-L1 pathway inhibits T-cell–mediated immune responses. These PD-L1/PD-1 interactions are known to be the mechanism by which cancer cells avoid host immune responses [20]. This is the main mechanism to inhibit the inflammatory response that kills cancer cells. Although sPDL1 may be secreted from immune cells during the inflammatory process, it may also be secreted from tumor cells. Studies have shown that there are subtypes of sPDL1 depending on the cells that secrete [21,22]. A recent study that summarizes the previous studies on sPDL1 showed several different forms of PD-L1 measured in serum [22]. These include monomeric shed forms, monomeric and dimeric splice variants, microvesicles and exosomes, and their origin may be tumor cells or normal immune cells. This diversity of origins and forms of sPDL1 may be the reason for conflicting conclusions from previous studies analyzing the prognosis of GC patients and sPDL1 [15,16]. Furthermore, although other studies have examined how sPDL1 is secreted and how it acts during this inflammatory reaction, the mechanism remains unclear [21,23,24]. For sPDL1 to establish itself as a biomarker, additional research is needed on the origin of sPDL1 and its mechanism of action in tumors.
The advantages of our study is to serially collect the data of sPDL1 and to examine the serial change of sPDL1 through entire chemotherapy in patients with GC. To our knowledge, our study is the first to show dynamics of sPDL1 during treatment. Our study showed a significant trend toward increase of sPDL1 as tumor progressed, suggesting increase of sPDL1 during chemotherapy could reflect tumor progression. The prognostic or predictive roles of sPDL1 in cancer have been controversial because there are the different kinds of sources of sPDL1 and it depends on several clinical situations [20]. To overcome these issues, we evaluated serial change of sPDL1 as well as baseline sPDL1 and showed significant change according to disease progression, suggesting that sPDL1 could be a biomarker of chemotherapy. Furthermore, we further sought to find the relationship between tumor burden and sPDL1. We hypothesized that the sPDL1 levels of PR group patients who are responding to chemotherapy will be decreased. However, the sPDL1 levels of PR group patients increased after 1st cycle and at the best response. Elevation of sPDL1 levels in patients responding to treatment were found in previous studies of immunotherapy in patients with melanoma [21]. And, patients of the PD group who did not respond to chemotherapy, their sPDL1 levels were initially high and rather decreased after 1st cycle and at the best response. This may be the result of not distinguishing the origin of sPDL1 between sPDL1 derived from membrane-bound PD-L1 expressed in tumors and sPDL1 derived from tumor-promoting inflammation or inflammation from cancer cell death [22]. Further studies are needed to examine the dynamics of sPDL1 in GC and the mechanisms involved. In this case, serial follow-up is easy according to the courses of treatment, and it is less invasive than repetitive tumor biopsy.
The sPDL1 values were associated with NLR, MLR, and PLR. This is probably because these variables are all related to the inflammatory response. Inflammation is known to cause carcinogenesis and cancer progression. Moreover, gastrointestinal cancer is known to be associated with inflammatory reactions [25]. It is suggested that inflammatory markers such as white blood cell count, NLR, and PLR are correlated with sPDL1 as the chronic inflammatory reaction continues. NLR is a prognostic factor in almost all carcinomas and is a simple but powerful [2628]. In our previous study, NLR was also to be found as a significant prognostic factor in advanced GC [29]. This study is the first to demonstrate the correlation between NLR and sPDL1 in GC patients, which is of great clinical significance.
This study is the first prospective study to investigate the role of sPDL1 as a biomarker in GC patients. Further studies that confirm the importance of sPDL1 and the effectiveness of immunotherapy may be necessary to predict which patients will benefit from immunotherapy in the future. In addition, in order for sPDL1 to be used as a biomarker, the immunological role of sPDL1 and the relationship with other inflammatory factors should be further studied.
In conclusion, sPDL1 in the serum of metastatic or recurrent GC patients can be a prognostic factor for palliative chemotherapy. This study suggests the role of sPDL1 as a biomarker in the area of liquid biopsy.

Electronic Supplementary Material

Supplementary materials are available at Cancer Research and Treatment website (https://www.e-crt.org).

Notes

Ethical Statement

The study protocol was reviewed and approved by the Institutional Review Board of Seoul National University Hospital (IRB No. 1807-102-960). All studies were conducted according to the declaration of Helsinki.

Author Contributions

Conceived and designed the analysis: Park W, Oh DY.

Collected the data: Park W, Oh DY.

Contributed data or analysis tools: Park W, Bang JH, Nam AR, Jin MH, Seo H, Kim JM, Oh KS, Kim TY, Oh DY.

Performed the analysis: Park W, Kim TY, Oh DY.

Wrote the paper: Park W, Kim TY, Oh DY.

Conflicts of Interest

Conflicts of interest relevant to this article was not reported.

ACKNOWLEDGMENTS

This study was supported by SNUH research fund (Grant No. 03-2017-0100).

References

1. Ferlay J, Soerjomataram I, Dikshit R, Eser S, Mathers C, Rebelo M, et al. Cancer incidence and mortality worldwide: sources, methods and major patterns in GLOBOCAN 2012. Int J Cancer. 2015; 136:E359–86.
crossref
2. Corley DA, Buffler PA. Oesophageal and gastric cardia adenocarcinomas: analysis of regional variation using the Cancer Incidence in Five Continents database. Int J Epidemiol. 2001; 30:1415–25.
crossref
3. Kim YH, Shin SW, Kim BS, Kim JH, Kim JG, Mok YJ, et al. Paclitaxel, 5-fluorouracil, and cisplatin combination chemotherapy for the treatment of advanced gastric carcinoma. Cancer. 1999; 85:295–301.
crossref
4. Bang YJ, Kang WK, Kang YK, Kim HC, Jacques C, Zuber E, et al. Docetaxel 75 mg/m(2) is active and well tolerated in patients with metastatic or recurrent gastric cancer: a phase II trial. Jpn J Clin Oncol. 2002; 32:248–54.
crossref
5. Bang YJ, Van Cutsem E, Feyereislova A, Chung HC, Shen L, Sawaki A, et al. Trastuzumab in combination with chemotherapy versus chemotherapy alone for treatment of HER2-positive advanced gastric or gastro-oesophageal junction cancer (ToGA): a phase 3, open-label, randomised controlled trial. Lancet. 2010; 376:687–97.
crossref
6. Fuchs CS, Tomasek J, Yong CJ, Dumitru F, Passalacqua R, Goswami C, et al. Ramucirumab monotherapy for previously treated advanced gastric or gastro-oesophageal junction adenocarcinoma (REGARD): an international, randomised, multicentre, placebo-controlled, phase 3 trial. Lancet. 2014; 383:31–9.
crossref
7. U.S. Food and Drug Administration. FDA grants accelerated approval to pembrolizumab for advanced gastric cancer. Silver Spring MD: U.S. Food and Drug Administration;2018.
8. Kang YK, Boku N, Satoh T, Ryu MH, Chao Y, Kato K, et al. Nivolumab in patients with advanced gastric or gastro-oesophageal junction cancer refractory to, or intolerant of, at least two previous chemotherapy regimens (ONO-4538-12, ATTRACTION-2): a randomised, double-blind, placebo-controlled, phase 3 trial. Lancet. 2017; 390:2461–71.
crossref
9. Doi T, Piha-Paul SA, Jalal SI, Saraf S, Lunceford J, Koshiji M, et al. Safety and antitumor activity of the anti-programmed death-1 antibody pembrolizumab in patients with advanced esophageal carcinoma. J Clin Oncol. 2018; 36:61–7.
crossref
10. Alexandrov LB, Nik-Zainal S, Wedge DC, Aparicio SA, Behjati S, Biankin AV, et al. Signatures of mutational processes in human cancer. Nature. 2013; 500:415–21.
11. Zhang J, Gao J, Li Y, Nie J, Dai L, Hu W, et al. Circulating PD-L1 in NSCLC patients and the correlation between the level of PD-L1 expression and the clinical characteristics. Thorac Cancer. 2015; 6:534–8.
12. Finkelmeier F, Canli O, Tal A, Pleli T, Trojan J, Schmidt M, et al. High levels of the soluble programmed death-ligand (sPD-L1) identify hepatocellular carcinoma patients with a poor prognosis. Eur J Cancer. 2016; 59:152–9.
crossref
13. Ha H, Nam AR, Bang JH, Park JE, Kim TY, Lee KH, et al. Soluble programmed death-ligand 1 (sPDL1) and neutrophil-to-lymphocyte ratio (NLR) predicts survival in advanced biliary tract cancer patients treated with palliative chemotherapy. Oncotarget. 2016; 7:76604–12.
crossref
14. Okuma Y, Hosomi Y, Nakahara Y, Watanabe K, Sagawa Y, Homma S. High plasma levels of soluble programmed cell death ligand 1 are prognostic for reduced survival in advan-ced lung cancer. Lung Cancer. 2017; 104:1–6.
crossref
15. Zheng Z, Bu Z, Liu X, Zhang L, Li Z, Wu A, et al. Level of circulating PD-L1 expression in patients with advanced gastric cancer and its clinical implications. Chin J Cancer Res. 2014; 26:104–11.
16. Takahashi N, Iwasa S, Sasaki Y, Shoji H, Honma Y, Takashima A, et al. Serum levels of soluble programmed cell death ligand 1 as a prognostic factor on the first-line treatment of metastatic or recurrent gastric cancer. J Cancer Res Clin Oncol. 2016; 142:1727–38.
crossref
17. Pencina MJ, D’Agostino RB Sr. Evaluating discrimination of risk prediction models: the C statistic. JAMA. 2015; 314:1063–4.
18. Ha H, Bang JH, Nam AR, Park JE, Jin MH, Bang YJ, et al. Dynamics of soluble programmed death-ligand 1 (sPDL1) during chemotherapy and its prognostic implications in cancer patients: biomarker development in immuno-oncology. Cancer Res Treat. 2019; 51:832–40.
crossref
19. Park H, Bang JH, Nam AR, Eun Park J, Hua Jin M, Bang YJ, et al. Prognostic implications of soluble programmed death-ligand 1 and its dynamics during chemotherapy in unresectable pancreatic cancer. Sci Rep. 2019; 9:11131.
crossref
20. Dong H, Strome SE, Salomao DR, Tamura H, Hirano F, Flies DB, et al. Tumor-associated B7-H1 promotes T-cell apoptosis: a potential mechanism of immune evasion. Nat Med. 2002; 8:793–800.
crossref
21. Zhou J, Mahoney KM, Giobbie-Hurder A, Zhao F, Lee S, Liao X, et al. Soluble PD-L1 as a biomarker in malignant melanoma treated with checkpoint blockade. Cancer Immunol Res. 2017; 5:480–92.
crossref
22. Daassi D, Mahoney KM, Freeman GJ. The importance of exosomal PDL1 in tumour immune evasion. Nat Rev Immunol. 2020; 20:209–15.
23. Keir ME, Butte MJ, Freeman GJ, Sharpe AH. PD-1 and its ligands in tolerance and immunity. Annu Rev Immunol. 2008; 26:677–704.
crossref
24. Frigola X, Inman BA, Krco CJ, Liu X, Harrington SM, Bulur PA, et al. Soluble B7-H1: differences in production between dendritic cells and T cells. Immunol Lett. 2012; 142:78–82.
crossref
25. Echizen K, Hirose O, Maeda Y, Oshima M. Inflammation in gastric cancer: interplay of the COX-2/prostaglandin E2 and Toll-like receptor/MyD88 pathways. Cancer Sci. 2016; 107:391–7.
26. Oh BS, Jang JW, Kwon JH, You CR, Chung KW, Kay CS, et al. Prognostic value of C-reactive protein and neutrophil-to-lymphocyte ratio in patients with hepatocellular carcinoma. BMC Cancer. 2013; 13:78.
crossref
27. Yin Y, Wang J, Wang X, Gu L, Pei H, Kuai S, et al. Prognostic value of the neutrophil to lymphocyte ratio in lung cancer: a meta-analysis. Clinics (Sao Paulo). 2015; 70:524–30.
crossref
28. Haram A, Boland MR, Kelly ME, Bolger JC, Waldron RM, Kerin MJ. The prognostic value of neutrophil-to-lymphocyte ratio in colorectal cancer: a systematic review. J Surg Oncol. 2017; 115:470–9.
crossref
29. Ock CY, Nam AR, Lee J, Bang JH, Lee KH, Han SW, et al. Prognostic implication of antitumor immunity measured by the neutrophil-lymphocyte ratio and serum cytokines and angiogenic factors in gastric cancer. Gastric Cancer. 2017; 20:254–62.
crossref

Fig. 1
Comparison of overall survival and progression-free survival according to soluble form programmed death-ligand 1 (sPDL1). (A) The overall survival according to baseline sPDL1 value. (B) The progression-free survival according to baseline sPDL1 value. Patients with lower levels of sPDL1 at baseline showed a better progression-free survival than the patients with a higher level of sPDL1 (median PFS, 8.9 months vs. 6.0 months; p=0.040).
crt-2020-497f1.tif
Fig. 2
Dynamics of soluble form programmed death-ligand 1 (sPDL1). (A) Baseline sPDL1 per response. The baseline sPDL1 before treatment was higher in the progressive disease (PD) group than in the stable disease (SD) and partial response (PR) groups (mean, 2.91, 1.17, 1.19 ng/mL; p=0.019). (B) Dynamics of sPDL1 after progression in patients who have matched sample. The sPDL1 of after progression was higher than baseline. (mean, 1.45 ng/mL vs. 1.24 ng/mL; p=0.029).
crt-2020-497f2.tif
Table 1
Baseline characteristics
Characteristic No. (%)
Ages at diagnosis, median (range, yr) 56 (28–80)
Sex
 Male 43 (63.2)
 Female 25 (36.8)
Pathology
 Adenocarcinoma, W/D 2 (2.9)
 Adenocarcinoma, M/D 20 (29.4)
 Adenocarcinoma, P/D 18 (26.5)
 Poorly cohesive carcinoma 20 (29.4)
 Mixed 8 (11.8)
HER2 status
 HER2 positive 13 (19.1)
 HER2 negative 55 (80.9)
Microsatellite status
 MSI-High 3 (4.4)
 MSI-Low 3 (4.4)
 MSS 27 (39.7)
 Unknown 35 (51.5)
Disease status
 Relapsed after curative surgery 10 (14.7)
 Undergone palliative surgery 18 (26.5)
 Metastatic cancer 40 (58.8)
Metastatic organ
 Liver 15 (22.1)
 Lymph nodes 22 (32.4)
 Peritoneum 37 (54.4)
 Lung 10 (14.7)
 Brain 2 (2.9)
Best response to 1st-line chemotherapy
 Complete response 0
 Partial response 34 (50)
 Stable disease 29 (42.6)
 Progressive disease 5 (7.4)
Post progression treatment
 1st line 32 (47.0)
 2nd line 25 (36.8)
 3rd line 8 (11.8)
 4th line 3 (4.4)
Median OS (95% CI, mo) 14.9 (7.3–22.5)
Median PFS (95% CI, mo) 8.00 (6.0–10.0)

CI, confidence interval; HER2, human epidermal growth factor receptor 2; M/D, moderately differentiated; MSI, microsatellite instability; MSS, microsatellite stable; OS, overall survival; P/D, poorly differentiated; PFS, progression-free survival; W/D, well differentiated.

Table 2
Laboratory test result
Baseline (n=68) After 1st cycle (n=68) Best response (n=67) After progression (n=42)


Median (range) Average (95% CI) Median (range) Average (95% CI) Median (range) Average (95% CI) Median (range) Average (95% CI)
WBC (×1,000/mm3) 6.81 (3.86–21.07) 7.46 (6.76–8.16) 5.45 (2.64–17.92) 6.47 (5.70–7.24) 4.68 (2.42–23.75) 5.59 (4.81–6.37) 5.52 (2.80–17.00) 5.23 (4.81–6.37)

Hb (g/dL) 11.6 (8.70–14.80) 11.66 (11.26–12.06) 11.45 (8.40–15.2) 11.47 (11.09–11.84) 11.2 (6.50–15.40) 11.2 (10.79–11.61) 10.85 (8.10–14.80) 10.81 (10.32–11.24)

PLT (×1,000/mm3) 279 (108–559) 295 (270–320) 250 (91–536) 253 (231–276) 205 (54–556) 214 (190–239) 211 (33–597) 225.9 (192–260)

Neutrophil/Lymphocyte ratio 2.38 (0.45–15.00) 3.06 (2.43–3.69) 1.64 (0.49–16.02) 2.46 (1.88–3.03) 1.3 (0.41–7.65) 1.87 (1.48–2.26) 2.19 (0.64–17.56) 3.08 (2.34–4.18)

Monocyte/Lymphocyte ratio 0.3 (0.13–1.24) 0.34 (0.3–0.38) 0.29 (0.13–0.95) 0.36 (0.31–0.40) 0.33 (0.12–0.94) 0.38 (0.34–0.42) 0.35 (0.11–2.15) 0.46 (0.36–0.57)

Platelet/Lymphocyte ratio 162.4 (53.49–427.66) 174.65 (156.80–192.50) 136.09 (40.47–354.42) 148.93 (133.70–164.15) 126.01 (31.04–608.98) 131.81 (111.98–151.63) 137.15 (22.24–639.35) 166.11 (130.14–201.19)

CEA (ng/dL) 2.65 (< 0.5–3,867.40) 90.17 (0–212.772) 2.9 (< 0.5–477.50) 21.61 (2.96–40.26) 2.8 (< 0.5–512.7) 20.55 (1.96–39.14) 4.3 (0.60–1,480.30) 63.91 (0–143.78)

CA 19-9 (U/mL) 17 (< 1.0–7,869.0) 382.17 (76.33–664.56) 14.2 (< 1.0–10,349) 317.14 (0–677.56) 17 (< 1.0–6,300) 209 (0–416.27) 35 (2.00–12,000) 605.09 (0–1,228.02)

sPDL1 (ng/mL) 0.8 (0.06–6.06) 1.31 (0.98–1.63) 0.92 (0.28–6.73) 1.52 (1.16–1.88) 1.01 (0.07–6.29) 1.46 (1.11–1.81) 1.22 (0.23–7.11) 1.45 (1.06–1.84)

CA 19-9, cancer antigen 19-9; CEA, carcinoembryonic antigen; CI, confidence interval; Hb, hemoglobin; PLT, platelet; sPDL1, soluble form programmed death-ligand 1; WBC, white blood cell.

Table 3
Univariate and multivariate analysis for survival
Variable Univariate analysis Multivariate analysis


HR (95% CI) p-value HR (95% CI) p-value
Age ≥ 60 yr (vs. < 60 yr) 1.082 (0.612–1.915) 0.785 - -

ECOG PS > 2 (vs. ≤ 2) 1.851 (0.436–7.861) 0.443 - -

Relapsed disease (vs. unresectable) 1.496 (0.750–2.987) 0.253 - -

Peritoneal seeding (vs. without seeding) 1.874 (1.085–3.236) 0.024 1.340 (0.726–2.697) 0.315

No. of metastasis organ > 2 (vs. ≤ 2) 1.706 (0.793–3.669) 0.171 - -

Undergone resection (vs. no) 0.503 (0.284–0.891) 0.019 0.603 (0.321–1.134) 0.117

1st line therapy (vs. further line) 0.794 (0.456–1.383) 0.415 - -

HER2-positive (vs. -negative) 1.094 (0.561–2.132) 0.792 - -

With anemia (vs. without anemia) 0.892 (0.502–1.582) 0.675 - -

CEA > 5 ng/dL (vs. ≤ 5) 1.422 (0.793–2.548) 0.237 - -

CA 19-9 > 37 U/mL (vs. ≤ 37) 1.315 (0.742–2.331) 0.349 - -

sPDL1 > 1.92 ng/mL (vs. ≤ 1.92) 1.837 (0.975–3.458) 0.061 1.448 (0.714–2.935) 0.305

NLR > 3.51 (vs. ≤ 3.51) 3.975 (2.044–7.731) < 0.01 2.381 (1.127–5.031) 0.023

MLR > 0.30 (vs. ≤ 0.30) 2.498 (1.416–4.408) < 0.01 1.565 (0.816–3.005) 0.178

PLR > 135.8 (vs. ≤ 135.8) 2.180 (1.218–3.903) < 0.01 1.525 (0.740–3.319) 0.252

CA 19-9, cancer antigen 19-9; CEA, carcinoembryonic antigen; CI, confidence interval; ECOG PS, Eastern Cooperative Oncology Group performance status; HER2, human epidermal growth factor receptor 2; HR, hazard ratio; MLR, monocyte-to-lymphocyte ratio; NLR, neutrophil-lymphocyte ratio; PLR, platelet-to-lymphocyte ratio; sPDL1, soluble form programmed death-ligand 1.

Table 4
Dynamics of sPDL1 according to response groups
Best response PR SD PD Total p-value
Baseline sPDL1 n=34 n=29 n=5 n=68
 Median (range) 0.74 (0.22–6.06) 0.90 (0.06–4.73) 2.77 (0.25–5.03) 0.80 (0.06–6.06)
 Mean (95% CI) 1.19 (0.77–1.61) 1.17 (0.73–1.61) 2.91 (1.20–4.62) 1.31 (0.98–1.63) 0.018
After 1st cycle n=34 n=29 n=5 n=68
 Median (range) 0.86 (0.28–6.73) 0.84 (0.31–5.44) 1.43 (0.32–2.45) 0.92 (0.28–6.73)
 Mean (95% CI) 1.45 (0.95–1.95) 1.61 (1.04–2.18) 1.47 (0.76–2.18) 1.52 (1.16–1.88) 0.912
At best response n=33 n=29 n=5 n=67
 Median (range) 1.01 (0.07–4.85) 0.97 (0.27–6.29) 1.85 (0.29–7.11) 1.01 (0.07–7.11)
 Mean (95% CI) 1.34 (0.95–1.73) 1.37 (0.86–1.88) 2.80 (0.47–5.13) 1.46 (1.11–1.81) 0.097
After progression n=17 n=20 n=5 n=42
 Median (range) 1.24 (0.29–2.89) 0.97 (0.23–3.46) 1.85 (0.29–7.11) 1.22 (0.23–7.11)
 Mean (95% CI) 1.36 (1.02–1.70) 1.19 (0.78–1.60) 2.80 (0.47–5.13) 1.45 (1.06–1.84) 0.029

CI, confidence interval; PD, progressive disease; PR, partial response; SD, stable disease; sPDL1, soluble form programmed death-ligand 1.

TOOLS
Similar articles