A 46-year-old man with mild hypertension presented with asymmetric motor weakness (Medical Research Council scale scores: 4⁻/5 and 4+/5 in the right and left sides, respectively) in both hands for 1 week. Noncontrast magnetic resonance imaging (MRI) of the brain and cervical spinal cord showed faint T2-hyperintensity in the medulla oblongata and cervical spinal cord (
Fig. 1), which were overlooked. Three weeks after onset of symptoms, the patient visited our neurology clinic for the etiological diagnosis. Gadolinium (Gd)-enhanced cervical spinal cord MRI showed prominent lesions in the intramedullary cervical spinal cord and medulla oblongata and contrast enhancement along the ventricular region and spinal leptomeninges (
Fig. 2). CSF examination revealed lymphocyte-predominant pleocytosis (37/mm
3), with an elevated protein level (132 mg/dL), but CSF cytomorphologic examination was negative for malignancy, and other neuroimmunological tests including antibody to aquaporin 4 (AQP4) antibody, were negative. In addition, serologic tests including the thyroid function test, tumor marker tests, viral tests (human immunodeficiency virus, human T-lymphotropic virus type 1, hepatitis C, herpes simplex virus, cytomegalovirus), CSF-Venereal Disease Research Laboratory test, fluorescent treponemal antibody absorption test, and tests for parasitic infection, were negative. The patient was treated with intravenous methylprednisolone for 5 days, followed by an oral taper of prednisone for 3 months under the presumptive diagnosis of IDD. At the end of the corticosteroid treatment course, the patient showed notable improvement in neurological function. A follow-up cervical MRI revealed significant decrease in parenchymal lesions, except for persistent leptomeningeal enhancement (
Fig. 3). Repeat CSF cytomorphologic examination to exclude hematologic malignancy was negative. Five months after completion of the corticosteroid treatment, the patient presented with acute deterioration in mental status. Computed tomography (CT) of the brain revealed a subependymal high-attenuation lesion in all ventricles, with obstructive hydrocephalus and periventricular edema (
Fig. 4), and the patient underwent emergency ventriculoperitoneal shunting. Brain MRI showed lesions in the hypothalamus and bilateral periventricular white matter, with subependymal contrast enhancement (
Fig. 5). Neuronavigation-guided stereotactic ventricular biopsy confirmed diffuse large B-cell lymphoma (DLBCL), which was positive for B-cell markers, including CD20 and CD79a, but negative for the representative T-cell marker CD3 (
Fig. 6).
18F-fluorodeoxyglucose (FDG) positron emission tomography (PET)/CT of the whole body to detect the presence of non-CNS lymphoma showed abnormal FDG uptake in the right lateral ventricle of the brain with no evidence of systemic involvement (
Fig. 7). The patient was treated with high-dose methotrexate (HD-MTX) for three cycles after the final diagnosis of PCNSL. The follow-up brain MRI showed complete resolution of the subependymal nodular enhancing lesions along the ventricles and hypothalamus (
Fig. 8). However, the patient died from hospital-acquired, multidrug-resistant
Klebsiella pneumoniae bacteremia 3 months after the PCNSL diagnosis, despite complete remission of PCNSL after HD-MTX treatment.
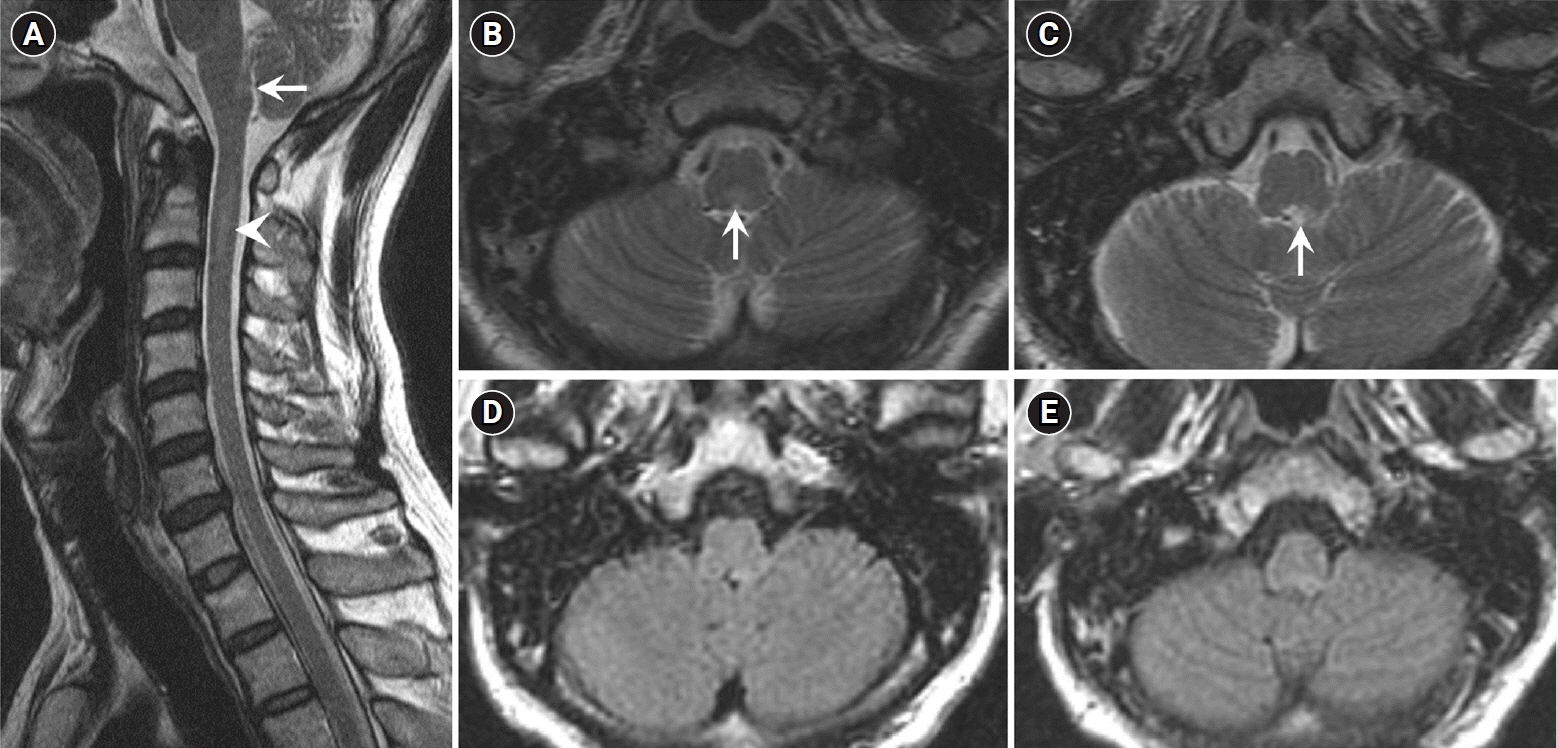 | Fig. 1.Initial magnetic resonance imaging (MRI) of the brain and spinal cord 1 week after onset of symptoms. (A) Sagittal and (B, C) axial T2-weighted images show faint hyperintense multifocal lesions in the medulla oblongata (arrows) and cervical spinal cord (arrowhead). (D, E) High signal intensity in the medulla oblongata on T2-weighted images are not clearly detected on fluid-attenuated inversion recovery. No supratentorial or periventricular white matter lesion was seen on brain MRI (images not shown). 
|
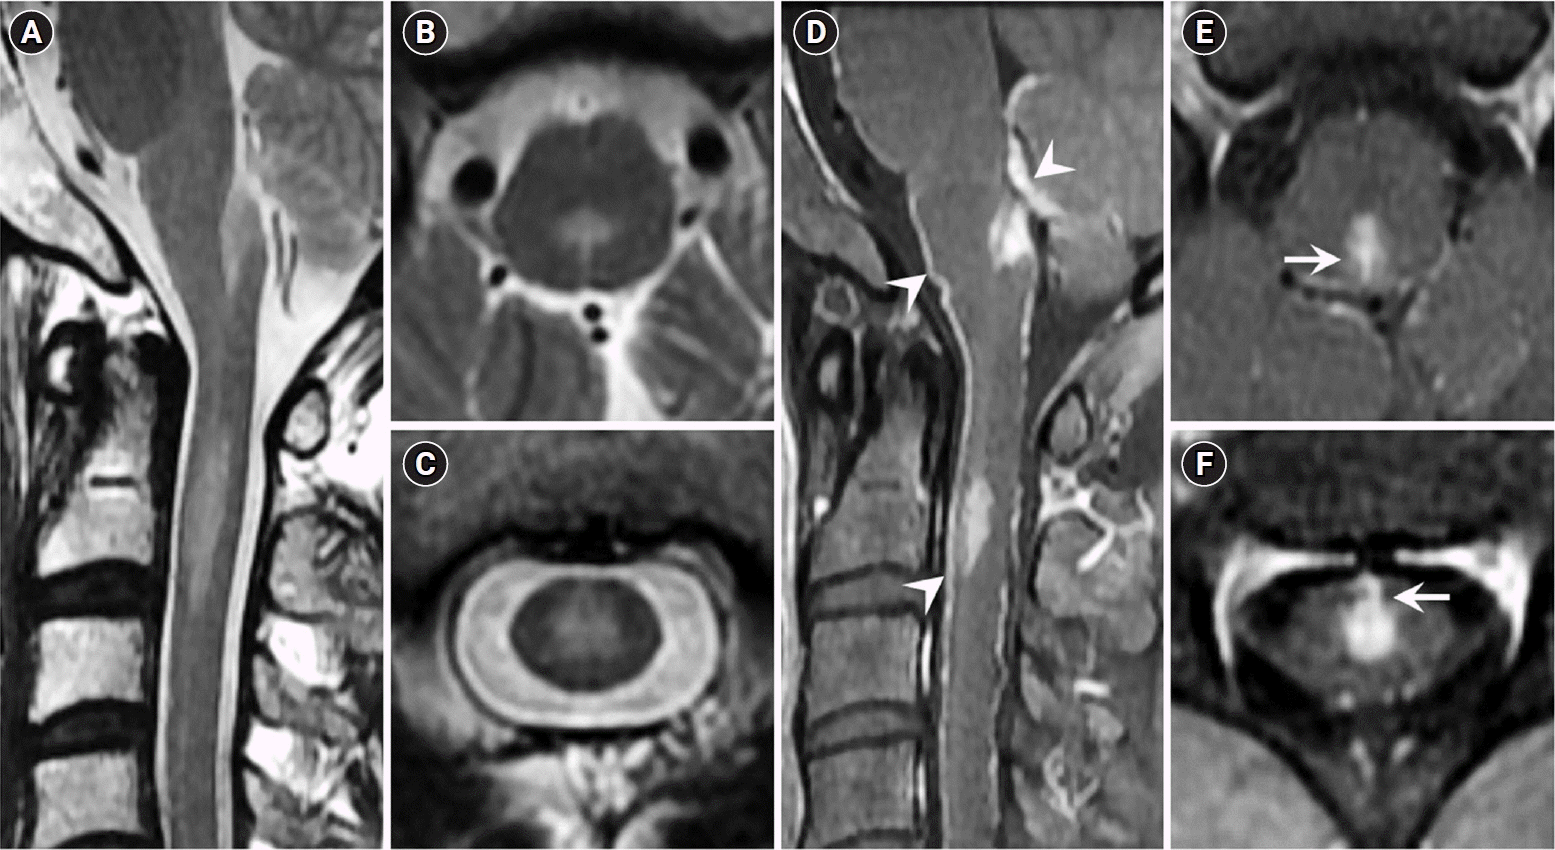 | Fig. 2.Cervical spinal cord magnetic resonance imaging 3 weeks after the onset of symptoms. (A) Sagittal and (B, C) axial T2-weighted images show hyperintense lesions in the medulla oblongata and cervical spinal cord. (D) Gadolinium-enhanced T1-weighted images show leptomeningeal enhancement (arrowheads) and an intraparenchymal tadpole-like signal change (arrows) connected to the leptomeninges at the levels of (E) the medulla oblongata and (F) C2 vertebral body. 
|
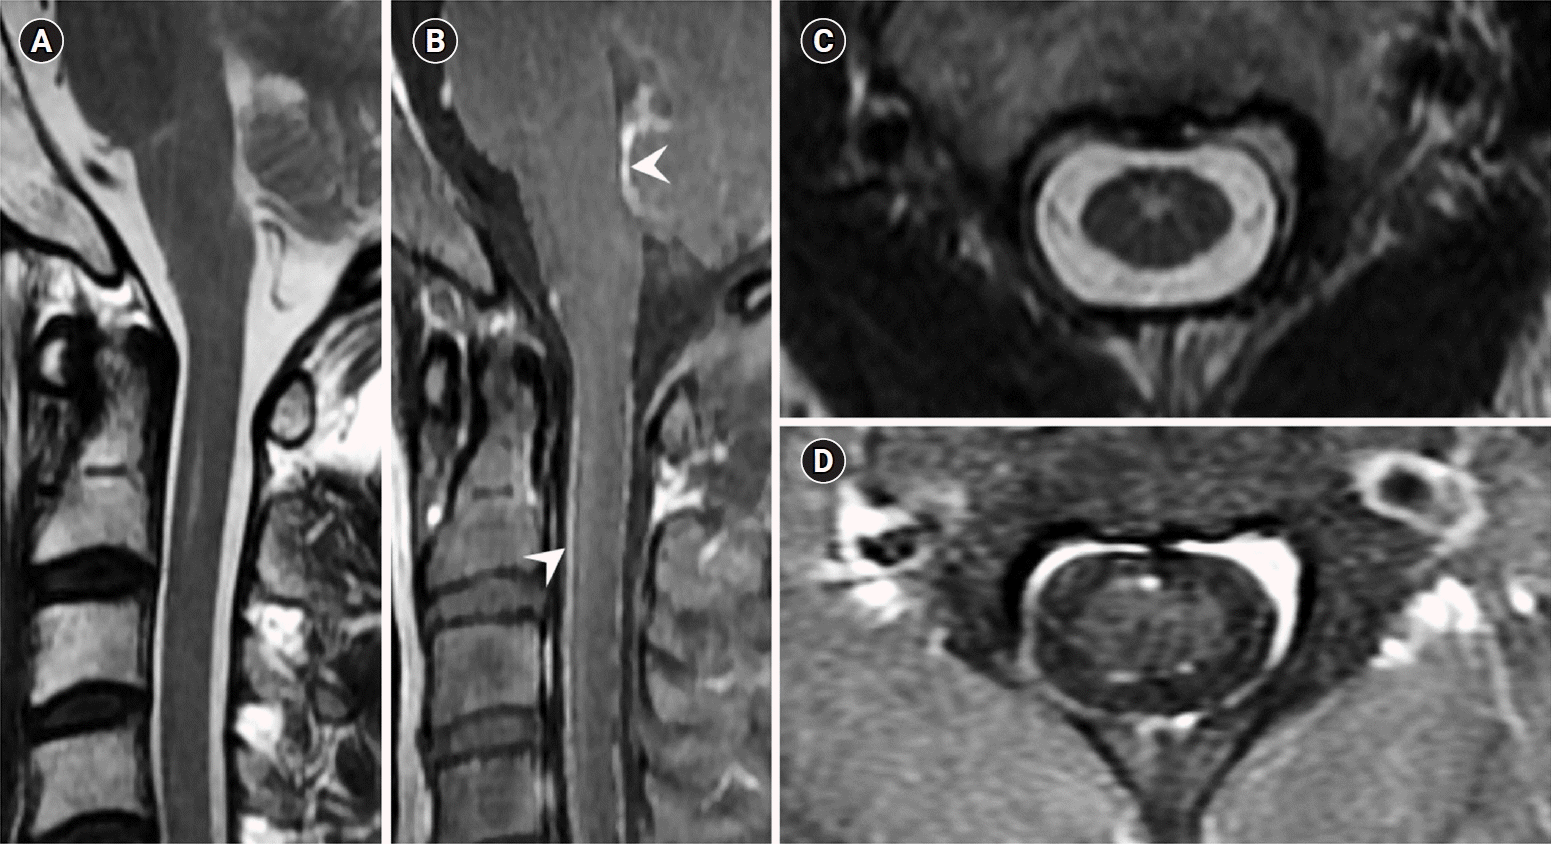 | Fig. 3.Follow-up cervical spinal cord magnetic resonance imaging 6 months after the onset of symptoms. T2-weighted images (A, C) show marked decrease in multifocal lesions with no parenchymal enhancement (B, D). Gadolinium-enhanced T1-weighted sagittal images show persistent leptomeningeal enhancement (B, arrowheads). 
|
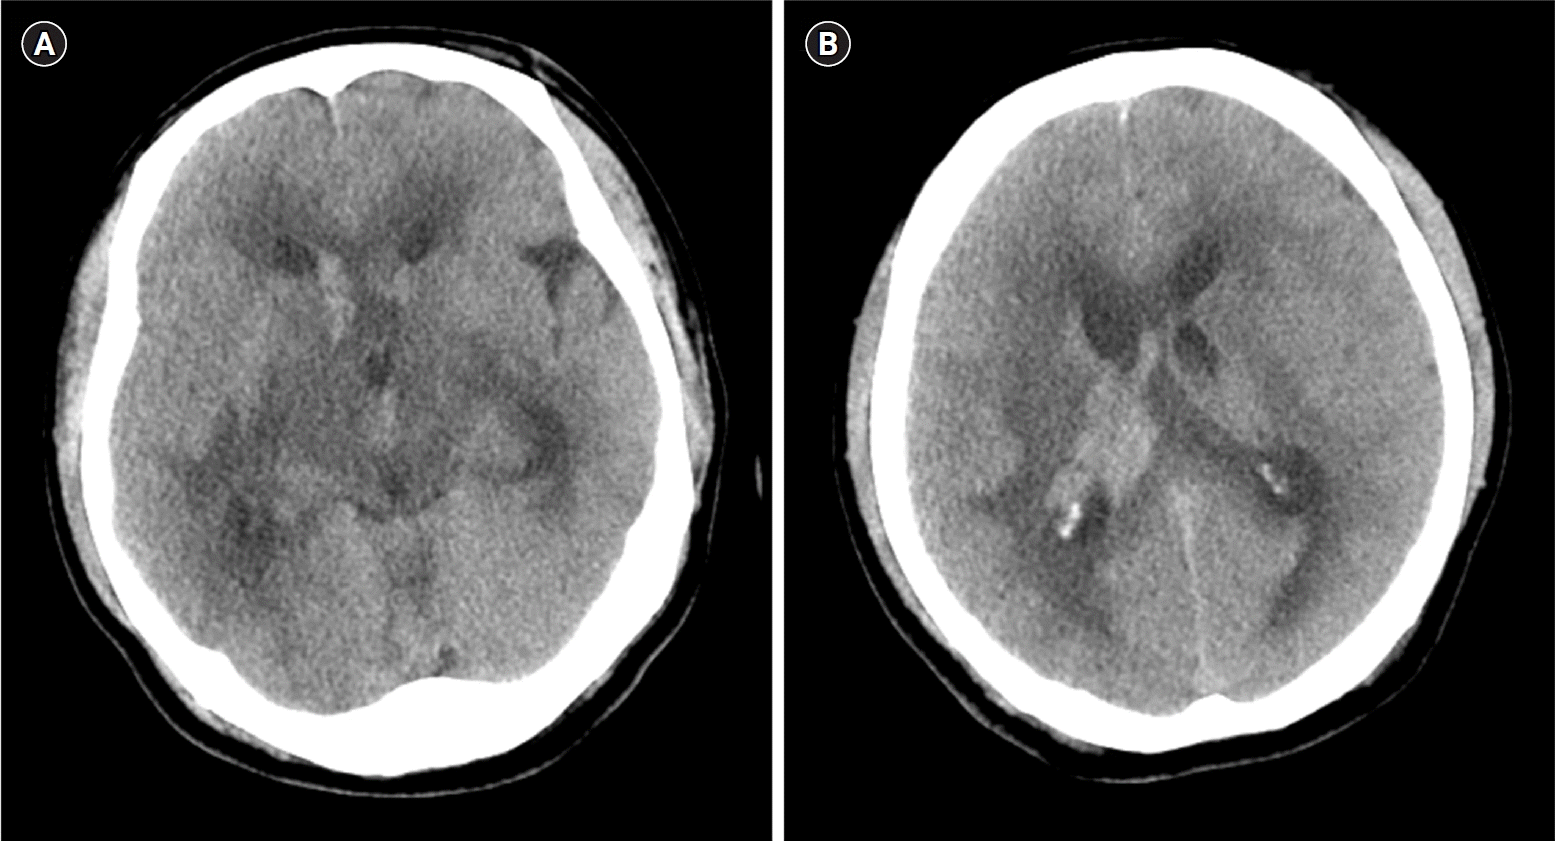 | Fig. 4.Brain computed tomography (CT) at the onset of the semicomatose status. Brain CT shows subependymal hyperdense lesions in all ventricles, including the right lateral ventricle, with hydrocephalus (A), and edema in the periventricular white matter and cerebral peduncle (B). 
|
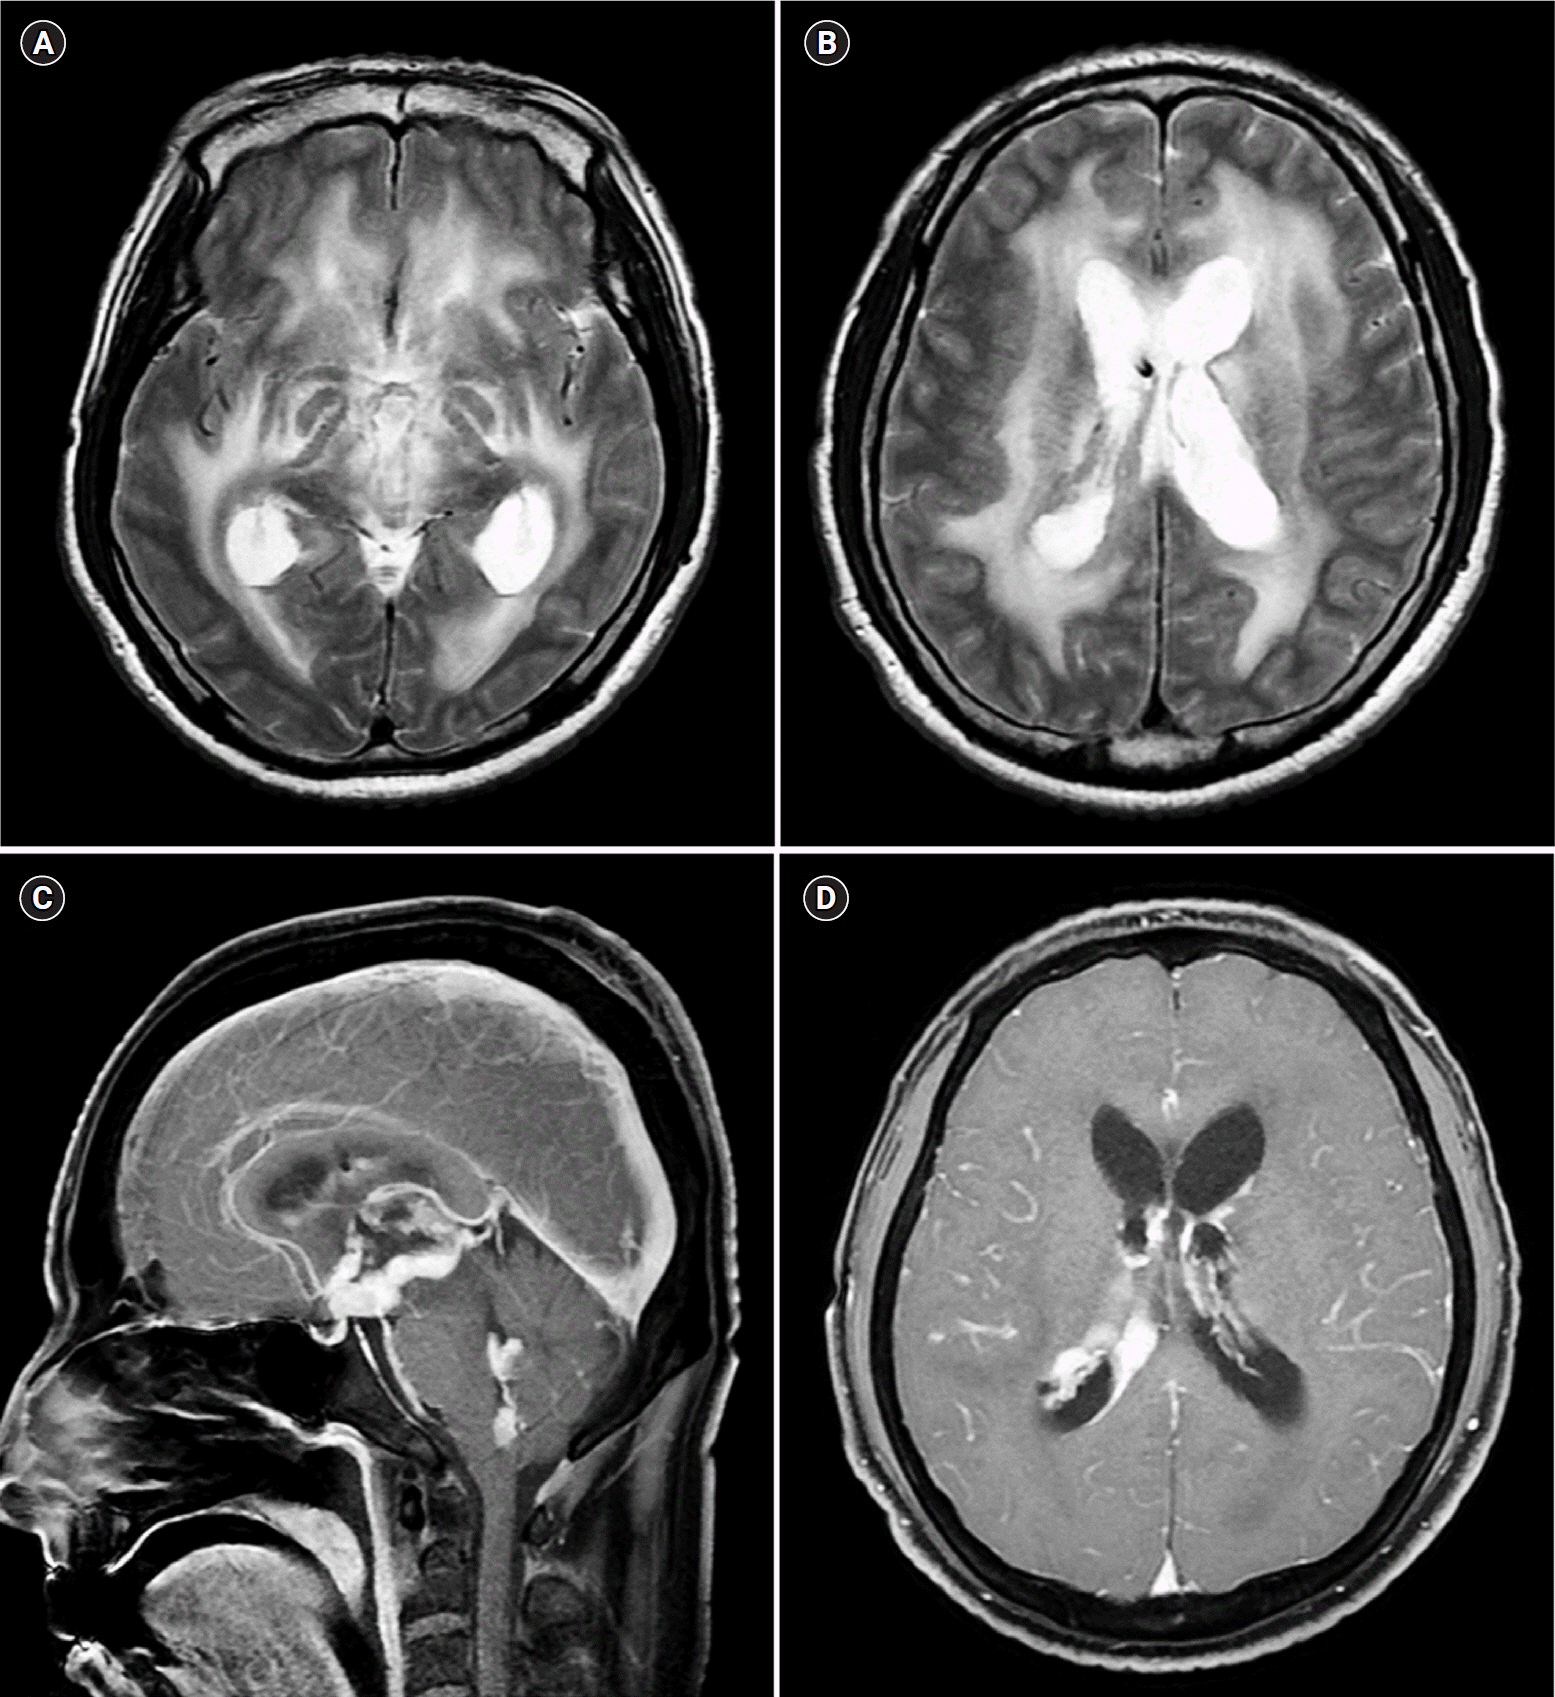 | Fig. 5.Brain magnetic resonance imaging (MRI) after ventricular brain biopsy. (A, B) Axial T2-weighted images show hyperintensities in the hypothalamus and periventricular white matter. (C, D) Gadolinium-enhanced MRI shows multifocal subependymal nodular enhancing lesions. 
|
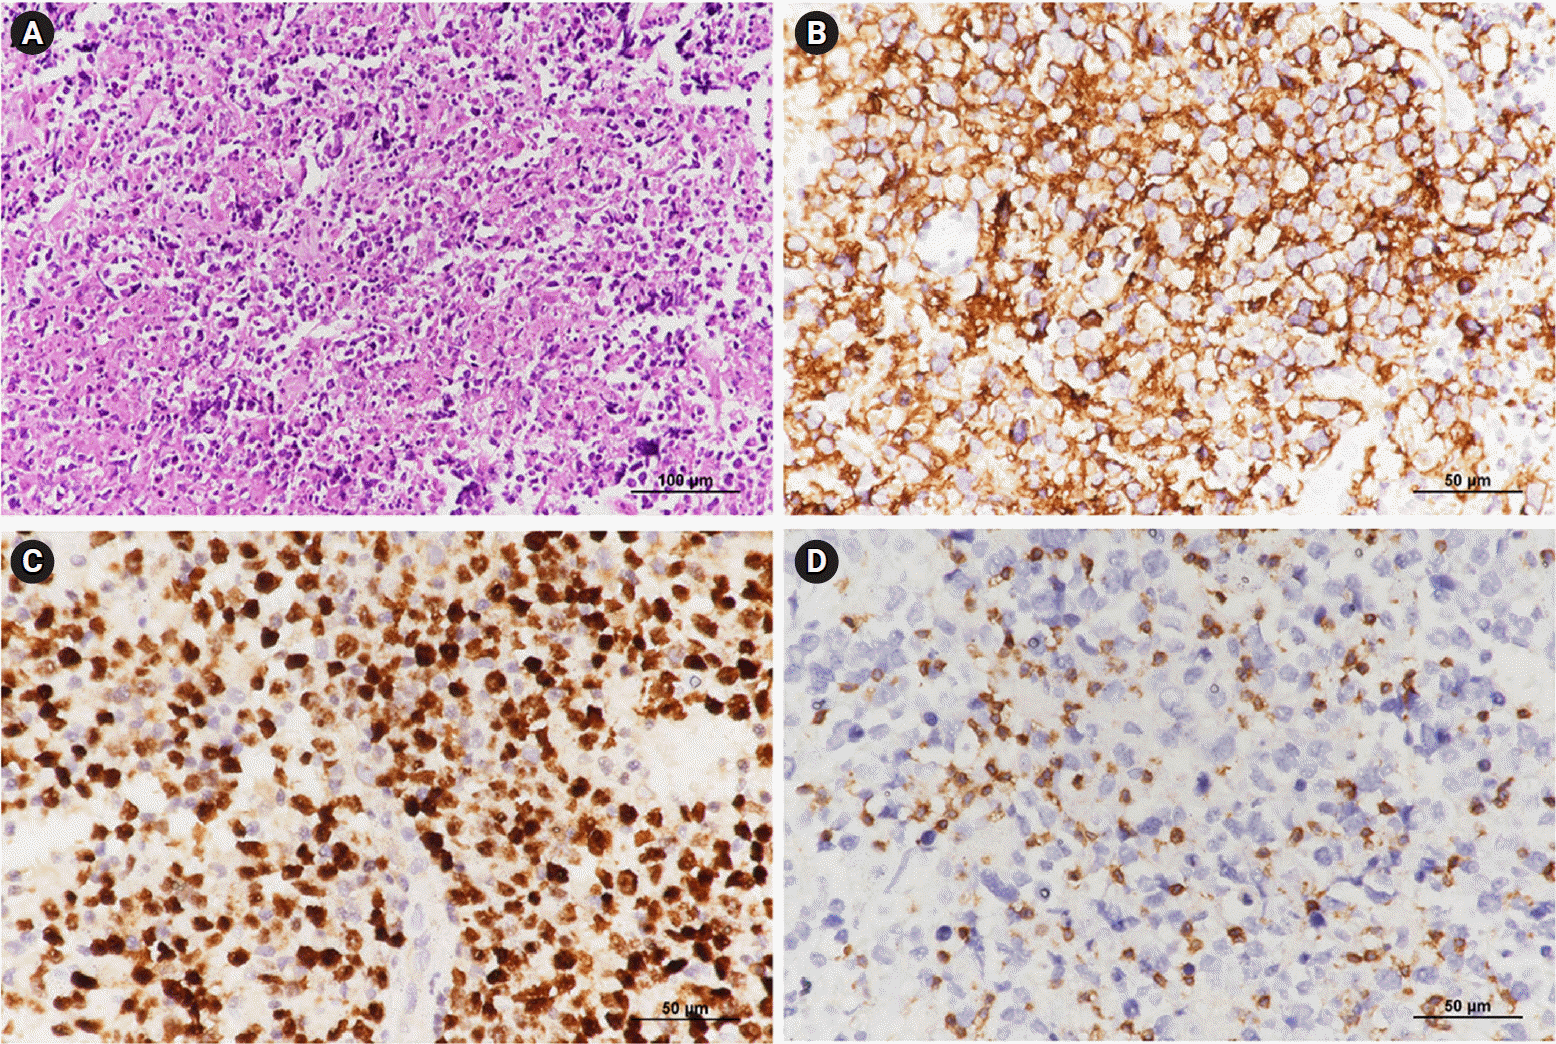 | Fig. 6.Pathologic findings. Hematoxylin and eosin staining (A) reveals large atypical lymphocytes mixed with small mature lymphocytes. Tumor cells were positive for CD20 (B, B-cell marker), with the Ki-67 labeling index approaching 80% (C), but negative for CD3 (D, T-cell marker) on immunohistochemical analysis (original magnification, ×200). 
|
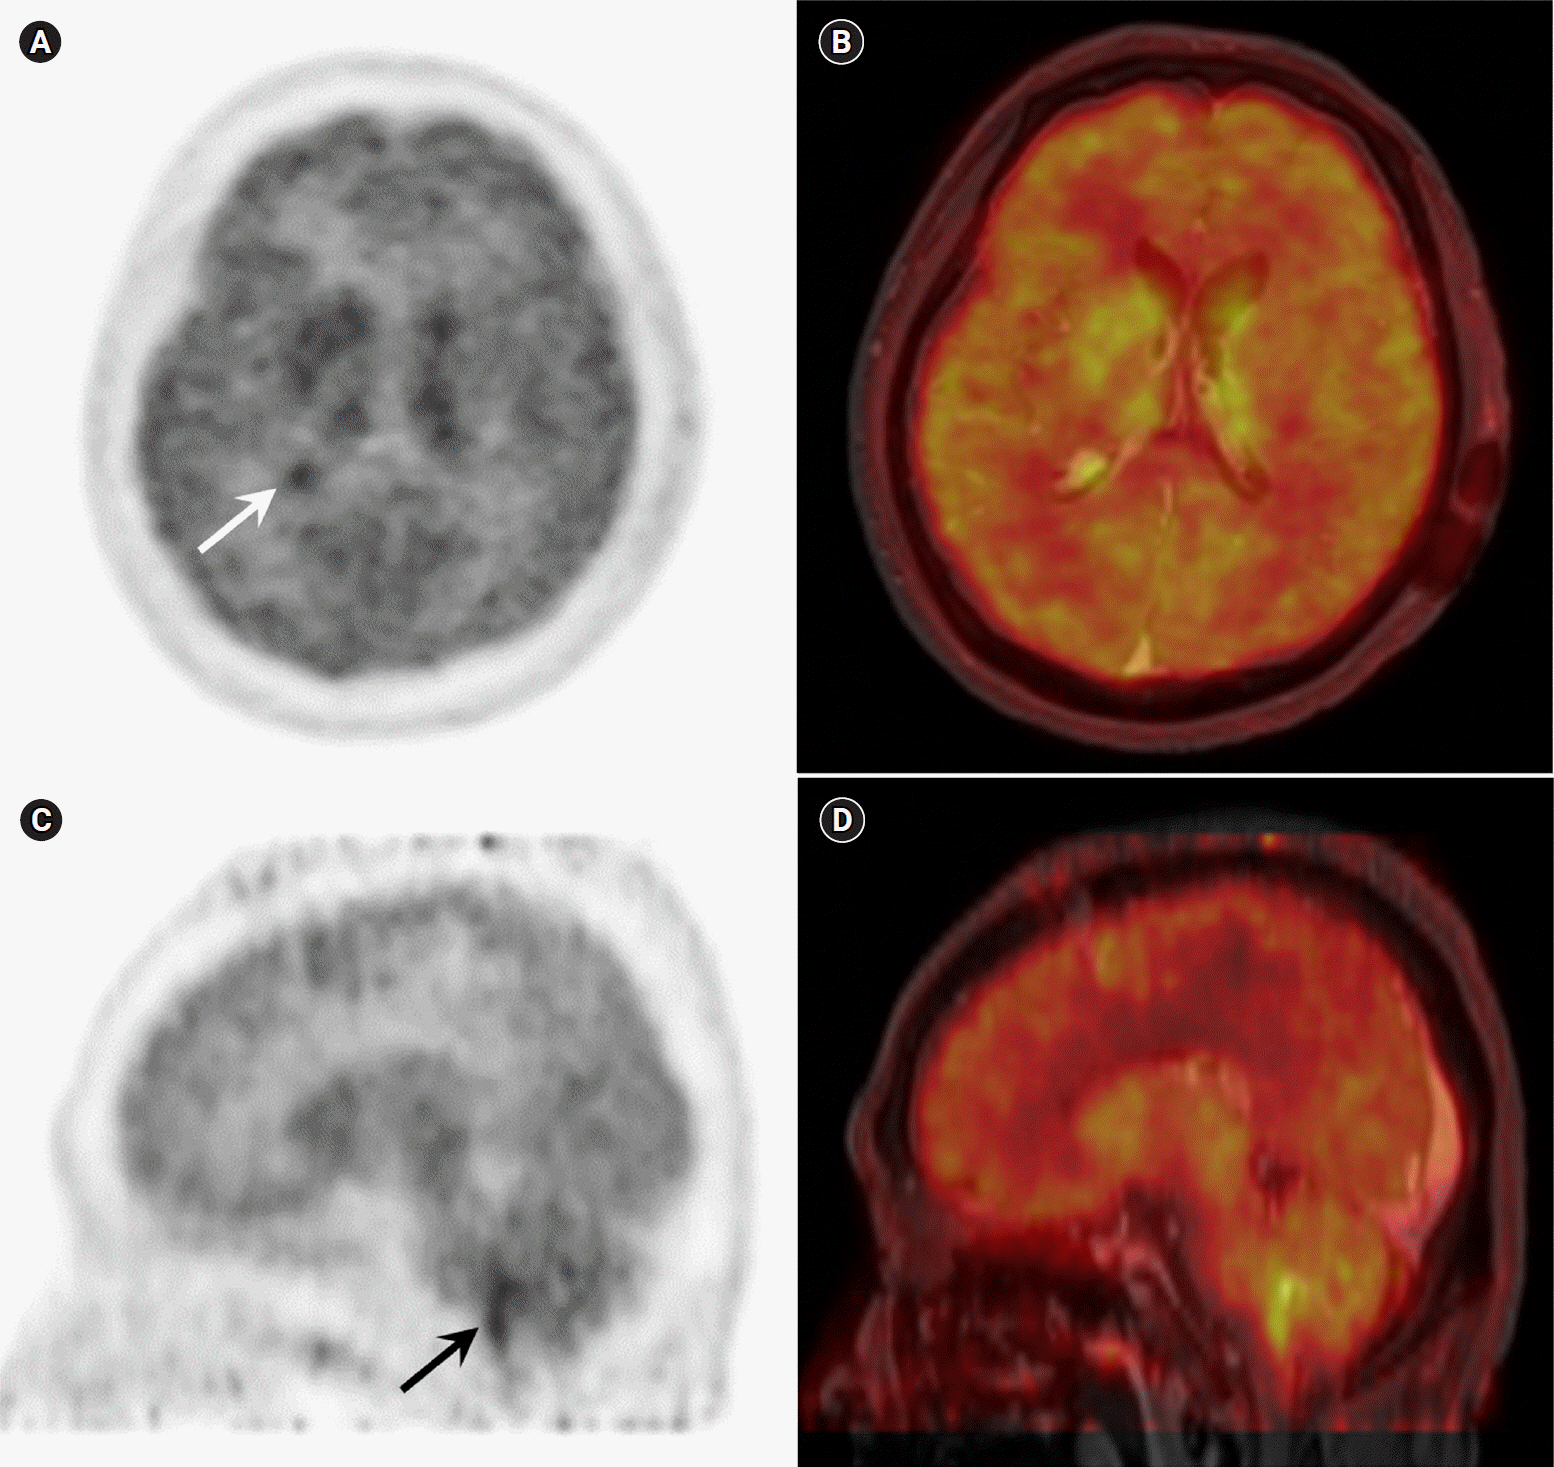 | Fig. 7.
18F-fluorodeoxyglucose (FDG)-positron emission tomography (PET) of the brain. 18F-FDG-PET shows abnormal FDG uptake in the right lateral ventricle (A, white arrow) and inferior 4th ventricle (C, black arrow). PET and coregistered PET/magnetic resonance fusion imaging shows asymmetric, mild hypermetabolic lesions along the body, atrium, and posterior horn of the right lateral ventricle with a maximum standardized uptake volume (SUVmax) of 4.4 (A, B), and moderate hypermetabolic lesions along the inferior 4th ventricle with an SUVmax of 5.6 (C, D). 
|
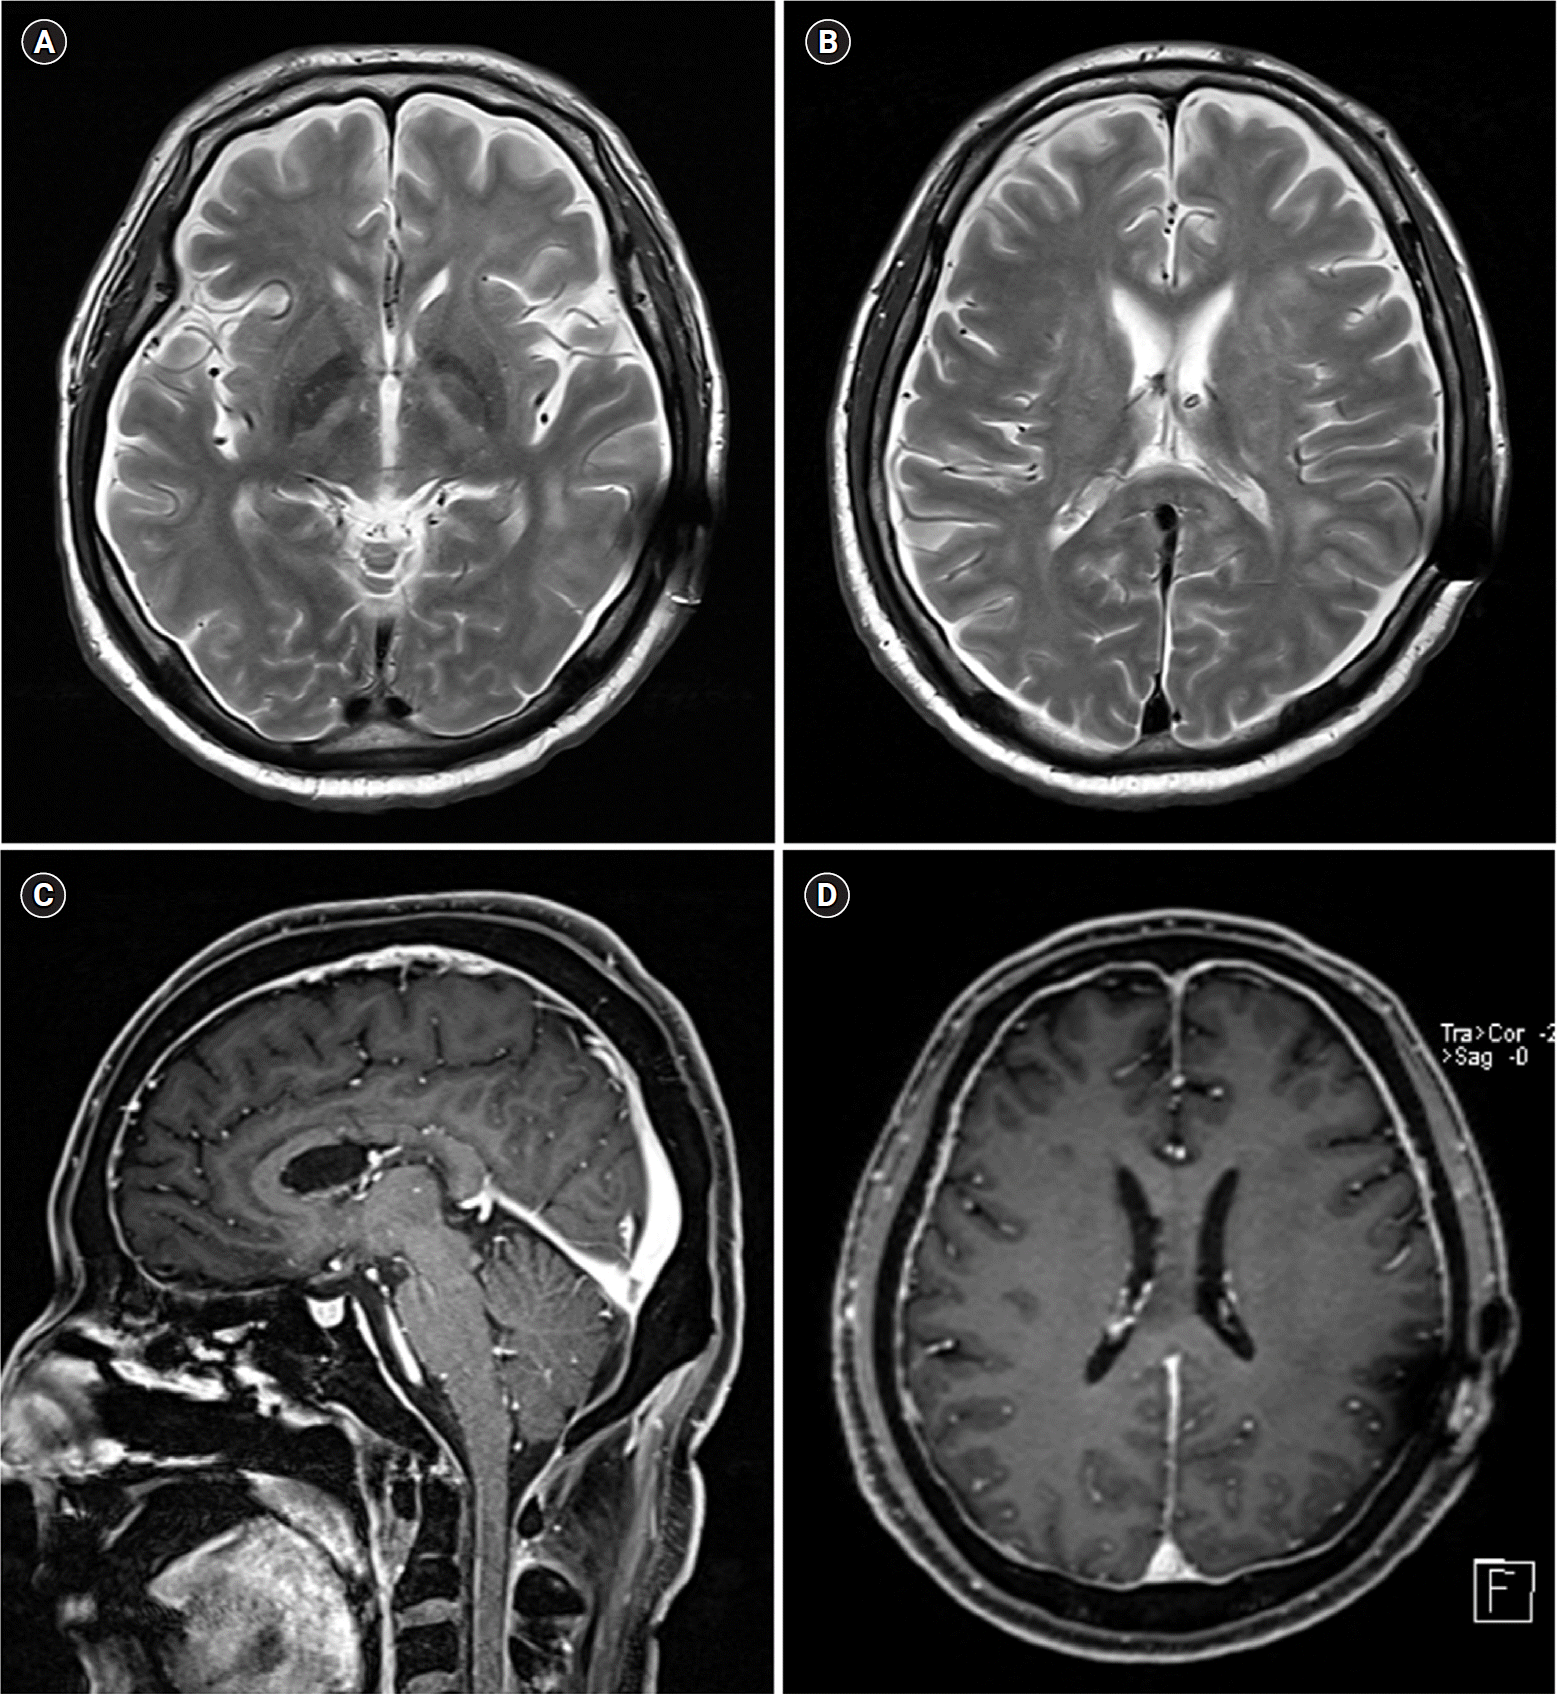 | Fig. 8.Brain magnetic resonance imaging (MRI) after high-dose methotrexate chemotherapy. (A, B) Axial T2-weighted images show complete resolution of the multifocal subependymal nodular lesions in the hypothalamus and ventricular regions. (C, D) Gadolinium-enhanced MRI shows diffuse pachymeningeal thickening with no leptomeningeal enhancement. 
|
The study protocol was approved by the Institutional Review Board at Chonnam National University Hospital (CNUH-EXP-2018-018).


 PDF
PDF Citation
 Print
Print


 XML Download