Introduction
Materials and Methods
1. Study group
2. Treatment
3. Data collection during the study
4. Response criteria and safety
5. Statistical analysis
Results
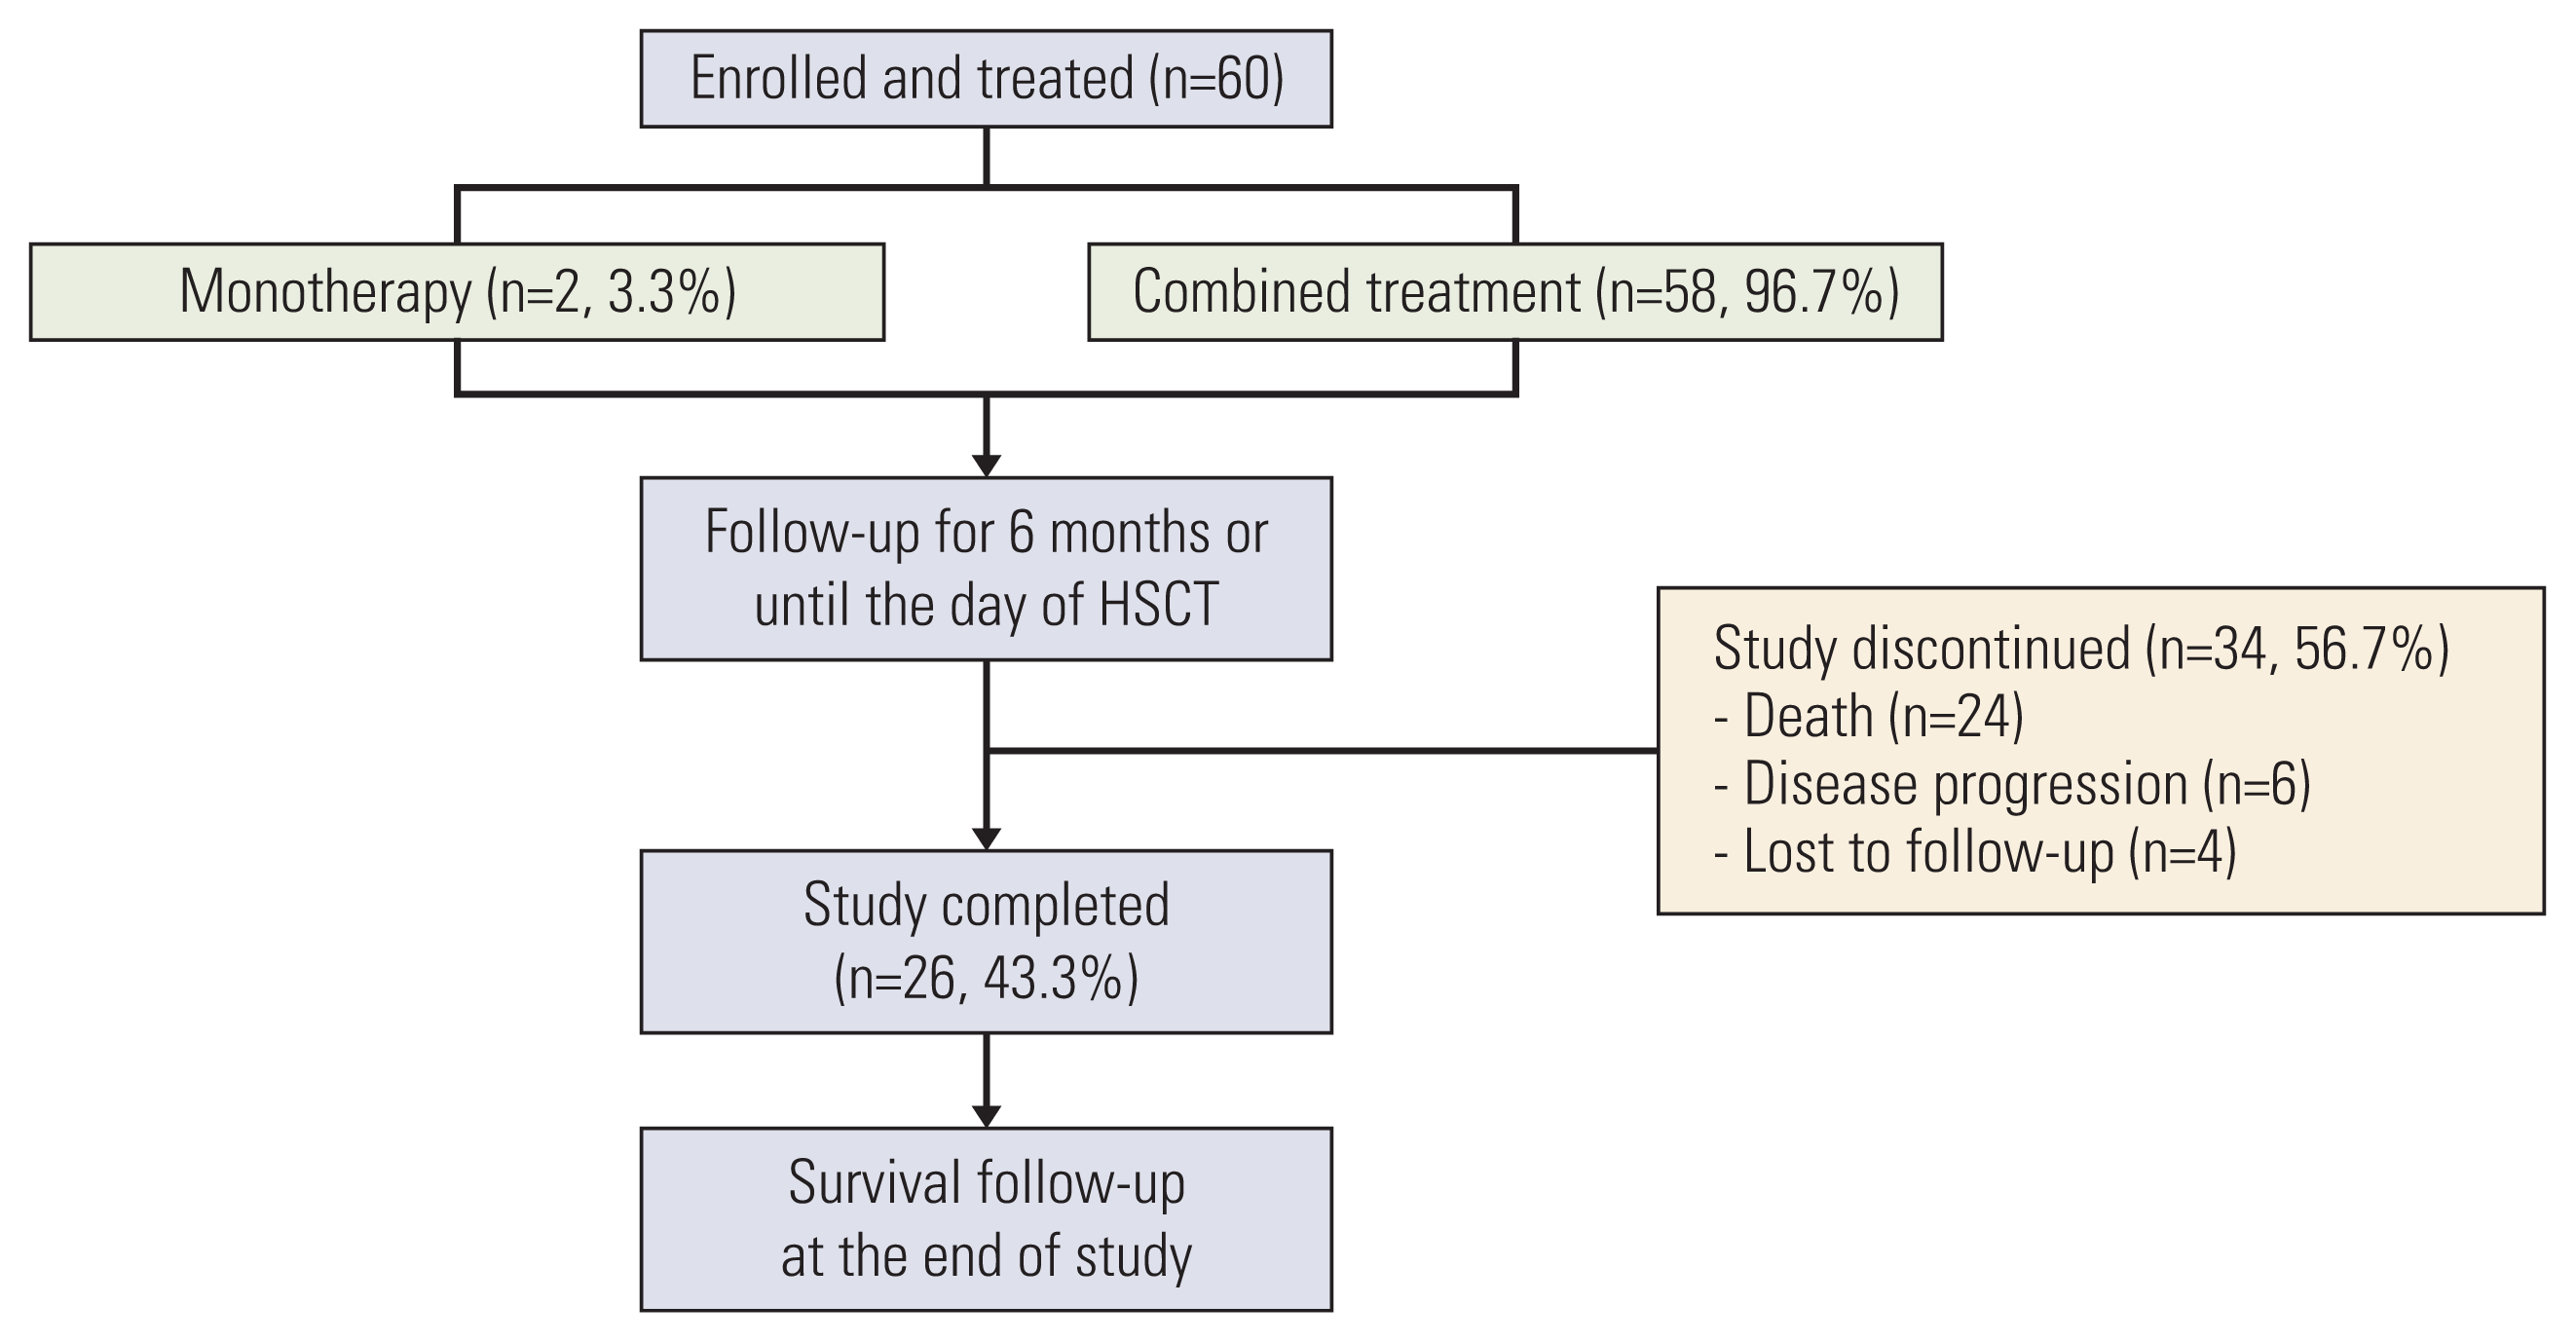
1. Patient disposition and baseline characteristics
Table 1
| Characteristic | Patients with HSCT (n=16) | Patients without HSCT (n=44) | Total (n=60) |
|---|---|---|---|
| Age (yr) | |||
| Median (min-max) | 12.0 (5.0–25.0) | 12.0 (2.0–26.0) | 12.0 (2.0–26.0) |
| Sex | |||
| Male | 7 (43.8) | 30 (68.2) | 37 (61.7) |
| Female | 9 (56.3) | 14 (31.8) | 23 (38.3) |
| Time from initial diagnosis (wk) | |||
| Median (min-max) | 166.4 (12.4–5,333.3) | 116.1 (9.3–1,070.4) | 118.4 (9.3–1,070.4) |
| Time to first relapse from initial diagnosis (wk) | |||
| No. of patients. | 11 | 25 | 36 |
| Median (min-max) | 131.8 (64.3–292.6) | 121.4 (12.7–348.4) | 124.6 (12.7–348.4) |
| Cytogenetic subtype | |||
| Diploid | 4 (25.0) | 7 (15.9) | 11 (18.3) |
| Hypodiploid | 1 (6.3) | 2 (4.6) | 3 (5.0) |
| Hyperdiploid | 4 (25.0) | 7 (15.9) | 11 (18.3) |
| t(9;22) | 0 | 2 (4.6) | 2 (3.3) |
| NA | 3 (18.8) | 9 (20.5) | 12 (20.0) |
| Others | 4 (25.0) | 17 (38.6) | 21 (35.0) |
| Immune subtype | |||
| B lineage | 13 (81.3) | 26 (59.1) | 39 (65.0) |
| T cell | 1 (6.3) | 13 (29.6) | 14 (23.3) |
| Mixed phenotype | 1 (6.3) | 4 (9.1) | 5 (8.3) |
| NA | 1 (6.3) | 1 (2.3) | 2 (3.3) |
| Clinical status of disease at baseline | |||
| First relapse | 4 (25.0) | 9 (20.5) | 13 (21.7) |
| Second relapse | 7 (43.8) | 19 (43.2) | 26 (43.3) |
| Refractorya) | 5 (31.3) | 16 (36.4) | 21 (35.0) |
| Last bone marrow result before study enrollmentb) | |||
| CR | 6 (37.5) | 10 (22.7) | 16 (26.7) |
| CRp | 0 | 3 (6.8) | 3 (5.0) |
| Refractory | 10 (62.5) | 31 (70.5) | 41 (68.3) |
| Relapsed lesions | |||
| Bone marrow | 14 (87.5) | 38 (86.4) | 52 (86.7) |
| NA | 2 (12.5) | 6 (13.6) | 8 (13.3) |
Values are presented as number (%) unless otherwise indicated. Denominator of percentage is the number of patients in each category. Age (yr)=(informed consent date [yyyy])−(birth date [yyyy])+1, if (informed consent date [mm/dd]) < ([birth date (mm/dd)] or (informed consent date [yyyy])−(birth date [yyyy]), if (informed consent date [mm/dd]) ≥ (birth date [mm/dd]). Time from initial diagnosis=(informed consent date [yyyy])−(ALL diagnosis date [yyyy])+1. ALL, acute lymphoblastic leukemia; CR, complete remission; CRp, CR without platelet recovery; HSCT, hematopoietic stem cell transplantation; Max, maximum; Min, minimum; NA, not available.
2. Treatment
3. Effectiveness
Table 2
| Patients with HSCT (n=16) | Patients without HSCT (n=44) | Total (n=60) | |
|---|---|---|---|
| Evaluation results | |||
| CR | 6 (37.5) | 5 (11.4) | 11 (18.3) |
| CRp | 8 (50.0) | 8 (18.2) | 16 (26.7) |
| PR | 0 | 1 (2.3) | 1 (1.7) |
| Refractorya) | 2 (12.5) | 19 (43.2) | 21 (35.0) |
| Missing | 0 | 11 (25.0) | 11 (18.3) |
| Overall remission rateb) | 14 (87.5)d) | 13 (29.6) | 27 (45.0) |
| 95% CI (%) | 61.7–98.5 | 16.1–43.0 | 32.4–57.6 |
| Overall response ratec) | 14 (87.5)d) | 14 (31.8) | 28 (46.7) |
| 95% CI (%) | 61.7–98.5 | 18.1–45.6 | 34.0–59.3 |
Values are presented as number (%) unless otherwise indicated. Denominator of percentage is the number of patients in each group. CI, confidence interval; CR, complete remission; CRp, CR without platelet recovery; HSCT, hematopoietic stem cell transplantation; PR, partial remission.
a) Refractory represents ≥ 3 relapse and/or clinically non-responsive disease according to investigators’ discretion,
b) Overall remission rate (%)=(CR after the last clofarabine administration+CRp after the last clofarabine administration)/(total number of treated patients)×100,
Table 3
| No. | Overall remission ratea) | p-valueb) | Overall response ratec) | p-valueb) | |
|---|---|---|---|---|---|
| Age (yr) | |||||
| ≥ 13 | 28 | 15 (53.6) | 0.212 | 16 (57.1) | 0.128 |
| < 13 | 32 | 12 (37.5) | 12 (37.5) | ||
| Sex | |||||
| Male | 37 | 13 (35.1) | 0.051 | 13 (35.1) | 0.023 |
| Female | 23 | 14 (60.9) | 15 (65.2) | ||
| Clinical status of disease at baseline | |||||
| First relapse | 13 | 5 (38.5) | 0.862 | 6 (46.2) | 0.994 |
| Second relapse | 26 | 12 (46.2) | 12 (46.2) | ||
| Refractory | 21 | 10 (47.6) | 10 (47.6) | ||
| Time to relapse (mo) | |||||
| < 36 | 27 | 8 (29.6) | 0.030 | 9 (33.3) | 0.055 |
| ≥ 36 | 12 | 9 (75.0) | 9 (75.0) | ||
| Refractory | 21 | 10 (47.6) | 10 (47.6) | ||
| Last bone marrow result before study enrollment | |||||
| CR | 16 | 11 (68.8) | 0.061 | 12 (75.0) | 0.022 |
| CRp | 3 | 1 (33.3) | 1 (33.3) | ||
| Refractory | 41 | 15 (36.6) | 15 (36.6) | ||
| Cytogenetic subtype | |||||
| Diploid | 11 | 8 (72.7) | 0.005 | 8 (72.7) | 0.016 |
| Hypodiploid | 3 | 2 (66.7) | 2 (66.7) | ||
| Hyperdiploid | 11 | 5 (45.5) | 5 (45.5) | ||
| t(9;22) | 2 | 0 | 0 | ||
| Others | 21 | 3 (14.3) | 4 (19.1) | ||
| Immune subtype | |||||
| B lineage | 39 | 18 (46.2) | 0.838 | 18 (46.2) | 0.647 |
| T cell | 14 | 5 (35.7) | 5 (35.7) | ||
| Mixed phenotype | 5 | 2 (40.0) | 3 (60.0) | ||
Values are presented as number (%). Denominator of percentage is the number of patients in each group. CR, complete remission; CRp, CR without platelet recovery; PR, partial remission.
4. Safety
Table 4
| Incidence of TEAEsa) | Incidence of ADRsa) | |
|---|---|---|
| Patients with AEs | 60 (100.0) [700] | 50 (83.3) [383] |
| Severity | ||
| Grade 1 | 221 | 107 |
| Grade 2 | 247 | 142 |
| Grade 3 | 193 | 116 |
| Grade 4 | 23 | 11 |
| Grade 5 | 16 | 7 |
| Serious AEs | 37 (61.7) [89] | 21 (35.0) [49] |
| AEs leading to discontinuation | 6 (10.0) [23] | 3 (5.0) [14] |
| AEs leading to death | 14 (23.3) [16] | 6 (10.0) [7] |
Denominator of percentage is the number of patients in each group. Grade 1, mild; grade 2, moderate; grade 3, severe or medically significant but not immediately life-threatening; grade 4, life-threatening consequences; grade 5, death related to AE. ADRs, adverse drug reactions; AE, adverse events; TEAEs, treatment-emergent adverse events.


 PDF
PDF Citation
 Print
Print


 XML Download