Journal List > Cancer Res Treat > v.53(2) > 1154640

Hong, Lee, Lee, Kim, Choi, Jun, and Suh: Trends in Cancer Screening Rates among Korean Men and Women: Results of the Korean National Cancer Screening Survey, 2004–2018

Abstract

Purpose

The Korean National Cancer Screening Survey (KNCSS) is a nationwide annual cross-sectional survey conducted for the past 15 years. This study aimed to report trends in the overall screening rates of both organized and opportunistic cancer screening programs from 2004–2018.

Materials and Methods

KNCSS data were collected using a structured questionnaire. For five major cancers (i.e., stomach, liver, colorectal, breast, and cervical cancer), we evaluated both the lifetime screening rate and the screening rate with recommendations. The study population included men aged 40–74 years and women aged 20–74 years with no cancer histories.

Results

Screening rate with recommendations increased from 2004 annually by 4.4% and 1.5% until 2013 for stomach and liver cancers, respectively, by 4.0% until 2012 for breast cancer, and by 3.6% and 1.2% until 2014 for colorectal and cervical cancers, respectively, followed by nonsignificant trends thereafter. In 2018, screening rates with recommendations for these cancers were 72.8%, 26.2%, 63.1%, 58.4%, and 55.6%, respectively.

Conclusion

Screening rates for the five types of cancer demonstrated a marked increase between 2004 and 2018. However, many recent screening rates have been flattened with nonsignificant trends, and there are lower rates for cervical cancer screening among young age groups. Steady efforts are needed to achieve higher screening participation rates overall, especially for the cervical cancer screening of young women in their 20s.

Introduction

In Korea, cancer is a leading contributor to both mortality and disease burden. In 2016, 229,180 cases were newly diagnosed, and cancer accounted for 27.8% of all deaths [1]. The overall cancer incidence rate increased by 3.6% annually from 1999 to 2011 and then decreased by 3.1% annually from 2011 to 2016. The economic burden imposed by cancer increased from $11,424 to $20,858 million between 2000 and 2010, representing an average annual growth rate of 8.9% [2].
Cancer screening can reduce such burden by the prevention or early detection of cancer, which is an essential element for cancer control. In Korea, both organized and opportunistic cancer screening programs are available; the organized cancer screening program is provided by the government. The National Cancer Screening Program (NCSP) was launched in 1999 to provide Medical Aid beneficiaries with free-of-charge screening for stomach, breast, and cervical cancer [3]. Subsequently, the cancers targeted for NCSP and range of recipients were gradually expanded; finally, since 2004, the NCSP has provided screenings for five types of cancer (i.e., stomach, liver, colorectal, breast, and cervical cancer) to Medical Aid recipients and National Health Insurance beneficiaries in the lower income stratum.
The NCSP utilizes nationally implemented protocols that defined a target population, screening interval, and follow-up strategies (S1 Table). Opportunistic cancer screening programs vary in terms of the cancers screened, the interval between screenings, and the target cancer type, depending on individual decisions or the recommendations of health care providers. In this study, we report trends in overall screening rates associated with both the organized and opportunistic cancer screening programs in Korea.

Materials and Methods

We used the data of the Korean National Cancer Screening Survey (KNCSS), an annual, nationwide, population-based survey of cancer screening rates in Korea, from 2004 to 2018 [4]. To ensure that the survey participants were nationally representative, KNCSS employed a stratified, multistage sampling design based on resident registration population according to geographical area, age, and sex. The methods used for sampling were described in previous studies [3,4].
The data were collected through face-to-face interviews conducted by a professional research agency, except in 2004, when data were collected via computer-assisted telephone interviews. Subjects were recruited through door-to-door contact, and at least three attempts to contact each household were made. One person was selected from each household. All study participants were provided with sufficient explanation and they agreed to participate in the survey.
Our target population, derived from the NCSP protocols in Korea, was composed of cancer-free men and women aged ≥ 40 and ≥ 30 years, respectively, during the years 2004–2018. In addition, from 2014, we also conducted survey about cervical cancer screening in women aged 20–29 years, as the recipients of the national cervical cancer screening program was expanded to women in their age of 20s from 2015. Because they were not eligible for other kinds of cancer screening, those data were only used for cervical cancer screening rates with recommendation, either when calculating them separately (i.e., subgroup analysis by age) or when integrating them with screening rates for women aged ≥ 30 years (i.e. calculating the screening rates, including women in their 20s), from 2014.
The KNCSS explored experience with screening for five types of cancer (i.e., stomach, liver, colorectal, breast, and cervical cancer) and sociodemographic characteristics, including educational level, household income, marital status, residential area, and type of health insurance, using a structured questionnaire. Among the questionnaire, major questions asking the interviewee’s cancer screening experiences provided in Supplementary Material. The questions included were, “Have you ever undergone (cancer type) screening?” and “Which screening method have you experienced?” For the interval between screenings, the question was, “When did you last undergo (cancer type) screening with this method?”
Two types of cancer screening rates were measured in this study. Lifetime screening was defined as ever having undergone a screening test during the lifetime. Meanwhile, screening rate with recommendation category was assigned to participants who had undergone screening tests according to the NCSP procedures and intervals (Table 1). However, for colorectal cancer screening, respondents who underwent colonoscopy, double-contrast barium enema, or fecal occult blood test (FOBT) within 5, 5, and 1 year, respectively, before 2009, and within 10, 5, and 1 year, respectively, after 2009 were considered to have undergone screening with recommendation.
We determined the lifetime screening rates and the screening rates with recommendations for each cancer. The latter rates were also calculated with reference to age and sex. However, the liver cancer screening rate was excluded from subgroup analysis because an inadequate number of individuals in the high-risk group rendered the results unreliable (95% confidence interval was wide). We used the survey sample weights to develop non-biased estimates of the descriptive data. Trends in screening rates of both types were estimated using Joinpoint regression [5], and the results were summarized as an annual percentage change (APC) using a linear model on the raw values of each screening rate. A logarithmic transformation on screening rate was not performed, and a maximum number of two joinpoints was applied in the analysis. However, we adopted 1 joinpoint option for every analysis, for the unity, which showed the best model fit in most of the cases. Statistical analyses were performed using SAS ver. 9.4 (SAS Institute Inc., Cary, NC) and Joinpoint ver. 4.8.0.1 (National Cancer Institute, Bethesda, MD) software.

Results

The distributions of the sociodemographic characteristics of the study respondents for each year are shown in Table 1. The respondents’ demographic factors distributed in accordance with the originally designed sampling rates, however, the composition of age groups changed once in 2014 because women in their 20s were included in the survey. On the other hand, for socioeconomic variables, the respondents’ distributions have changed according to the transition of Korea’s socioeconomic status. From 2004 to 2018, the overall lifetime screening rates and screening rates with recommendations revealed increased results (Table 2). Lifetime screening rate for stomach cancer increased from 52.0% in 2004 to 85.5% in 2018, while for colorectal cancer, increment was from 25.3% in 2004 to 77.0% in 2018, and that for breast cancer increased from 55.9% in 2004 to 83.1% in 2018. Screening rates with recommendations, from 2004 to 2018, showed statistically significant increment until and after the mid-point of that period, followed by nonsignificant trends for each cancer thereafter. It increased 4.38% and 1.51% per year until 2013 for stomach and liver cancers, respectively, along with 3.59% until 2014 for colorectal cancer, 4.05% until 2012 for breast cancer, and 1.21% until 2014 for cervical cancer. The only significant increasing trend throughout the entire period for screening rates with recommendation was observed in colorectal cancer screening by colonoscopy (APC, 2.02% from 2004 to 2010; more pronounced by 2.66% from 2010 to 2018). Meanwhile, screening rates with recommendation for colorectal cancer screening by FOBT initially showed a statistically significant increasing trend (APC, 2.24% from 2004 to 2015), and then showed a more rapid and significant decrease (APC, −4.28% from 2015 to 2018). On the other hand, there was a strain in interpreting liver cancer screening rates and their trends, because the numbers of target population or denominators for liver cancer screening were distinctly small; taking from 0.89% to 5.66% of the entire survey participants in each year (data not shown).
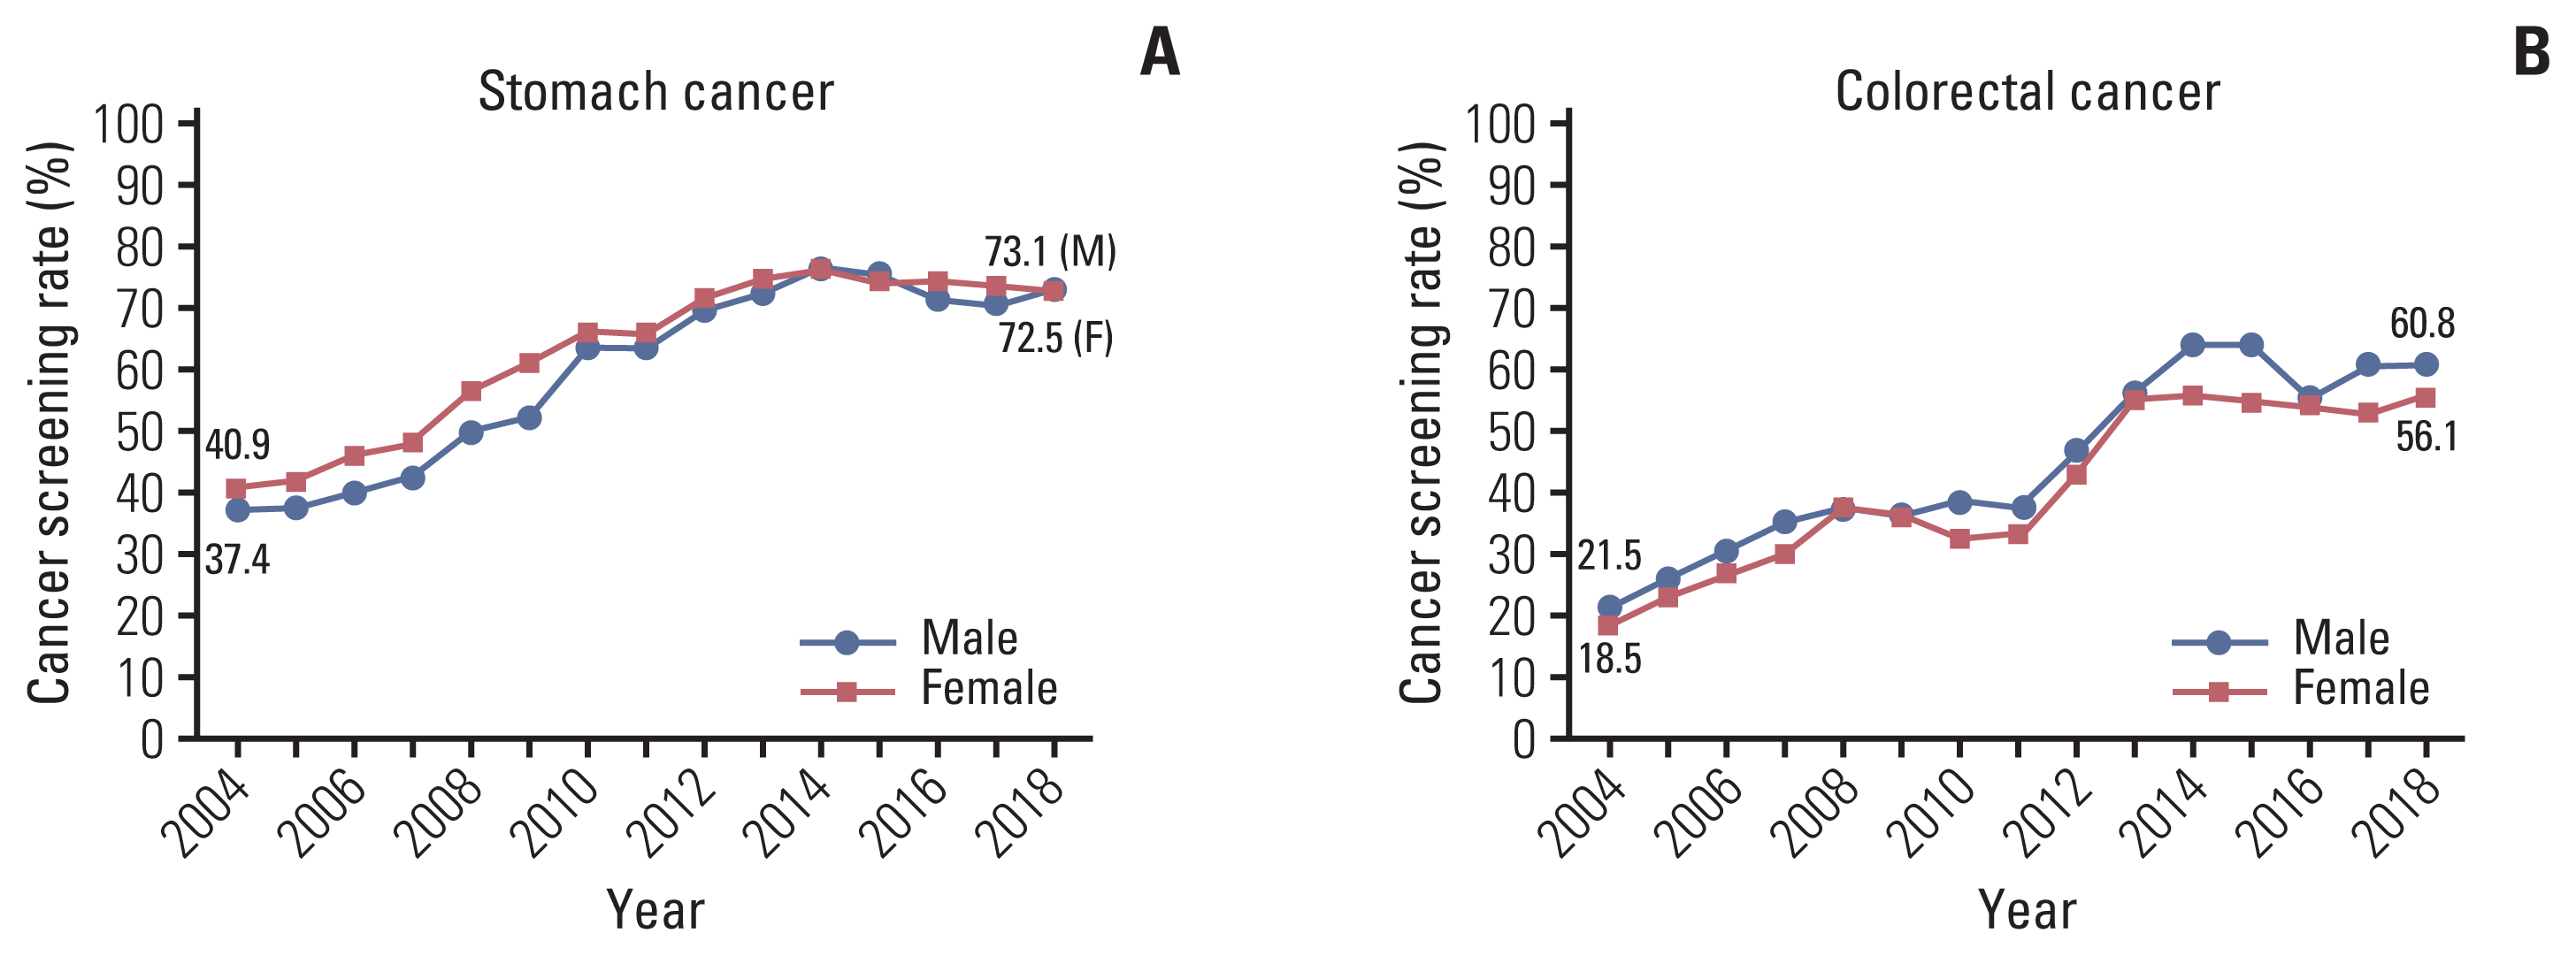
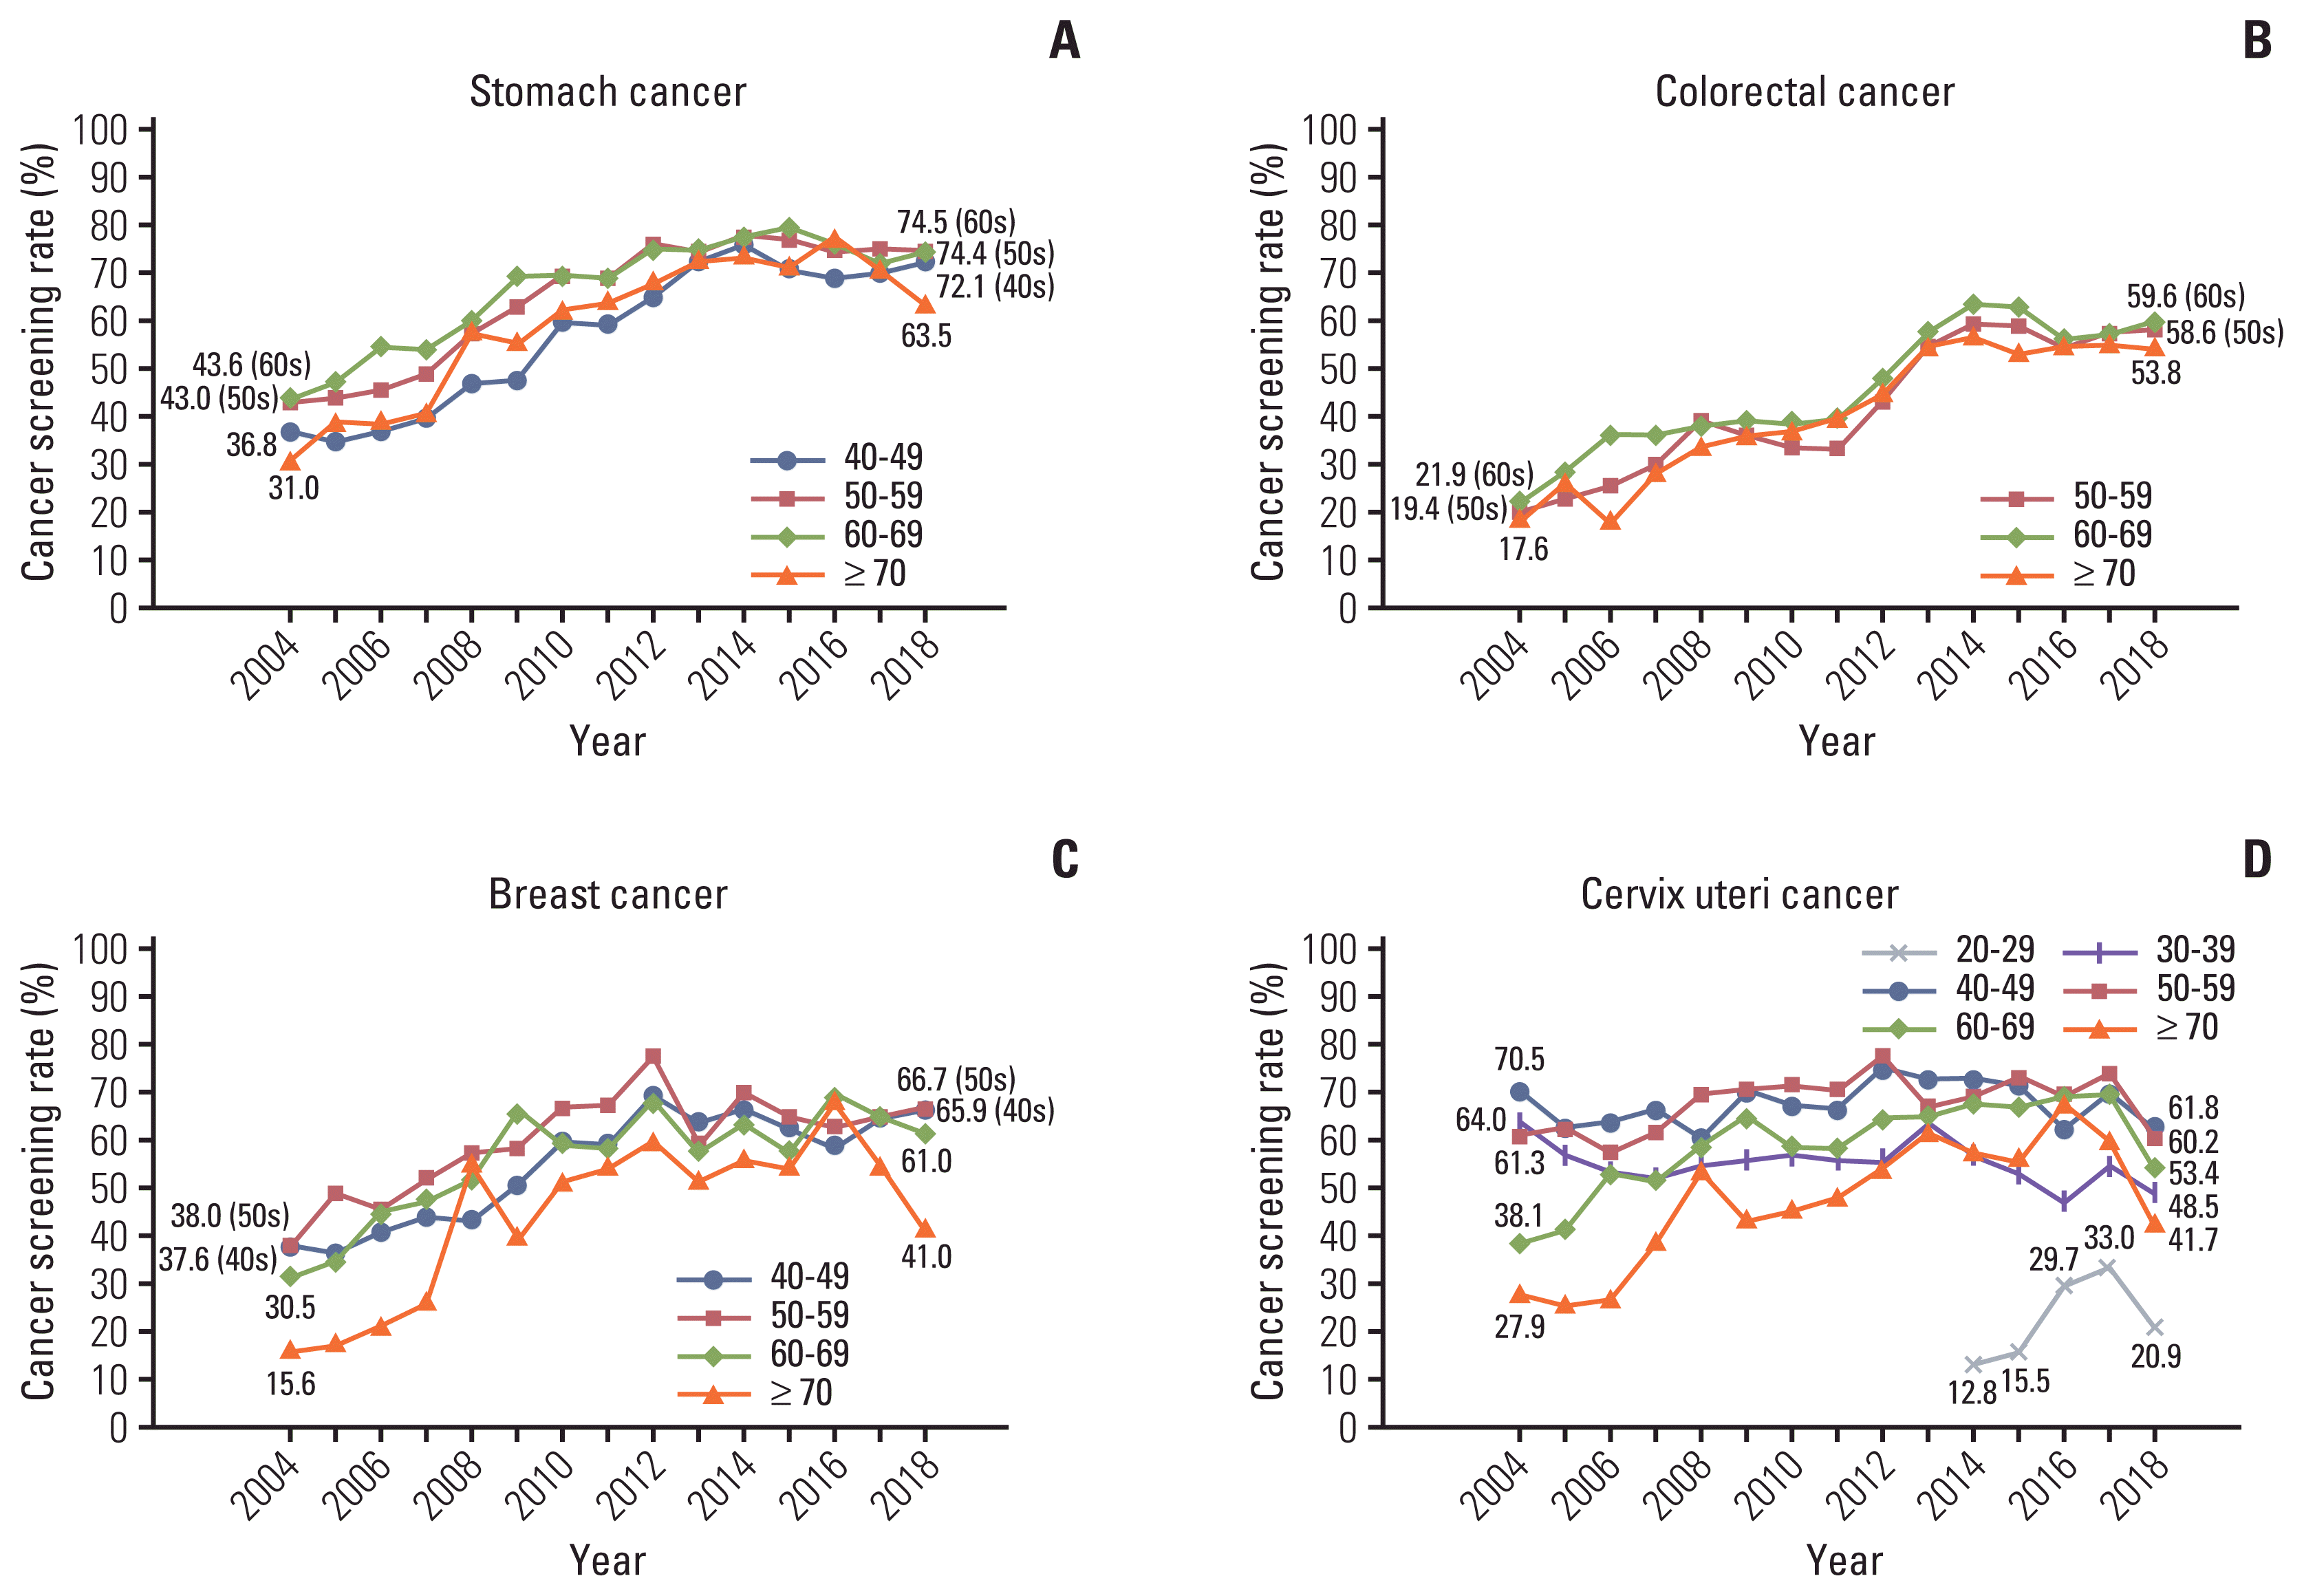
According to sex, there were some differences in screening rates with recommendation for stomach and colorectal cancers (Fig. 1). As a whole, women exhibited higher screening rates than men in stomach cancer screening whereas men revealed higher rates than women in colorectal cancer screening. More rapid and significant increases in screening rates were observed in men compared to women (APC, 4.36% from 2004 to 2014 in men and 4.08% from 2004 to 2013 in women for stomach cancer; 3.71% from 2004 to 2015 in men and 3.34% from 2004 to 2015 in women for colorectal cancer), followed by nonsignificant decreases in both sexes. Fig. 2 presents trends in screening rates with recommendation for each cancer, according to the recipients’ age group. Common to all these cancers, screening rates in younger age groups were relatively lower than other age groups, except for that in 70 years and older people. Specifically, cervical cancer screening rates for women in their 20s, which have been measured since 2014, demonstrated significantly lower rates compared to other age groups. Cervical cancer screening rates for women in their 30s and 40s exhibited a stagnant trend during the incremental periods (nonsignificant APCs, 0.35% from 2004 to 2013 and 0.80% from 2004 to 2014, respectively), in contrast to statistically significant increases during similar periods for every age group for other cancers and for the older age groups for cervical cancer (data not shown).

Discussion

Since 2004, lifetime screening rates and screening rates with recommendations for the five cancers studied have both increased. Lifetime screening rates for breast and stomach cancer have been > 80% since 2012 and 2013, and those for colorectal and cervical cancer have been > 70% for many years. Meanwhile, screening rate with recommendations for stomach cancer has been > 70% since 2012, and those for breast and cervical cancer have been > 60% for many years. However, lifetime screening rates for liver cancer and screening rate with recommendations for liver and colorectal cancer have recorded consistently low values.
Among European countries, England provides nationwide breast and cervical cancer screening. The National Health Service (NHS) Breast Screening Programme funds mammography every 3 years for all women aged 50–70 years. In total, 70.5% of women aged 50–70 years underwent mammography in 2017–2018 [6]. The NHS Cervical Screening Programme uses liquid-based cytology to screen women aged 25–64 years. Those aged 25–49 years are invited to undergo routine screening every 3 years, and those aged 50–64 years every 5 years. In 2017–2018, 71.4% of eligible women were screened adequately within the acceptable period; 69.1% of women aged 25–49 years screened within last the 3.5 years, and 76.2% of women aged 50–64 years screened within last the 5.5 years [7].
In the United States, the National Health Interview Survey conducted by the American Cancer Society showed that the mammographic breast cancer screening rates in women aged ≥ 40 years within the preceding year (for women aged 40–54 years) and within the preceding 2 years (for women aged ≥ 55 years) have changed minimally at around 51% and 65%, respectively, between 2005 and 2015. The proportions of American women aged 21–64 years who reported that they had undergone Pap smear testing for cervical cancer within the past 3 years slightly decreased from 85.4% in 2005 to 81.6% in 2015. Meanwhile, the rates of recent screening using either stool-based tests (FOBT or fecal immunochemical test using a home test kit, within the preceding year) or endoscopy (within preceding 5 or 10 years) among men and women aged ≥ 50 years increased from 46.8% in 2005 to 62.6% in 2015 [8].
Similar to Korea, Japan has had a universal health insurance system since 1961, and the national guidelines are developed by the Japanese Advisory Committee on Cancer Screening [9]. The screening rate for breast cancer (biennial mammography for women ≥ 40 years) has gradually increased since the early 1990s [10]; however, it remains low despite further increase (14.2% in 2007 to 36.9% in 2016) [9,11]. In addition, participation rates in breast and cervical screening programs in younger age groups tend to be much lower than that in older age groups [9,12], a pattern similar to that observed in this study. Cervical cancer screening in Japan is conducted using Pap smear with colposcopy triage every 2 years for women aged ≥ 20 years, and its coverage is increasing with time [13]. For women aged 20–69 years, the coverage rates were 24.5%, 28.7%, 32.7%, and 33.7% in 2007, 2010, 2013, and 2016, respectively [9,11]. Coverage rates for stomach cancer screening via radiography in Japan are relatively higher, compared to other cancers, which reached 46.4% in men and 35.6% in women in 2016 [9,11]. After the Japanese government decided in 2016 to introduce endoscopic screening for stomach cancer as a national program, they are preparing for the introduction and appropriate implementation to achieve acceptable coverage [14]. Similar coverage rates for colon cancer are shown, also with a sex difference: 44.5% in men and 38.5% in women [9,11].
Although there are some differences in screening guidelines or recommendations for each country, cancer screening rates with recommendation in Korea were not much lower than those seen in Europe or the United States and were considerably higher than those seen in Japan. However, continuous efforts should be made to further improve the screening rates through proactive intervention by identifying groups with particularly low screening rates, while simultaneously analyzing the causes of low participation and proffering appropriate solutions for this. In Korea, colorectal cancer screening through FOBT and cervical cancer screening through Pap smear test would be the main subjects of discussion. The former is widely used for colorectal cancer screening in East Asian and South-East Asian countries; however, the low participation rates are problems that need solving in every country [15]. Adopting the use of a home test kit, already available in some countries including the United States, with appropriate methods such as round-mailing and reminders can be considered as selective intervention [1618]. Meanwhile, an alternative method suggested for increasing participation in cervical cancer screening programs is human papillomavirus self-sampling [1921]. We need to closely evaluate the effectiveness of these interventions and their feasibility in the country, and try to implement them for those in need.
The results of this KNCSS study have several implications. In addition to the overall trend of increase, it demonstrated some specific differences in cancer screening rates related to recipients’ demographic characteristics. Particularly, young age groups revealed relatively low screening rates in each cancer type (except for the people in their 70s). This indicates that attention should be paid to adults aged 40–49 years for stomach cancer, 50–59 years for colorectal cancer, women aged 40–49 years for breast cancer, and women aged 20–29, and 30–39 years for cervical cancer. Such finding is consistent with the results reported in the previous studies in Korea [22,23]. Since 2015 or earlier, overall increasing trends in cancer screening rates have been all attenuated in both lifetime screening rate and screening rate with recommendation, for each cancer type and almost all screening methods. However, further improvements can be expected with the introduction and stabilization of new strategies. For cervical cancer, the eligible criteria for NCSP was expanded to women in their 20s in 2016, and screening rates in women aged 20–69 years increased dramatically (twice as before) from that year. Although it has declined again in 2018, the screening trend has to be followed-up through subsequent changes. For colorectal cancer, screening rates with recommendation are on the increase only for colonoscopy. In this regard, for the low screening rates of colorectal cancer screening, it is necessary to consider the implementation of alternative primary test method, i.e., colonoscopy, which is the preferred screening method by the recipients [24]. In case of liver cancer, small sizes of target population and survey sample for cancer screening (i.e., high-risk group for liver cancer) may have resulted in fluctuations in the resulting values.
The KNCSS has explored cancer screening rates for 15 years nationwide. However, the study has some limitations as a research by survey. First, there may be errors derived from the survey process or participants’ self-report, such as immature interview, recording error, false or non-response error, recall bias, and other kinds of errors. However, we conducted the survey with a number of trained and professional interviewers through face-to-face interviews, minimizing errors that may have occurred during the survey process. Moreover, many studies have reported high correlations between the rates derived from chart audits and patient surveys, supporting that self-report data is quite reliable [2527]. Second, although we set up an appropriate sampling methodology and sufficient samples to represent the entire national population, there may be sampling error, leading to discrepancy between the estimates from sample data and the true values from population data. However, this kind of error would have been gradually minimized through our sample size increase. Despite those limitations, our study have some strengths. This nationwide, annual, population-based face-to-face interviewer administered survey has been conducted for a long time since 2004. Therefore, the data were sufficiently representative for investigating trends in cancer screening rates. Furthermore, compared to general real-world, or program data statistics on cancer screening rates, this survey has reported more comprehensive results by including opportunistic, i.e. private screening experiences in addition to the organized programmatic screening experiences. It also generates cancer-specific screening rates for five major cancers, respectively, by calculating the number of each target population as denominators. Still, however, more respondents would be helpful to produce more reliable indicators of cancer screening rates.
Based on the results of consecutive KNCSS studies that investigated trends in the screening rates for five types of cancer (i.e., stomach, liver, colorectal, breast, and cervical cancer) from 2004 to 2018, screening rates revealed overall increased results whereas recent years have shown nonsignificant changes and poor screening rates are still observed in cervical cancer. Continuous efforts are needed to recover the increasing trend and to achieve higher screening rates overall, especially for the cervical cancer screening of young women in their 20s.

Electronic Supplementary Material

Supplementary materials are available at Cancer Research and Treatment website (https://www.e-crt.org).

Notes

Ethical Statement

Our study protocol was approved by the National Cancer Center Institutional Review Board of Korea (approval number: NCC2019-0233). The subjects consented to participate in the survey for public purposes; the requirement for written informed consent was waived.

Author Contributions

Conceived and designed the analysis: Kim Y, Choi, KS, Jun JK, Suh M.

Collected the data: Lee YY, Suh M.

Contributed data or analysis tools: Hong S, Lee YY, Lee J, Kim Y, Choi KS, Suh M.

Performed the analysis: Hong S.

Wrote the paper: Hong S.

Supervision and revision of the manuscript: Jun JK, Suh M.

Conflicts of Interest

Conflicts of interest relevant to this article was not reported.

Acknowledgments

This study was supported by a Grant-in-Aid for Cancer Research and Control from the National Cancer Center of Korea (#1910232-2).

References

1. Jung KW, Won YJ, Kong HJ, Lee ES. Cancer statistics in Korea: incidence, mortality, survival, and prevalence in 2016. Cancer Res Treat. 2019; 51:417–30.
crossref
2. Lee KS, Chang HS, Lee SM, Park EC. Economic burden of cancer in Korea during 2000–2010. Cancer Res Treat. 2015; 47:387–98.
crossref
3. Suh M, Choi KS, Park B, Lee YY, Jun JK, Lee DH, et al. Trends in cancer screening rates among Korean men and women: results of the Korean National Cancer Screening Survey, 2004–2013. Cancer Res Treat. 2016; 48:1–10.
crossref
4. Suh M, Choi KS, Lee YY, Park B, Jun JK. Cancer screening in Korea, 2012: results from the Korean National Cancer Screening Survey. Asian Pac J Cancer Prev. 2013; 14:6459–63.
crossref
5. Surveillance Research Program Joinpoint trend analysis software, version 4801 [Internet]. Bethesda, MD: National Cancer Institute;2020. [cited 2020 May 14]. Available from: https://surveillance.cancer.gov/joinpoint/ .
6. Screening and Immunisations Team, NHS Digital. Breast Screening Programme England, statistics for 2017–18 [Internet]. London: Health and Social Care Information Centre;2019. [cited 2020 Jun 30]. Available from: https://digital.nhs.uk/data-and-information/publications/statistical/breast-screening-programme .
7. Screening and Immunisations Team, NHS Digital. Cervical Screening Programme England, statistics for 2017–18 [Internet]. London: Health and Social Care Information Centre;2018. [cited 2020 Jun 30]. Available from: https://digital.nhs.uk/data-and-information/publications/statistical/cervical-screening-programme .
8. Smith RA, Andrews KS, Brooks D, Fedewa SA, Manassaram-Baptiste D, Saslow D, et al. Cancer screening in the United States, 2018: a review of current American Cancer Society guidelines and current issues in cancer screening. CA Cancer J Clin. 2018; 68:297–316.
crossref
9. Sauvaget C, Nishino Y, Konno R, Tase T, Morimoto T, Hisamichi S. Challenges in breast and cervical cancer control in Japan. Lancet Oncol. 2016; 17:e305–12.
crossref
10. Yoshida M, Kondo K, Tada T. The relation between the cancer screening rate and the cancer mortality rate in Japan. J Med Invest. 2010; 57:251–9.
11. Summary report of comprehensive survey of living conditions 2016 [Internet]. Tokyo: Ministry of Health, Labour and Welfare, Household Statistics Office;2017. [cited 2020 Jun 2]. Available from: https://www.mhlw.go.jp/english/database/db-hss/cslc-report2016.html .
12. Uchida K, Ohashi H, Kinoshita S, Nogi H, Kato K, Toriumi Y, et al. Breast cancer screening and the changing population pyramid of Japan. Breast Cancer. 2015; 22:172–6.
crossref
13. Matsuura Y, Yoshioka M, Nakata A, Haraga M, Hachisuga T, Mori K. Trends in uterine cervical cancer screening at physical health checkups for company employees in Japan. J UOEH. 2019; 41:327–33.
crossref
14. Hamashima C, Goto R. Potential capacity of endoscopic screening for gastric cancer in Japan. Cancer Sci. 2017; 108:101–7.
crossref
15. Sano Y, Byeon JS, Li XB, Wong MC, Chiu HM, Rerknimitr R, et al. Colorectal cancer screening of the general population in East Asia. Dig Endosc. 2016; 28:243–9.
crossref
16. Snijders PJ, Verhoef VM, Arbyn M, Ogilvie G, Minozzi S, Banzi R, et al. High-risk HPV testing on self-sampled versus clinician-collected specimens: a review on the clinical accuracy and impact on population attendance in cervical cancer screening. Int J Cancer. 2013; 132:2223–36.
17. Braz NS, Lorenzi NP, Sorpreso IC, Aguiar LM, Baracat EC, Soares-Junior JM. The acceptability of vaginal smear self-collection for screening for cervical cancer: a systematic review. Clinics (Sao Paulo). 2017; 72:183–7.
crossref
18. Carrasquillo O, Seay J, Amofah A, Pierre L, Alonzo Y, McCann S, et al. HPV Self-sampling for cervical cancer screening among ethnic minority women in South Florida: a randomized trial. J Gen Intern Med. 2018; 33:1077–83.
crossref
19. Jager M, Demb J, Asghar A, Selby K, Mello EM, Heskett KM, et al. Mailed outreach is superior to usual care alone for colorectal cancer screening in the USA: a systematic review and meta-analysis. Dig Dis Sci. 2019; 64:2489–96.
crossref
20. Davis MM, Freeman M, Shannon J, Coronado GD, Stange KC, Guise JM, et al. A systematic review of clinic and community intervention to increase fecal testing for colorectal cancer in rural and low-income populations in the United States: how, what and when? BMC Cancer. 2018; 18:40.
crossref
21. Hong S, Shin HY, Lee B, Hwang NR, Hwang SH, Jun JK. Increase in the colorectal cancer screening rate by a round-mailed fecal immunochemical testing kit and associated factors in underserved regions of Korea: a community-based intervention study. Gut Liver. 2020; 14:323–30.
crossref
22. Shim SH, Kim H, Sohn IS, Hwang HS, Kwon HS, Lee SJ, et al. Nationwide cervical cancer screening in Korea: data from the National Health Insurance Service Cancer Screening Program and National Cancer Screening Program, 2009–2014. J Gynecol Oncol. 2017; 28:e63.
crossref
23. Lee EY, Lee YY, Suh M, Choi E, Mai TTX, Cho H, et al. Socioeconomic inequalities in stomach cancer screening in Korea, 2005–2015: after the introduction of the National Cancer Screening Program. Yonsei Med J. 2018; 59:923–9.
crossref
24. Cho YH, Kim DH, Cha JM, Jeen YT, Moon JS, Kim JO, et al. Patients’ preferences for primary colorectal cancer screening: a survey of the National Colorectal Cancer Screening Program in Korea. Gut Liver. 2017; 11:821–7.
crossref
25. Tsuruda KM, Sagstad S, Sebuodegard S, Hofvind S. Validity and reliability of self-reported health indicators among women attending organized mammographic screening. Scand J Public Health. 2018; 46:744–51.
crossref
26. Caplan LS, McQueen DV, Qualters JR, Leff M, Garrett C, Calonge N. Validity of women’s self-reports of cancer screening test utilization in a managed care population. Cancer Epidemiol Biomarkers Prev. 2003; 12:1182–7.
27. Baier M, Calonge N, Cutter G, McClatchey M, Schoentgen S, Hines S, et al. Validity of self-reported colorectal cancer screening behavior. Cancer Epidemiol Biomarkers Prev. 2000; 9:229–32.

Fig. 1
Trends in cancer screening rates with recommendation by sex, from 2004–2018. (A) Stomach cancer. (B) Colorectal cancer.
crt-2020-263f1.gif
Fig. 2
Trends in cancer screening rates with recommendation by age group, from 2004–2018. (A) Stomach cancer. (B) Colorectal cancer. (C) Breast cancer. (D) Cervix uteri cancer.
crt-2020-263f2.gif
Table 1
Distributions (%) of the sociodemographic characteristics of the respondents according to the Korean National Cancer Screening Survey (KNCSS), 2004–2018
Survey year
2004 2005 2006 2007 2008 2009 2010 2011 2012 2013 2014 2015 2016 2017 2018
Total numbers of the respondents 3,592 2,028 2,030 2,021 2,038 2,000 4,056 4,100 4,140 4,100 4,500 4,500 4,500 4,500 4,500
Sex
 Male 42.4 41.0 40.2 39.4 40.6 41.0 41.4 41.9 42.0 42.3 38.4 38.4 38.4 38.6 38.7
 Female 57.6 59.0 59.8 60.6 59.4 59.1 58.6 58.1 58.0 57.7 61.6 61.6 61.6 61.4 61.3
Age (yr)a)
 20–29 - - - - - - - - - - 11.1 11.1 11.1 11.1 11.1
 30–39 14.1 12.0 17.6 17.8 17.7 17.0 15.9 15.5 15.3 14.4 12.4 12.4 11.8 11.5 11.2
 40–49 35.9 41.1 34.6 34.8 35.5 35.6 34.9 33.7 33.5 33.0 29.3 29.3 28.0 27.5 27.1
 50–59 22.7 28.6 21.8 21.6 24.7 25.2 27.3 28.5 28.7 29.8 27.0 27.0 26.7 26.8 26.8
 60–69 17.3 15.6 19.1 21.9 16.4 16.4 16.8 16.1 16.2 16.8 15.2 15.2 16.8 17.4 18.1
 ≥ 70 10.2 2.7 6.9 3.9 5.8 5.9 5.2 6.2 6.4 6.0 4.9 4.9 5.6 5.7 5.8
Education (yr)
 ≤ 8 25.8 16.4 20.9 18.2 13.6 15.1 8.1 8.2 9.7 5.2 5.6 4.5 3.4 3.9 3.3
 9–11 15.6 16.1 15.1 14.3 16.6 11.3 10.9 10.6 8.7 7.2 8.2 7.7 5.6 8.6 7.5
 12–15 34.3 47.6 44.7 46.3 46.6 46.8 52.1 52.5 50.6 54.1 54.4 51.9 50.3 48.3 46.6
 ≥ 16 22.6 18.5 17.6 19.1 20.7 24.9 28.8 28.7 30.9 33.5 31.8 35.9 40.7 39.2 42.7
Monthly household incomeb) ($)c)
 ≤ 999 25.3 11.4 14.1 10.0 9.3 9.4 4.6 4.5 4.6 2.4 2.4 2.2 2.3 2.5 1.3
 1,000–2,999 39.0 57.1 53.1 50.5 48.8 45.0 37.6 37.8 33.3 22.5 21.0 20.0 20.4 18.2 20.0
 ≥ 3,000 18.8 29.7 29.9 38.7 40.3 44.5 57.7 57.7 62.0 75.1 76.6 77.8 77.2 79.3 78.7
Marital status
 Married 88.2 92.8 89.6 89.8 90.3 90.2 91.5 91.5 94.2 91.8 81.9 82.4 82.2 82.3 82.6
 Not married 1.6 2.1 2.2 2.8 2.5 3.6 3.0 3.1 2.3 2.5 12.8 13.3 13.3 14.9 14.1
 Othersd) 9.5 5.1 8.3 7.4 7.2 6.3 5.5 5.5 3.6 5.7 5.3 4.3 4.5 2.8 3.3
Residential area
 Metropolitan 46.8 47.4 47.4 47.5 46.5 46.6 44.3 45.2 44.4 44.3 45.1 46.3 44.6 45.5 44.8
 Urban 53.2e) 39.8 40.5 40.3 44.2 44.0 42.2 41.6 36.3 42.0 47.6 47.7 42.8 44.2 43.3
 Rural 12.7 12.1 12.2 9.3 9.4 13.5 13.1 19.4 13.6 7.2 6.0 12.6 10.3 11.9
Health insurance typeb)
 National Health Insurance 90.8 95.8 94.5 96.7 95.9 95.3 96.5 96.7 98.3 96.9 97.9 99.3 99.1 99.1 98.4
 Medical Aid Program 6.0 4.2 4.2 3.2 3.8 4.3 3.5 3.3 1.7 3.1 2.1 0.7 0.9 0.9 1.6

a) Restricted to women aged 20–29 years and 30–39 years,

b) Some columns do not sum to 100% because of missing data,

c) 1 USD=1,000 KWN,

d) Others: divorced or separated,

e) The 2004 question related to residential area did not distinguish between urban and rural areas.

Table 2
Cancer screening rates for five major cancers in Korea, 2004–2018
Survey year Trend 1 Trend 2


2004 2005 2006 2007 2008 2009 2010 2011 2012 2013 2014 2015 2016 2017 2018 APC (year) APC (year)
Lifetime screening rate (%)a)

 Stomach 52.0 48.5 53.5 55.3 65.0 65.1 76.7 76.2 77.9 80.0 83.4 83.0 85.2 84.0 85.5 4.61* (’04–’11) 1.03* (’11–’18)

 Liver 31.8 47.7 58.3 57.6 64.8 81.3 54.2 54.3 69.9 49.3 48.1 61.2 51.9 74.9 55.7 13.76 (’04–’06) −0.10 (’06–’18)

 Colorectal 25.3 27.9 34.0 40.7 50.4 48.1 57.1 56.1 65.8 70.3 75.6 77.1 76.7 75.7 77.0 5.11* (’04–’14) 0.29 (’14–’18)

 Breast 55.9 57.4 60.2 66.4 72.7 78.1 79.5 79.0 82.9 83.1 85.8 84.6 81.3 86.2 83.1 4.51* (’04–’10) 0.54 (’10–’18)

 Cervical 76.8 74.0 68.0 73.6 74.4 76.1 75.0 74.8 77.1 76.2 74.6 76.2 72.7 76.5 66.6 0.29 (’04–’16) −4.02 (’16–’18)

Screening rates with recommendations (%)b)

 Stomachc) 39.2 39.4 43.3 45.6 53.5 56.9 65.1 64.6 70.9 73.6 76.7 74.8 73.0 72.2 72.8 4.38* (’04–’13) −0.47 (’13–’18)

  Upper endoscopy 32.4 32.9 33.5 37.8 44.8 49.3 58.9 58.1 63.3 64.4 67.4 64.7 64.8 64.3 64.7 4.69* (’04–’12) 0.01 (’12–’18)

  UGI series 13.0 13.1 15.2 20.4 21.1 19.5 24.9 25.3 26.4 24.9 21.9 24.6 24.5 28.5 24.9 2.10* (’04–’10) 0.07 (’10–’18)

 Liverd) 20.0 16.3 16.5 22.7 19.7 31.3 22.9 22.9 21.5 33.6 25.2 28.1 27.7 34.5 26.2 1.51* (’04–’13) 0.07 (’13–’18)

 Colorectale) 19.9 25.4 29.4 34.1 37.9 36.7 35.5 35.3 44.7 55.6 60.1 59.5 54.6 56.8 58.4 3.59* (’04–’14) 0.68 (’14–’18)

  Colonoscopy 14.4 12.4 16.8 19.5 19.1 23.4 23.3 23.6 30.1 35.2 37.3 38.5 40.0 40.6 45.4 2.02* (’04–’10) 2.66* (’10–’18)

  DCBE 2.8 4.1 5.3 8.7 7.0 6.1 6.1 6.0 3.8 7.0 4.7 4.2 6.9 8.2 7.9 −0.07 (’04–’15) 0.97 (’15–’18)

  FOBT 3.8 7.2 13.6 20.2 20.9 19.0 25.9 25.0 29.6 27.6 29.1 30.6 25.9 33.5 20.0 2.24* (’04–’15) −4.28* (’15–’18)

 Breastf) 33.2 38.4 40.6 45.8 49.3 55.2 61.6 60.4 70.9 59.7 66.0 61.2 62.9 63.6 63.1 4.05* (’04–’12) −0.75 (’12–’18)

 Cervicalg) 58.3 57.0 54.9 57.0 59.9 63.9 62.9 62.4 67.9 67.0 66.1 65.6 62.1 66.8 55.6 1.21* (’04–’14) −2.07 (’14–’18)

56.6h) 56.6h) 56.3h) 60.7h) 49.3h) −2.45h) (’14–’18)

APC, annual percentage change; DCBE, double-contrast barium enema; FOBT, fecal occult blood test; UGI, upper gastrointestinal.

* Significantly different from zero (p < 0.05).

a) Lifetime screening rate was defined as the proportion of respondents who ever underwent the screening test(s),

b) Screening rate with recommendation was defined as the proportion of respondents who fulfilled the screening recommendation criteria among the respondents in the targeted age group for the relevant cancer,

c) Respondents who had last undergone upper endoscopy or UGI series screening within 2 years, among men and women aged ≥ 40 years,

d) Respondents who had last undergone screening with abdominal ultrasonography and serum α-fetoprotein within 6 months, among men and women aged ≥ 40 years who were at high risk for liver cancer (i.e., those with hepatitis B virus surface antigen (+), hepatitis C virus antibody (+), or liver cirrhosis),

e) Respondents who had last undergone screening with colonoscopy, DCBE, or FOBT within 5, 5, and 1 year, respectively, before 2009, and within 10, 5, and 1 year, respectively, after 2009, among men and women aged ≥ 50 years,

f) Respondents who had last undergone screening with mammography within 2 years, among women aged ≥ 40 years,

g) Respondents who had last undergone screening with conventional cytology within 2 years,

h) among women aged ≥ 30 years, ≥ 20 years.

TOOLS
Similar articles