

 PDF
PDF Citation
 Print
Print


Introduction
Activation and expansion of tumor-reactive T-cells population is crucial for destruction and eradication of tumor cells. The activation of tumor-reactive T cells requires additional costimulatory signals provided by antigen-presenting cells (APCs) such as dendritic cells (DCs), along with the binding of T-cell receptors (TCRs) to cognate peptide-MHC (pMHC) complexes [1,2]. Numerous studies have shown that DCs are efficient cellular adjuvants that express high levels of MHC molecules and costimulatory ligands capable of inducing antigen-reactive T-cell responses, and genetically modification with immunostimulatory molecules, such as additional costimulatory ligands CD70, CD40L, and FLT3L, elicited enhanced T-cell responses in vitro and in vivo[3-5]. However, though DC-based cellular vaccines have been proven to be safe and immunogenic in cancer patients, DCs are present in limited amounts in human peripheral blood cells, and it is difficult to obtain cells sufficient for clinical applications, making it difficult to apply genetic modifications for use as a cell adjuvant [6,7].
For some time, numerous groups including us have explored to identify reliable autologous APC sources as an alternative for DC-based immunotherapy. Several studies have demonstrated that ex vivo–activated B cells using inflammatory cytokines, CD40L, and Toll-like receptor ligands possess a great ability to prime and expand antigen-specific T cells, resulting in in vivo therapeutic antitumor immunity [8-10]. In other reports, B cells genetically modified to express the costimulatory molecules, and B cells loaded with α-galactosylceramide have synergistically amplified T-cell proliferation as efficiently as DCs in vitro and induced a wide range of adaptive immunity against tumor cells [11,12]. Furthermore, ex vivo–activated γδ T cells have been proposed as an alternative APC possessing efficient antigen-presenting capabilities that subsequently lead to effective antitumor immunity [13]. CD4 T cells have also been achieved as promising alternative APCs capable of presenting antigenic epitopes to naïve cells, evoking functional memory CD8 T-cell responses [14-16].
It is evident that naïve T-cell priming and activation depend in great part on costimulatory signals derived from binding to their ligands expressed on APCs, along with interaction of TCRs and the pMHC complexes [1,17]. Manipulation of costimulatory ligands on cells has been shown to confer immune-stimulatory function to further enhance and extend the activation of T cells against subsequent tumor challenge [18,19]. We previously reported that the transient expression of ex vivo transcribed CD80 and 4-1BBL RNA on CD4 T-cells augments their APC function, resulting in significant therapeutic antitumor effects [16]. In this study, we evaluated the applicability of genetically modified CD8 T cells with costimulatory ligands CD70, CD80, OX40L, and 4-1BBL using recombinant retroviruses to serve as an alternative source of autologous APCs. Our results showed that sustained expression of costimulatory molecules can enhance APC function, and the results from mouse tumor models demonstrate the higher efficiency of CD8 T cells endowed with costimulatory CD70 in inducing effective antigen-specific CD8 T-cell responses.
Go to : 
Materials and Methods
1. Mice and cell lines
Female C57BL/6 (B6) mice, aged 6 to 8 weeks, were purchased from Orient Bio (Seongnam, Korea). B6.Cg (Pmel-1) congenic (CD90.1) transgenic mice were obtained from Jackson Laboratories (Sacramento, CA), and bred in our animal facilities under specific pathogen-free conditions. Murine EL4 and B16F10 melanoma cell lines were obtained from the American Type Culture Collection (Manassas, VA), and PlatE retroviral packaging cells were purchased from Cell Biolabs (San Diego, CA). All cell lines were cultured as recommended by the provider.
2. Peptides, antibodies, and reagents
Synthetic peptides representing the CD8 T-cell epitopes Trp2180 (SVYDFFVWL), hgp10025 (KVPRNQDWL), mgp10025 (EGSRNQDWL), Trp1455 (TAPDNLGYA), the heteroclitic analog Trp1455/9M (TAPDNLGYM), and Ova55 (KVVRFDKL) were purchased > 80% pure from A&A Labs. Monoclonal anti-mouse CD40 (FGK45.5) and anti-4.1BB/CD137 (2A) were prepared from hybridoma culture supernatants. Other antibodies (Abs) for in vivo use in mice, anti-OX40/CD134 (OX86), anti–programmed death-ligand 1 (PD-L1; 10F.9G2), anti-CD8 (2.43), anti-CD4 (GK1.5), and anti-NK1.1 (PK-136) were purchased from BioXCell (West Lebanon, USA). High molecular weight poly-IC was purchased from Invivogen (San Diego, CA), and recombinant cytokines were purchased from PeproTech (Rocky Hill, NJ).
3. Production of recombinant retroviruses encoding costimulatory ligands
The cDNAs for mouse CD70, CD80, OX40L, and 4-1BBL were obtained from total RNA extracted from matured DCs and were amplified by reverse transcription–polymerase chain reaction. The PCR products were cloned into the retroviral vector pMP71with NotΙand EcoRΙsites, and sequenced to determine the possible Taq polymerase errors. For generation of recombinant retroviruses encoding the costimulatory ligands, 5×10⁶ Plat-E cells were seeded in a 100-mm culture plate coated with 5 μg/mL of poly-L-lysine (Sigma, St. Louis, MO). Twenty hours later, 12 μg cloned pMP71 plasmid and retrovirus packaging plasmids (6.3 μg pCL-Eco) were simultaneously transfected into Plat-E cells using lipofectamine2000 (Invitrogen, Carlsbad, CA), following the manufacturer’s instructions. Two days later, the recombinant retroviruses were harvested and titrated into 293T cells, which were then used for the transduction experiments.
4. Transduction of recombinant retroviruses encoding costimulatory ligands into in vitro–activated T cells
CD8 T cells were obtained using MACS anti-CD8 microbeads (Miltenyi, Auburn, CA). For in vitro pre-activation, CD8 T cells were co-cultured at 2.5×10⁵ cells per well in 96well plates using T-Cell Activation/Expansion Kit (Miltenyi) in the presence of 100 IU/mL human interleukin 2 (hIL-2). Eight hours later, the supernatant was discarded, followed by addition of recombinant retroviruses encoding costimulatory ligands individually (mulltiplicity of infection=0.5). CD8 T cells transduced with GFP were referred as mock-control (GFP-T). Cells were centrifuged at 2,500 rpm for 1 hour at 25°C in the presence of 8 μg/mL polybrene (Sigma), and replaced with the above-described culture medium containing a 10 μg/mL peptide(s). Sixteen hours later (overnight), genetically modified and antigen-loaded CD8 T cells obtained were used for vaccination.
5. In vitro proliferation assays
Pmel-1 T cells were labeled with carboxyfluorescein succinimidyl ester (CFSE; Molecular Probes, Eugene, OR) at a final concentration of 5 μM for 15 minutes. For in vitro proliferation, 2×10⁵ Pmel-1 T cells were co-cultured with 4×10⁴ CD8 T cells expressing indicated costimulatory ligands that were irradiated 1,300 rad. After 3 days, cells were stained with CD90.1 (for Pmel-1 cells) and analyzed using flow cytometry. Cell proliferation was calculated using the Proliferation Wizard Model of Modifit LT software (Verity Software House, Topsham, ME).
6. Immunization
The mice were immunized intravenously with 2×10⁶ peptide-loaded CD8 T cells that were modified to express additional costimulatory ligands, as indicated. In some instances, the mice received three booster immunizations every 4 days. Some mice were immunized intravenously with 2×10⁶ DCs that were pulsed with 10 μg/mL peptide for 16 hours for comparison. DCs were prepared as described previously [3]. Variously conditioned CD8 T cells and DCs were mixed with 10 μg poly-IC prior to injection, and 7 days later mice received an intravenous TriVax-boost immunization consisting of 150 μg synthetic peptide(s), 50 μg poly-IC, and 100 μg anti-CD40 Abs. In adoptive cell transfer (ACT) setting, mice were injected intravenously with 5×10⁶ splenocytes from naïve Pmel-1 mice, and vaccinated one day after ACT. For PD-L1 blockade, anti–PD-L1 Abs were administered intraperitoneally (200 μg/dose) on days +1 and +3 after each immunization (prime and boost).
7. Evaluation of immune responses
For measuring antigen-specific CD8 T-cell responses, tumor-infiltrating lymphocytes or splenocytes were incubated with 1 μg/mL peptide and 1 μg/mL GolgiPlug (BD Bioscience, San Diego, CA) at 37°C. After 6 hours, the cells were stained for intracellular interferon γ (IFNγ) using fluorescence-conjugated antibodies against MHC class II, CD8a, and IFNγ, as per the directions provided by the vendor (BD Bioscience). For CD107a/b mobilization shift assay, 2.5 μg/mL of fluorescence-conjugated anti-CD107a and CD107b antibodies were added at the beginning of the stimulation period. For the in vitro T-cell recognition, IFNγ-EliSpot assays (Millipore, Burlington, MA) were performed using freshly isolated CD8 T cells (Miltenyi) from the spleen. Peptidepulsed or un-pulsed EL4 cells were used as targets cells.
8. Evaluation of antitumor effects
To assess the therapeutic effects, mice were inoculated subcutaneously with 1×10⁵ B16 cells in the rear flank; the first immunization, consisting of 2×10⁶ appropriate peptide-loaded CD8 T cells expressing indicated costimulatory ligands, was administered intravenously 3 or 7 days later. Seven days later, the mice received identical CD8 T cells or a TriVax booster immunization as indicated. For in vivo depletion, each mouse received intraperitoneal administrations of 200 μg Abs against NK1.1, CD4, and CD8 on days -3 and -1 before the prime-boost immunizations. Depletions were confirmed with blood samples using flow cytometry (data not shown). Tumor growth in individual tagged mice was monitored every 3-4 days by measuring two opposing diameters with a set of calipers. Mice were euthanized when the tumor area reached > 400 mm2. Results are presented as mean tumor size (area in mm2)±standard deviation for every treatment group at various time points until the termination of the experiment.
9. Single-cell preparation
B16 tumors were dissected and chopped into 2-5 mm sizes and incubated with 300 μg/mL collagenase-D, 20 μg/mL hyaluronidase, and DNase-I (Sigma-Aldrich). After 1 hour, the tissues were dissociated using the gentleMACS Dissociator (Miltenyi) and filtered using 70-μm nylon mesh. Intracellular co-staining of Foxp3 was conducted as per the instructions provided by vendor (eBioscience, San Diego, CA).
10. Statistical analyses
Statistical significance to assess the numbers of antigen-specific CD8 T cells was determined by unpaired Student’s t test. Tumor sizes between two populations throughout time were analyzed for significance using 2-way ANOVA test. The results are representative of data obtained from at least two independent experiments. All analyses and graphs employed Prism 5.01 software (GraphPad, San Diego, CA).
11. Ethical statement
All animal research was conducted in accordance with our institutional animal care and use committee guidelines.
Go to :
Results
1. Induction of antigen-specific CD8 T cell responses with genetically modified CD8 T cell
To express the costimulatory ligands, T cells were transduced with recombinant retroviruses encoding CD70, CD80, OX40L, and 4-1BBL (hereafter referred to as CD70-T, CD80-T, OX40L-T, and 4-1BBL-T cells, respectively), and surface expression of the costimulatory ligands on CD8 T cells and cell viability after transduction was analyzed. Phenotypic analysis of ex vivo–activated CD8 T cells was also examined for comparison, exhibiting that all costimulatory ligands were unaffected (data not shown). In vitro transduction efficiency of the individual retroviruses revealed that the levels of the costimulatory ligands expression on CD8 T cells were subsequently increased, and all modified CD8 T cells were viable after transduction (Fig. 1A and B). Next, we evaluated the effector T-cell stimulatory functionality of genetically modified CD8 T cells as an APC; CFSE-labeled Pmel-1 T cells, which recognize the mgp10025 (EGSRNQDWL), were co-cultured with variously conditioned T cells after pulsing with heteroclitic hgp10025 (KVPRNDQWL) peptide. As shown in Fig. 1C, Pmel-1 T cells cultured with modified CD8 T cells revealed higher cell proliferation index compared with that of mock-GFP-T. Of these, CD70-T exhibited similar level of cell proliferation of Pmel-1 T cells as DCs. Next, we assessed whether CD8 T cells modified to express additional costimulatory ligands can induce antigen-specific CD8 T-cell responses in vivo, the mice received three-identical but variously conditioned CD8 T-cell vaccinations, and the functional activity of freshly isolated CD8 T cells was evaluated. CD70-T and 4-1BBL-T vaccination generated higher number of antigen-specific IFNγ-producing CD8 T cells with lytic functionality (CD107a/b mobilization) in comparison to that generated by other conditioned CD8 T cells (Fig. 1D). However, as shown in Fig. 1E, only the freshly isolated CD8 T cells from CD70-T-vaccinated mice displayed high recognition activity against peptide-pulsed target (EL4/Trp1455) and B16 tumor cells, suggesting that CD70-T vaccination is as efficient as DC-based vaccination in inducing antigen-specific CD8 T-cell responses. Subsequently, we evaluated in vivo therapeutic antitumor effects of the conditioned T-cell vaccination toward 3-day–established B16 melanoma. As shown in Fig. 1F, GFP-T and 4-1BBL-T-cell vaccination demonstrated no therapeutic benefits, whereas CD70-T vaccination had a substantially higher antitumor effects as in DC-based vaccinated group.
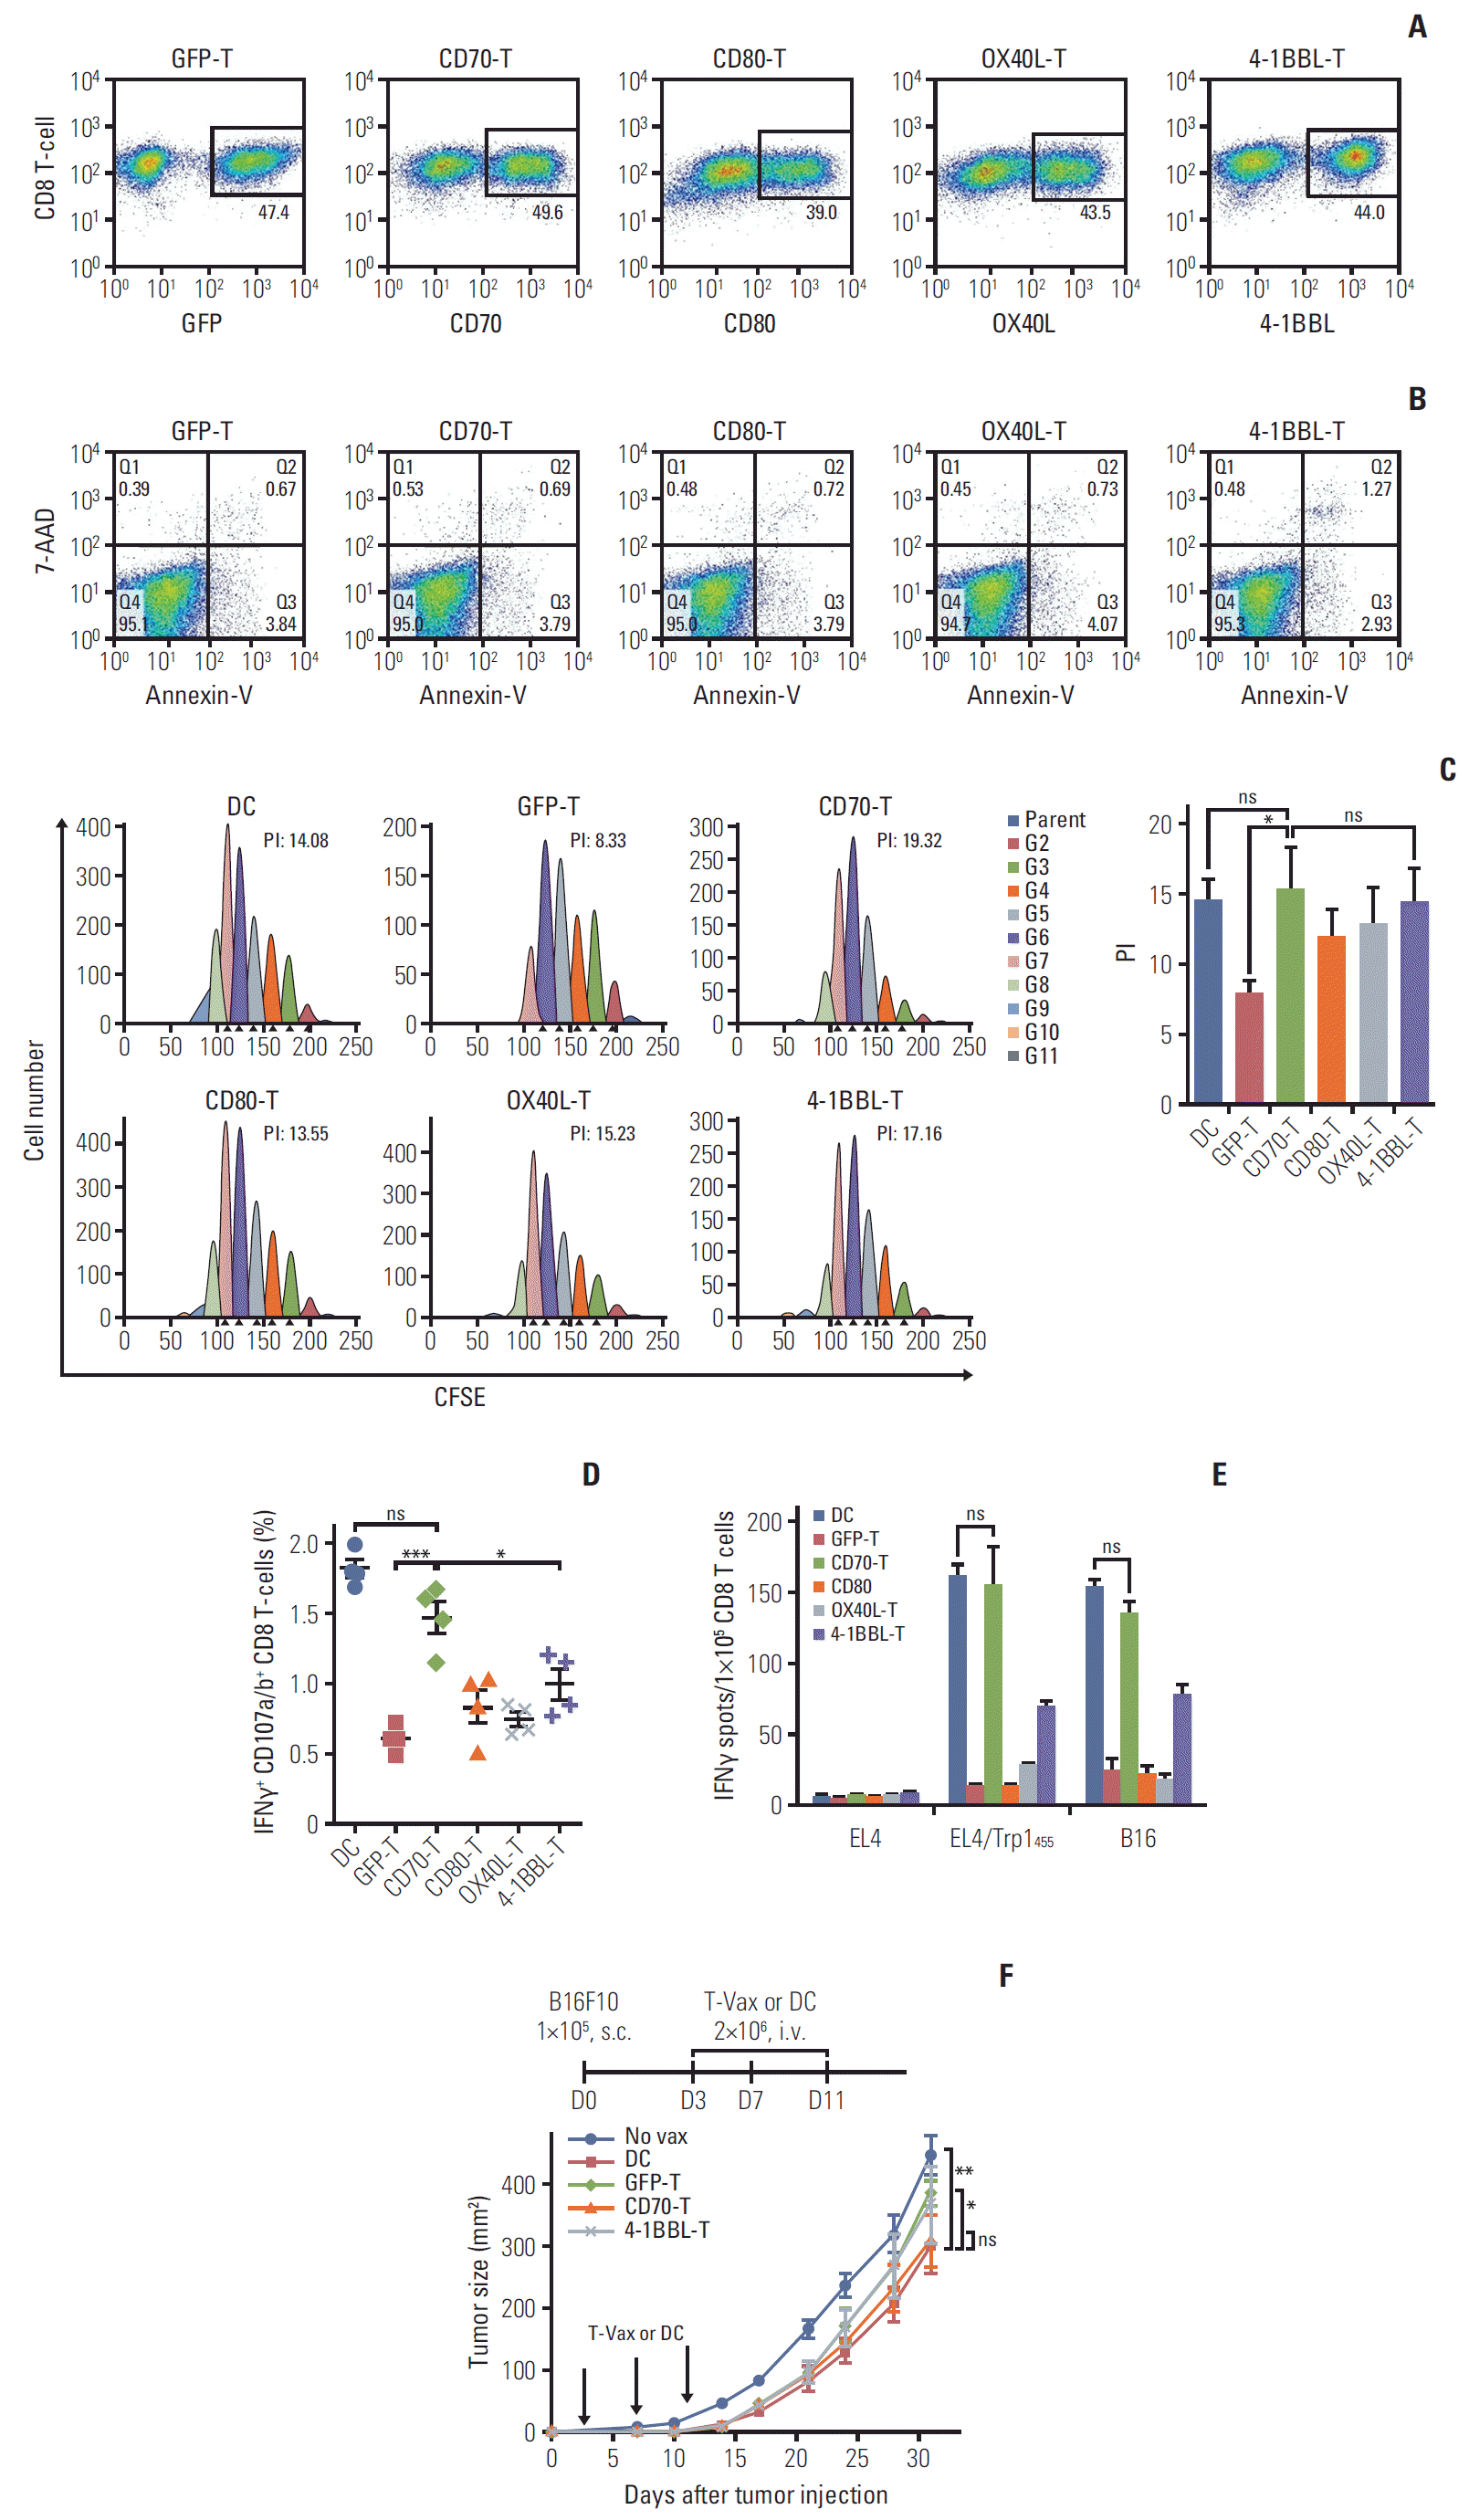 | Fig. 1.Genetically modified CD8 T-cell–based vaccination induces antigen-specific CD8 T-cell responses comparable to dendritic cell-based vaccination. Ex vivo activated splenocytes were transduced with recombinant retroviruses encoding mouse CD70, CD80, OX40L, and 4-1BBL (CD70-T, CD80-T, OX40L-T, and 4-1BBL-T, respectively). GFP was used as a mockcontrol (GFP-T). (A) The expression of transduced CD8 T cells was examined on day 3 post-transduction. (B) Cell apoptosis of the transduced were assessed by staining with annexin-V and 7-aminoactinomycin D (7-AAD) on day 3 post-transduction. (C) Proliferation of Pmel-1 T cells in response to genetically modified CD8 T cells. Pmel-1 T cells were labeled with 5 μM carboxyfluorescein succinimidyl ester and cultured with conditioned CD8 T cells as indicated, including DCs which were loaded with 1 μg/mL hgp10025 peptide. On day 3 post-co-culture, cell proliferation was measured by flow cytometry and analyzed using Modifit LT software (left panel). The results are the sum of the average proliferation index (PI) of Pmel-1 T cells from three independent experiments with standard deviation (SD, bars) of the means (right panel). PI: the sum of the cells in all generations divided by the computed number of parental cells present at the start of experiment. CFSE, carboxyfluorescein succinimidylester; ns, not significant; *p < 0.05. (D, F) B6 mice (2 per group) were immunized intravenously (i.v.) on day 0, 4, and 8 with 2×10⁶ Trp1455/9M-loaded conditioned CD8 T cells as indicated. Antigen-loaded dendritic cells (DC) and GFP-T were used for comparison. (D) Seven days after the last immunization, frequency of antigen-specific CD8 T cells in spleen from individual mouse was evaluated by cell surface mobilization of CD107a/b and intracellular interferon γ (IFNγ) staining. The results are the sum of two independent experiments. Points and bars indicate values for each individual mouse and SD, respectively. (E) Freshly isolated CD8 T cells from pooled splenocytes in D were evaluated for antigen-induced IFNγ secretions by EliSpot against un-pulsed (EL4) and peptide-pulsed EL4 (EL4/Trp1455), and B16 tumor cells. Results represent the average number of spots from duplicate wells with SD (bars) of the means. p-values were calculated using unpaired Student’s t test (ns, not significant; *p < 0.05, ***p < 0.001). (F) Therapeutic efficacy of Trp1455/9M-loaded conditioned CD8 T cells against 3-day-established B16 melanoma. B6 mice (5 per group) were inoculated subcutaneously (s.c.) with 1×10⁵ B16 cells on day 0 and received 2×10⁶ Trp1455/9M-loaded DCs or CD8 T cells on day 3, 7, and 11 (vertical arrows). Non-vaccinated mice (No vax) were included as controls. Tumor size was determined in individual mice by measurements of two opposing diameters and are presented as tumor areas in mm2. Points and bars indicate mean for each group of mice and SD, respectively. p-values were calculated using 2-way ANOVA test (ns, not significant; *p < 0.05, **p < 0.01). These experiments were repeated twice with similar results.
|
2. Effects of peptide-based booster Immunization after priming with peptide-loaded CD70-T Vaccines
The above observations indicate that CD8 T cells genetically modified to express additional costimulatory ligand CD70 exhibit augmented APC function as with DCs, and an enhanced ability to stimulate antigen-specific T cells, resulting in delayed tumor growth in vivo. However, we believed that the homologous prime-booster CD8 T-cell immunizations were not sufficient for activating and expanding tumor-reactive CD8 T cells capable of recognizing and destroying tumor cells effectively. Thus, we assessed heterologous CD70-T prime_TriVax (non-infectious peptide-based vaccine) booster immunization regimen to improve immune response of cellular vaccination. To evaluate the role that each of the components of TriVax in the secondary expansion of antigen-specific CD8 T cells, mice received booster immunization after peptide-loaded CD70-T priming vaccination. As shown in Fig. 2A and B, TriVax vaccine containing agonistic Abs (anti-OX40, anti–4-1BB, or anti-CD40) was significantly superior to the peptide plus poly-IC only, and the functional activity of freshly isolated CD8 T cells from immunized mouse was evident against both peptide-pulsed EL4 and B16 tumor cells. Moreover, anti-OX40 and 4-1BB Abs was not as effective as anti-CD40 to enhance the magnitude and quality of T-cell responses.
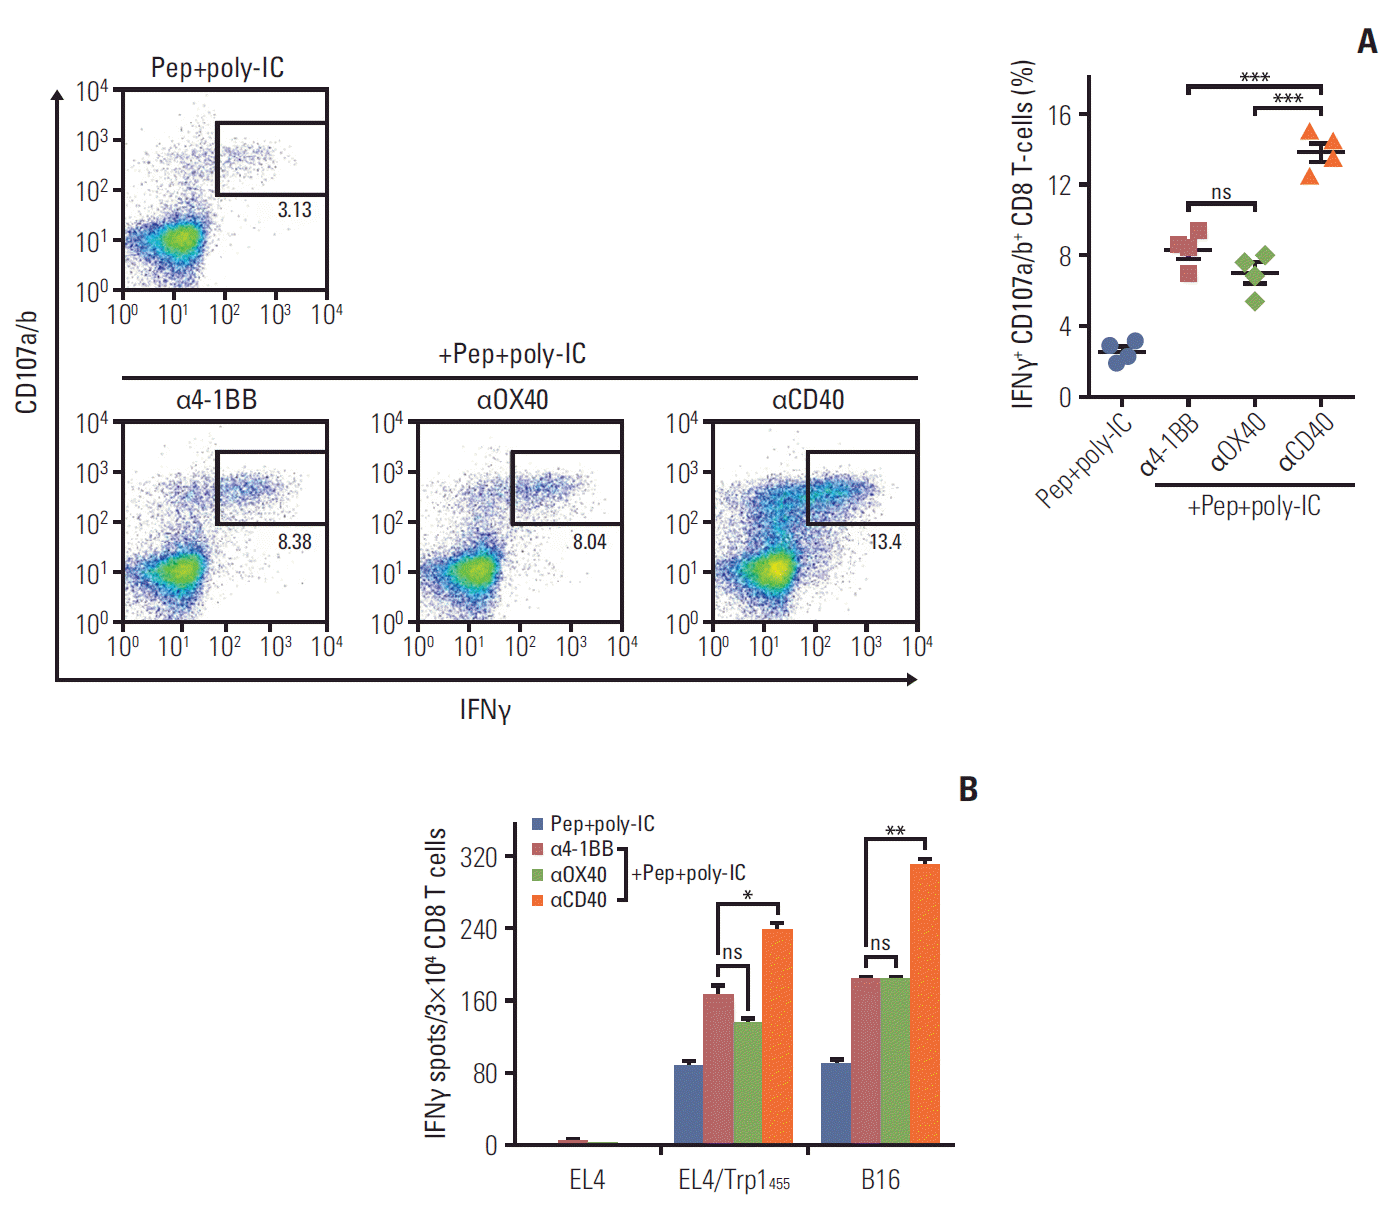 | Fig. 2.Peptide-based booster immunization after priming with CD70-T cells drives enhanced CD8 T-cell responses. B6 mice (2 per group) were immunized intravenously on day 0 with 2×10⁶ Trp1455/9M-loaded CD70-T cells; 7 days later, the mice received a booster immunization with various combination of 100 μg of Trp1455/9M peptide, 50 μg of poly-IC, and 50 μg anti-CD40, anti–4-1BB, or anti-OX40 antibodies. (A) Seven days after last immunization, the frequency of antigen-specific CD8 T cells in spleen was evaluated as in Fig. 1D. A representative dot plot analysis for one mouse of each group is presented (left panel). Numbers in each rectangular gate represent the percentage of interferon γ (IFNγ) and cell surface CD107a/b double-positive cells of all CD8 T cells. The results are the sum of two independent experiments. Points and bars indicate values for each individual mouse and standard deviation (SD), respectively. (B) Antigen-induced IFNγ-secretions with freshly isolated CD8 T cells from pooled splenocytes in A were evaluated as in Fig. 1E. Results represent the average number of spots from duplicate wells with SD (bars) of the means. p-values were calculated using unpaired Student’s t test (ns, not significant; *p < 0.05, **p < 0.01, ***p < 0.001). These experiments were repeated twice with similar results.
|
3. Therapeutic antitumor effects of CD70-T prime_TriVax boost vaccination against established B16 melanoma
Next, we assessed whether CD70-T prime_TriVax boost (CD70-T_TriVax) vaccination could induce similar frequency of antigen-specific CD8 T cells as that of DC-based vaccination. As shown in Fig. 3A and B, the heterologous TriVax booster vaccination strategy demonstrated overall improvement of the functional CD8 T-cell responses generated by DC-based or CD70-T-cell priming in comparison to that of mock-GFP-T prime vaccination. Subsequently, we evaluated whether heterologous CD70-T_TriVax vaccination regimen would offer a therapeutic benefit in vivo against established tumors. Mice were first challenged subcutaneously with B16 cells, and 3 days later, the mice received Trp1455/9M-loaded CD70-T_TriVax (Trp1455/9MCD70-T_TriVax) immunization with a 7-day interval. Although Trp1455/9M-loaded GFP-T_ TriVax had moderate therapeutic effects when compared to unvaccinated mice, mice that received Trp1455/9MCD70-T_TriVax vaccination had substantially reduced tumor progression as in DC-based prime vaccination (Fig. 3C). Then, we assessed the roles of CD8 T cells, CD4 T cells, and natural killer (NK) cells in controlling tumor progression in CD70-T_TriVax vaccination regime by in vivo depletion. Elimination of CD8 T cells completely abolished the therapeutic benefit of Trp1455/9MCD70-T_TriVax vaccination, indicating that CD8 T cells are crucial for the controlling of established tumors (Fig. 3D). Depletion of NK cells had moderate, but not significant effects on the therapeutic benefit. Interestingly though, the administration of anti-CD4 Abs in Trp1455/9M CD70-T_TriVax vaccination strategy enhanced the therapeutic efficacy, implying that the elimination of CD4 T cells may contribute to inhibit tumor growth. These overall results suggest that priming with CD70-T vaccination is as efficient as DC-based priming in combination of TriVax booster vaccination regimen, resulting potent therapeutic antitumor effects.
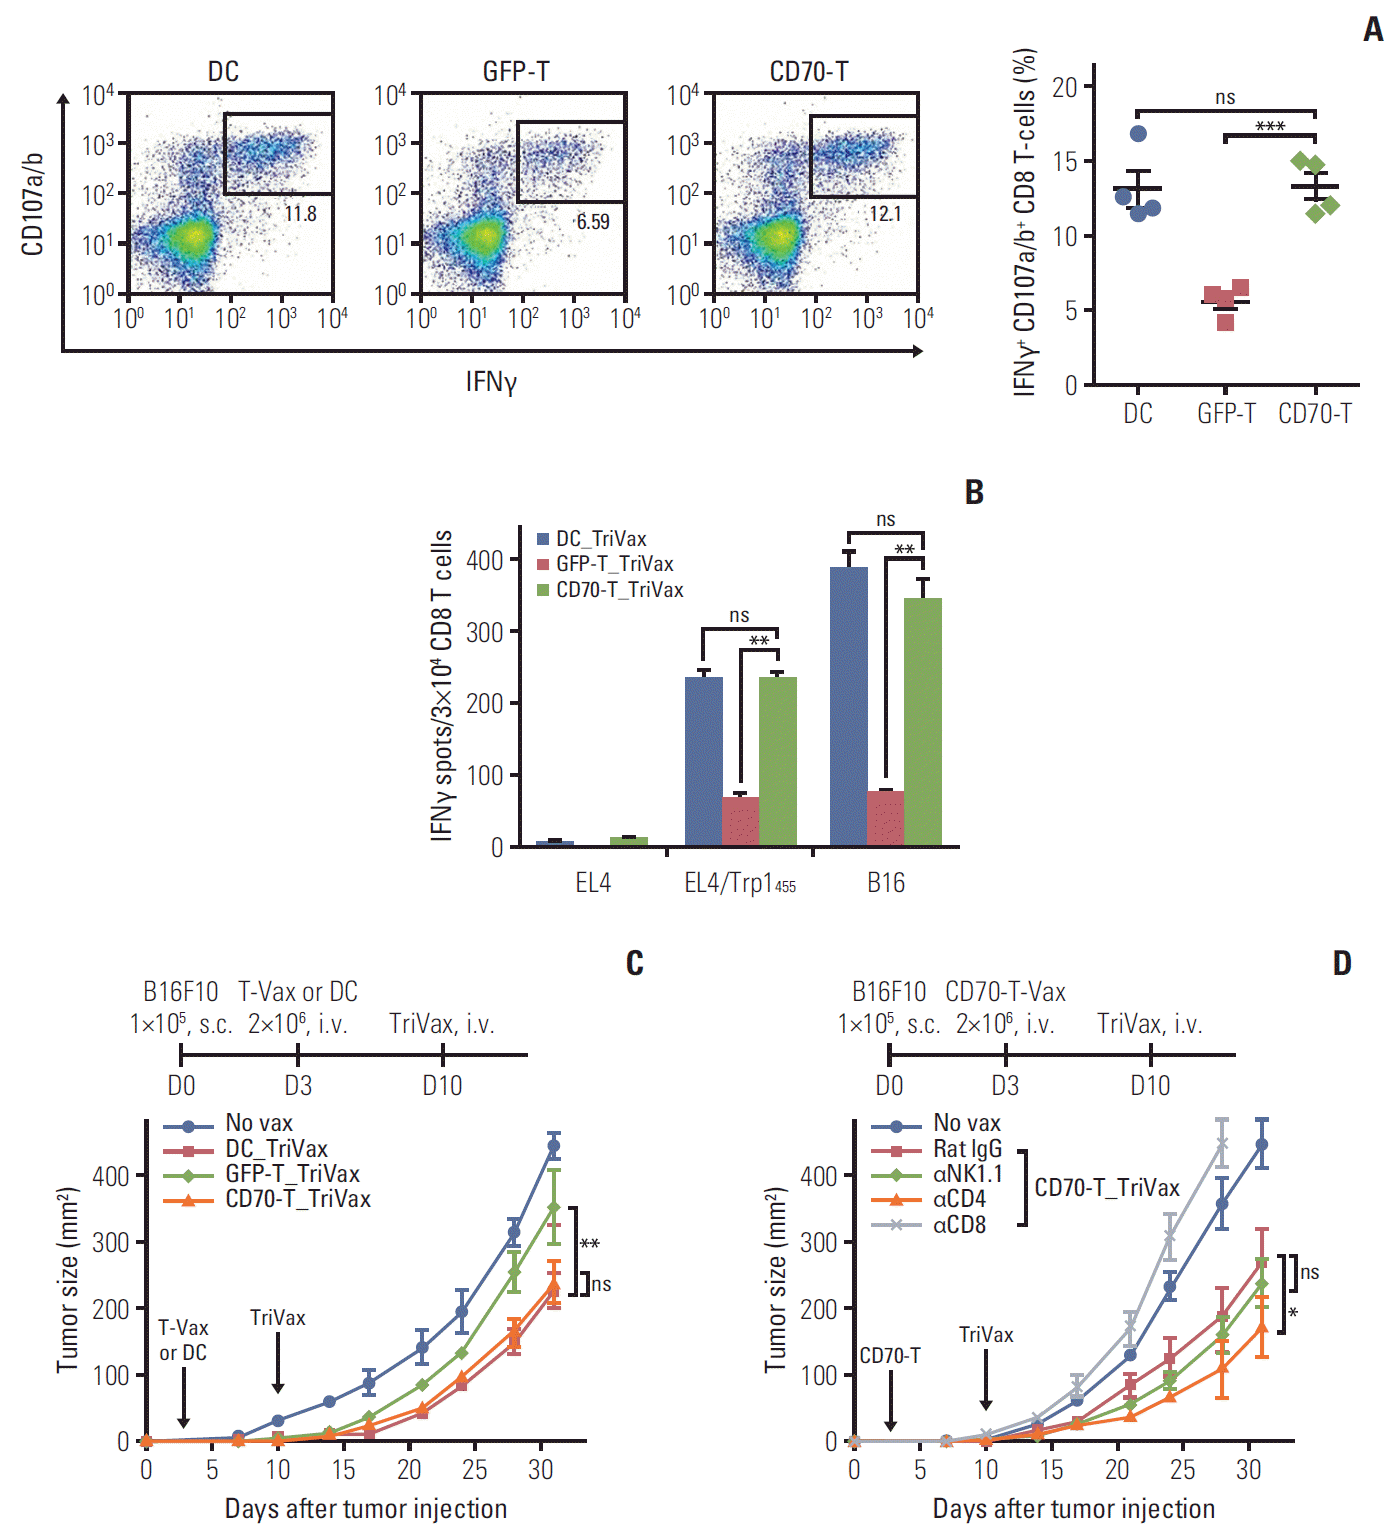 | Fig. 3.Therapeutic antitumor effects of CD70-T prime_TriVax boost vaccination against established B16 melanoma. B6 mice (2 per group) were immunized intravenously (i.v.) on day 0 with 2×10⁶ Trp1455/9M-loaded GFP-T or CD70-T cells; 7 days later, the mice received a booster immunization with combination of 100 μg of Trp1455/9M peptide, 50 μg of poly-IC, and 50 μg anti-CD40 antibodies (GFP-T_TriVax and CD70-T_TriVax, respectively). Trp1455/9M-loaded dendritic cells prime_TriVax boost (DC_TriVax) were included for comparison. (A) Seven days after last immunization, the frequency of antigen-specific CD8 T cells in spleen was evaluated as in Fig. 1D. A representative dot plot analysis for one mouse of each group is presented (left panel). Numbers in each rectangular gate represent the percentage of interferon γ (IFNγ) and cell surface CD107a/b double-positive cells of all CD8 T cells. The results are the sum of two independent experiments. Points and bars indicate values for each individual mouse and standard deviation (SD), respectively. (B) Antigen-induced IFNγ-secretions with freshly isolated CD8 T cells from pooled splenocytes in A were evaluated as in Fig. 1E. Results represent the average number of spots from duplicate wells with SD (bars) of the means. p-values were calculated using unpaired Student’s t test (ns, not significant; **p < 0.01, ***p < 0.001). (C) Therapeutic efficacy of CD70-T_TriVax vaccination against 3-day-established B16 melanoma. B6 mice (5 per group) were inoculated subcutaneously (s.c.) with 1×10⁵ B16 cells on day 0 and received 2×10⁶ Trp1455/9M-loaded GFP-T or CD70-T cells on day 3. After 7 days, the mice received a TriVax booster immunization (vertical arrows). Non-vaccinated mice (No vax) and DC_TriVax were included for comparison. (D) Effector mechanism of CD70-T_TriVax vaccination involved in antitumor effects. B6 mice (5 per group) were administered intraperitoneally with indicated antibodies –1 and –3 days before each immunization. No vax and Rat IgG-treated mice were included as controls. Tumor sizes were determined in individual mice by measurements of two opposing diameters and are presented as tumor areas in mm2. Points and bars indicate the mean for each group of mice and SD, respectively. p-values were calculated using 2-way ANOVA test (ns, not significant; *p < 0.05, **p < 0.01). These experiments were repeated twice with similar results.
|
4. Enhanced therapeutic efficacy of CD70-T_TriVax vaccination along with PD-L1 blockade
Tumor size may impact the therapeutic efficacy of antitumor T-cell immunity; therefore, we evaluated the therapeutic benefits of CD70-T_TriVax vaccination regime against 7-day–established (more advanced) B16 melanoma. Under these circumstances, mice that received Trp1455/9MCD70-T_TriVax vaccination had also substantially reduced tumor progression as in DC-based prime vaccination in comparison to that of mock-GFP-T prime vaccination (Fig. 4A). Moreover, we assessed whether in vivo PD-L1 blockade could potentiate the therapeutic efficacy of Trp1455/9MCD70-T_ TriVax vaccination in more advanced B16 melanoma. As shown in Fig. 4B, the addition of PD-L1 blockade in Trp1455/9M CD70-T_TriVax led to dramatically reduced tumor progression as compared to those with Trp1455/9MCD70-T_TriVax alone. Ova55CD70-T_TriVax had moderate effects in comparison to unvaccinated mice and the administration of isotype rat IgG had no effects on tumor progression. For further studies involved in the efficacy of the combination of PD-L1 blockade with Trp1455/9MCD70-T_TriVax in B16 melanoma setting, we investigated the presence of CD8 T-cell expansion and the frequency of myeloid-derived suppressor cells (MDSC) after euthanatizing three mice after 21 days of tumor inoculation. As shown in Fig. 4C and D, mice that received the Trp1455/9MCD70-T_TriVax with PD-L1 blockade had comparably higher numbers of CD8 T cells in spleen and tumor sites, which had antigen-specific lytic functionality as compared to mice that received the Trp1455/9MCD70-T_TriVax with isotype rat IgG. Moreover, the combined treatment of PD-L1 blockade with Trp1455/9MCD70-T_TriVax led to decreased levels of Ly6GhighLy6Clow granulocytic polymorphonuclear MDSC (PMN-MDSC) subsets, but not Ly6GlowLy6Chigh monocytic MDSC, which were presented as percentage of CD11b+CD115high myeloid cells in spleen (Fig. 4E). These overall results suggest that the improved therapeutic antitumor effects of Trp1455/9MCD70-T_TriVax in combination with PD-L1 blockade were accompanied by a substantial increase of antigen-specific CD8 T cells in tumor site, accompanying with decreasing PMN-MDSCs.
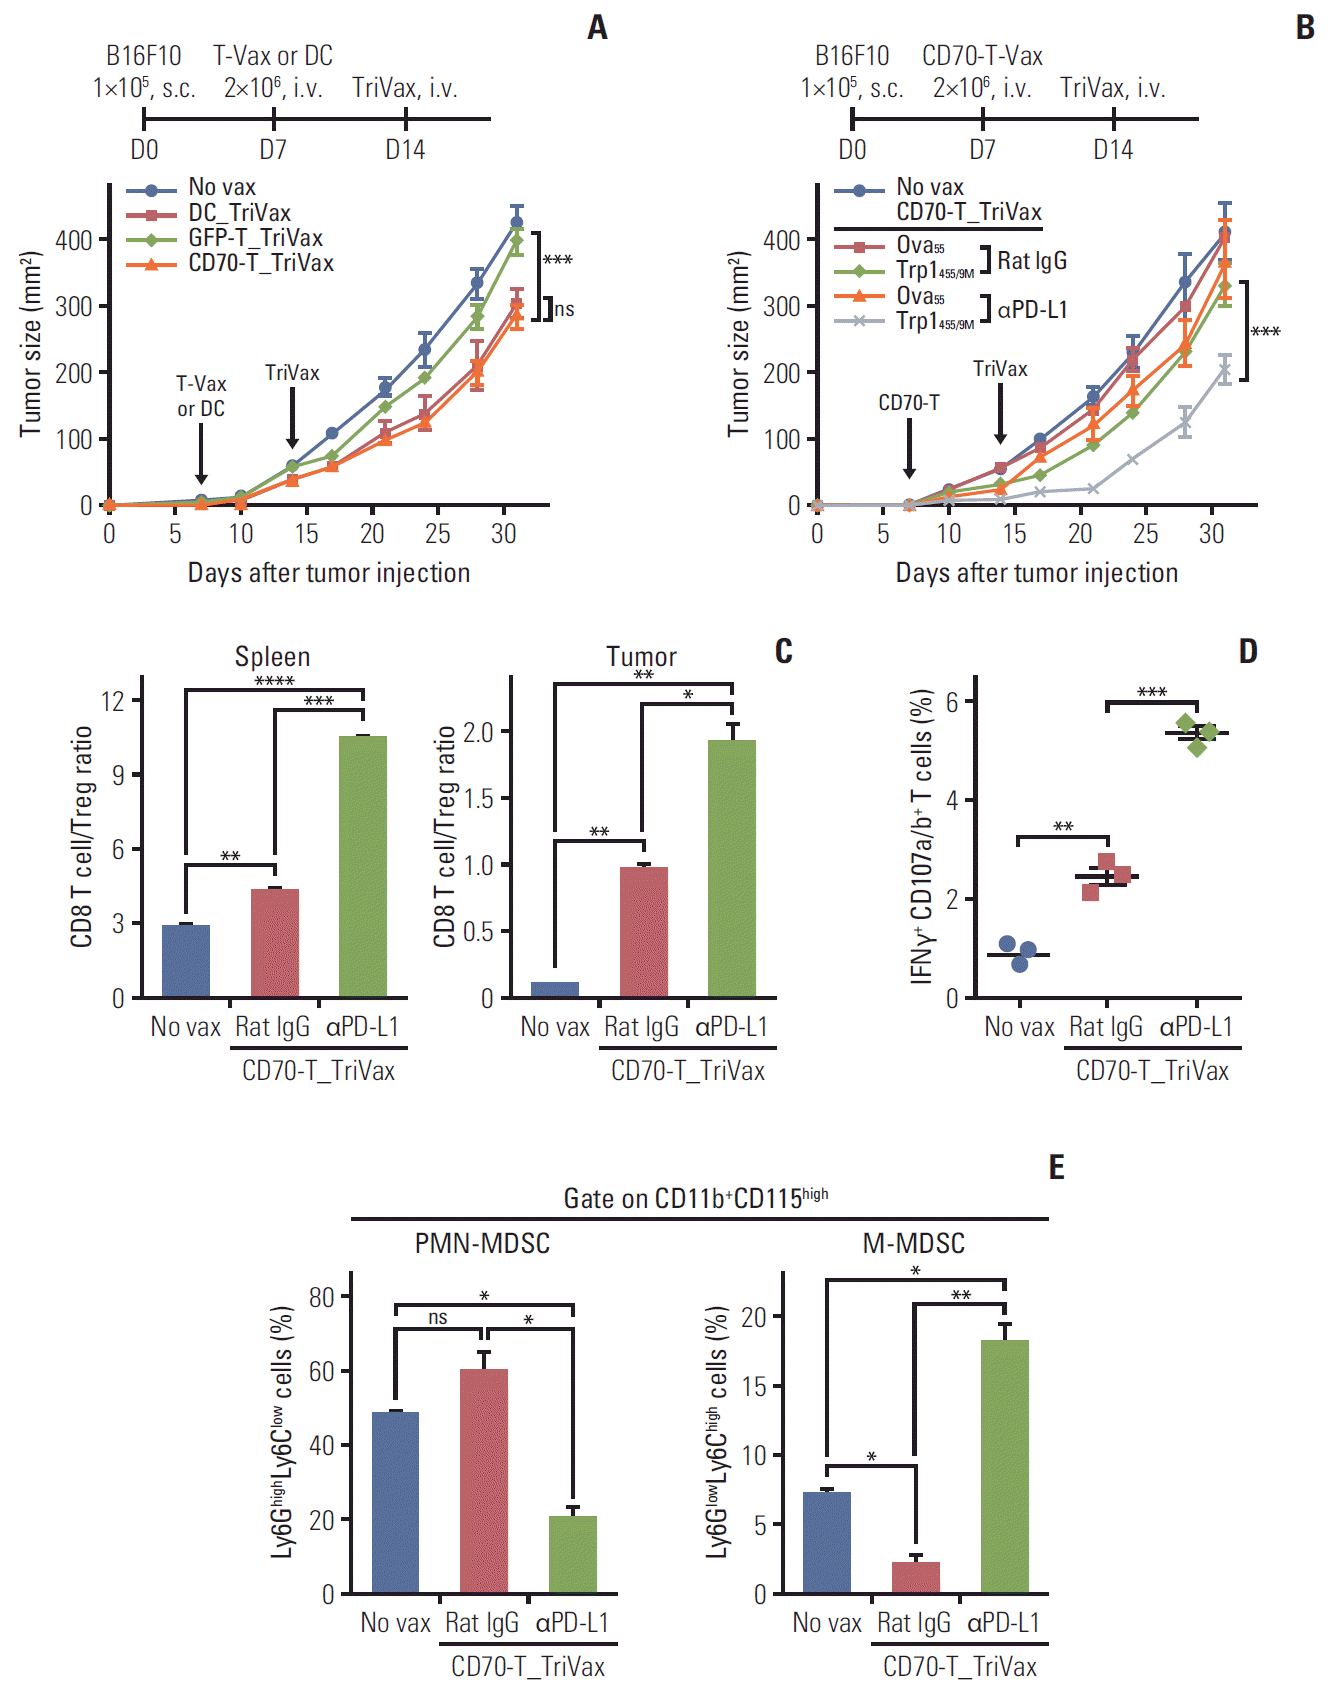 | Fig. 4.Programmed death-ligand 1 (PD-L1) blockade augments the therapeutic efficacy of CD70-T_TriVax vaccination. (A) Therapeutic efficacy of CD70-T_TriVax vaccination against advanced B16 melanoma. B6 mice (7 per group) were inoculated subcutaneously on day 0 with 1×10⁵ B16 cells, followed by vaccination with 2×10⁶ GFP-T or CD70-T cells on day 7, and TriVax on day 14 (vertical arrows). Non-vaccinated mice (No vax) and DC_TriVax were included for comparison. (B) PD-L1 blockade enhanced the efficacy of CD70-T_TriVax vaccination regimen. B6 mice (5 per group) were inoculated subcutaneously (s.c.) on day 0 with 1×10⁵ B16 cells and were immunized as described in A. Rat IgG (as controls) and anti–PD-L1 antibodies were administered intraperitoneally on days +1 and +3 after each immunization. No vaccinated (No vax) and Ova55-loaded CD70-T_TriVax vaccinated mice (Ova55) were included for comparison. Tumor sizes were determined in individual mice by measurements of two opposing diameters and are presented as tumor areas in mm2. Points and bars indicate the mean for each group of mice and standard deviation (SD), respectively. p-values were calculated using 2-way ANOVA test (ns, not significant; ***p < 0.001). (C-E) In a parallel with B, mice (3 per group) were sacrificed on day 21, and the CD8 T-cell responses and immune cell populations were evaluated. Cells from disaggregated tissues of spleen and tumor were analyzed for the composition of various subsets of immune cells. (C) CD8 T cell/Treg ratio as measured by percentage of CD8+ T cells per percentage of CD4+ Foxp3+ T cells cells in each group. (D) The frequency of antigen-specific CD8 T cells in spleen was evaluated as in Fig. 1D. Points and SD indicate values for each individual mouse and SD, respectively. ns, not significant; *p < 0.05, **p < 0.01, ***p < 0.001, ****p < 0.0001. (E) Quantification of Ly6GlowLy6Chigh monocytic myeloid-derived suppressor cells (M-MDSC) and Ly6GhighLy6Clow granulocytic polymorphonuclear MDSC (PMN-MDSC) gated on CD11b+CD115highmyeloid cells in tumor sites. Results represent the average percentage of the gated cells from individual mice with SD (bars) of the means. p-values were calculated using unpaired Student’s t test (ns, not significant; *p < 0.05, **p < 0.01. These experiments were repeated twice with similar results.
|
5. Effective antitumor CD8 T cell response of multi-epitope-loaded CD70-T_TriVax immunization
One of the potential hurdles of cellular vaccines using single T-cell epitope vaccines is the risk of selecting tumor escape variants. In view of this, we explored whether priming using CD70-T cells loaded with several peptides followed by multi-peptide TriVax would generate a concurrent, multivalent CD8 T-cell response. For these experiments, we added two more T-cell epitopes derived from the melanosomal antigens, Trp2180 and hgp10025. As shown in Fig. 5A, CD70-T_ TriVax vaccination with three peptide epitopes (Trp1455/9M, Trp2180 and hgp10025; 3pepMIX) triggered a substantial simultaneous CD8 T-cell response toward all three epitopes, whereas 3pepMIXTriVax in absence of CD70-T priming mostly generated a Trp2180-specific CD8 T-cell responses. The functional activity of purified CD8 T cells was studied for their ability to recognize various target cells. Notably, CD8 T cells from 3pepMIXCD70-T_TriVax-vaccinated mice demonstrated significantly improved recognition toward B16 cells in comparison to CD8 T cells from mice that received 3pepMIXTriVax alone (Fig. 5B). We further examined the therapeutic efficacy of 3pepMIX-loaded CD70-T_TriVax against 3-day–established B16 melanoma in comparison with the individual Trp1455/9M-, Trp2180-, or hgp10025CD70-T_TriVax vaccinations. As shown in Fig. 5C, administration of 3pepMIXCD70-T_TriVax resulted in a markedly superior therapeutic antitumor effects, whereas administration of individual peptide-loaded CD70-T_ TriVax vaccinations resulted in moderate antitumor effects as compared to non-vaccinated group. Likewise, we also investigated the therapeutic antitumor effect of the 3pepMIXCD70-T_TriVax with or without PD-L1 blockade in 7-day–established (3-5 mm in diameter) tumors. The results presented in Fig. 5D indicate that the addition of PD1 blockade increased dramatically the therapeutic efficacy of 3pepMIXCD70-T_TriVax vaccination, where tumor growth was significantly delayed. When the presence of CD8 T-cell expansion was evaluated in spleens and tumor sites after euthanatizing four mice after 21 days of tumor inoculation, mice that received the 3pepMIXCD70-T_TriVax with PD-L1 blockade had comparably higher numbers of CD8 T cells in spleen and tumor sites in comparison to those without PD-L1 blockade, which exhibited dominant presence of Trp2180-specific CD8 T cells (Fig. 5E and F).
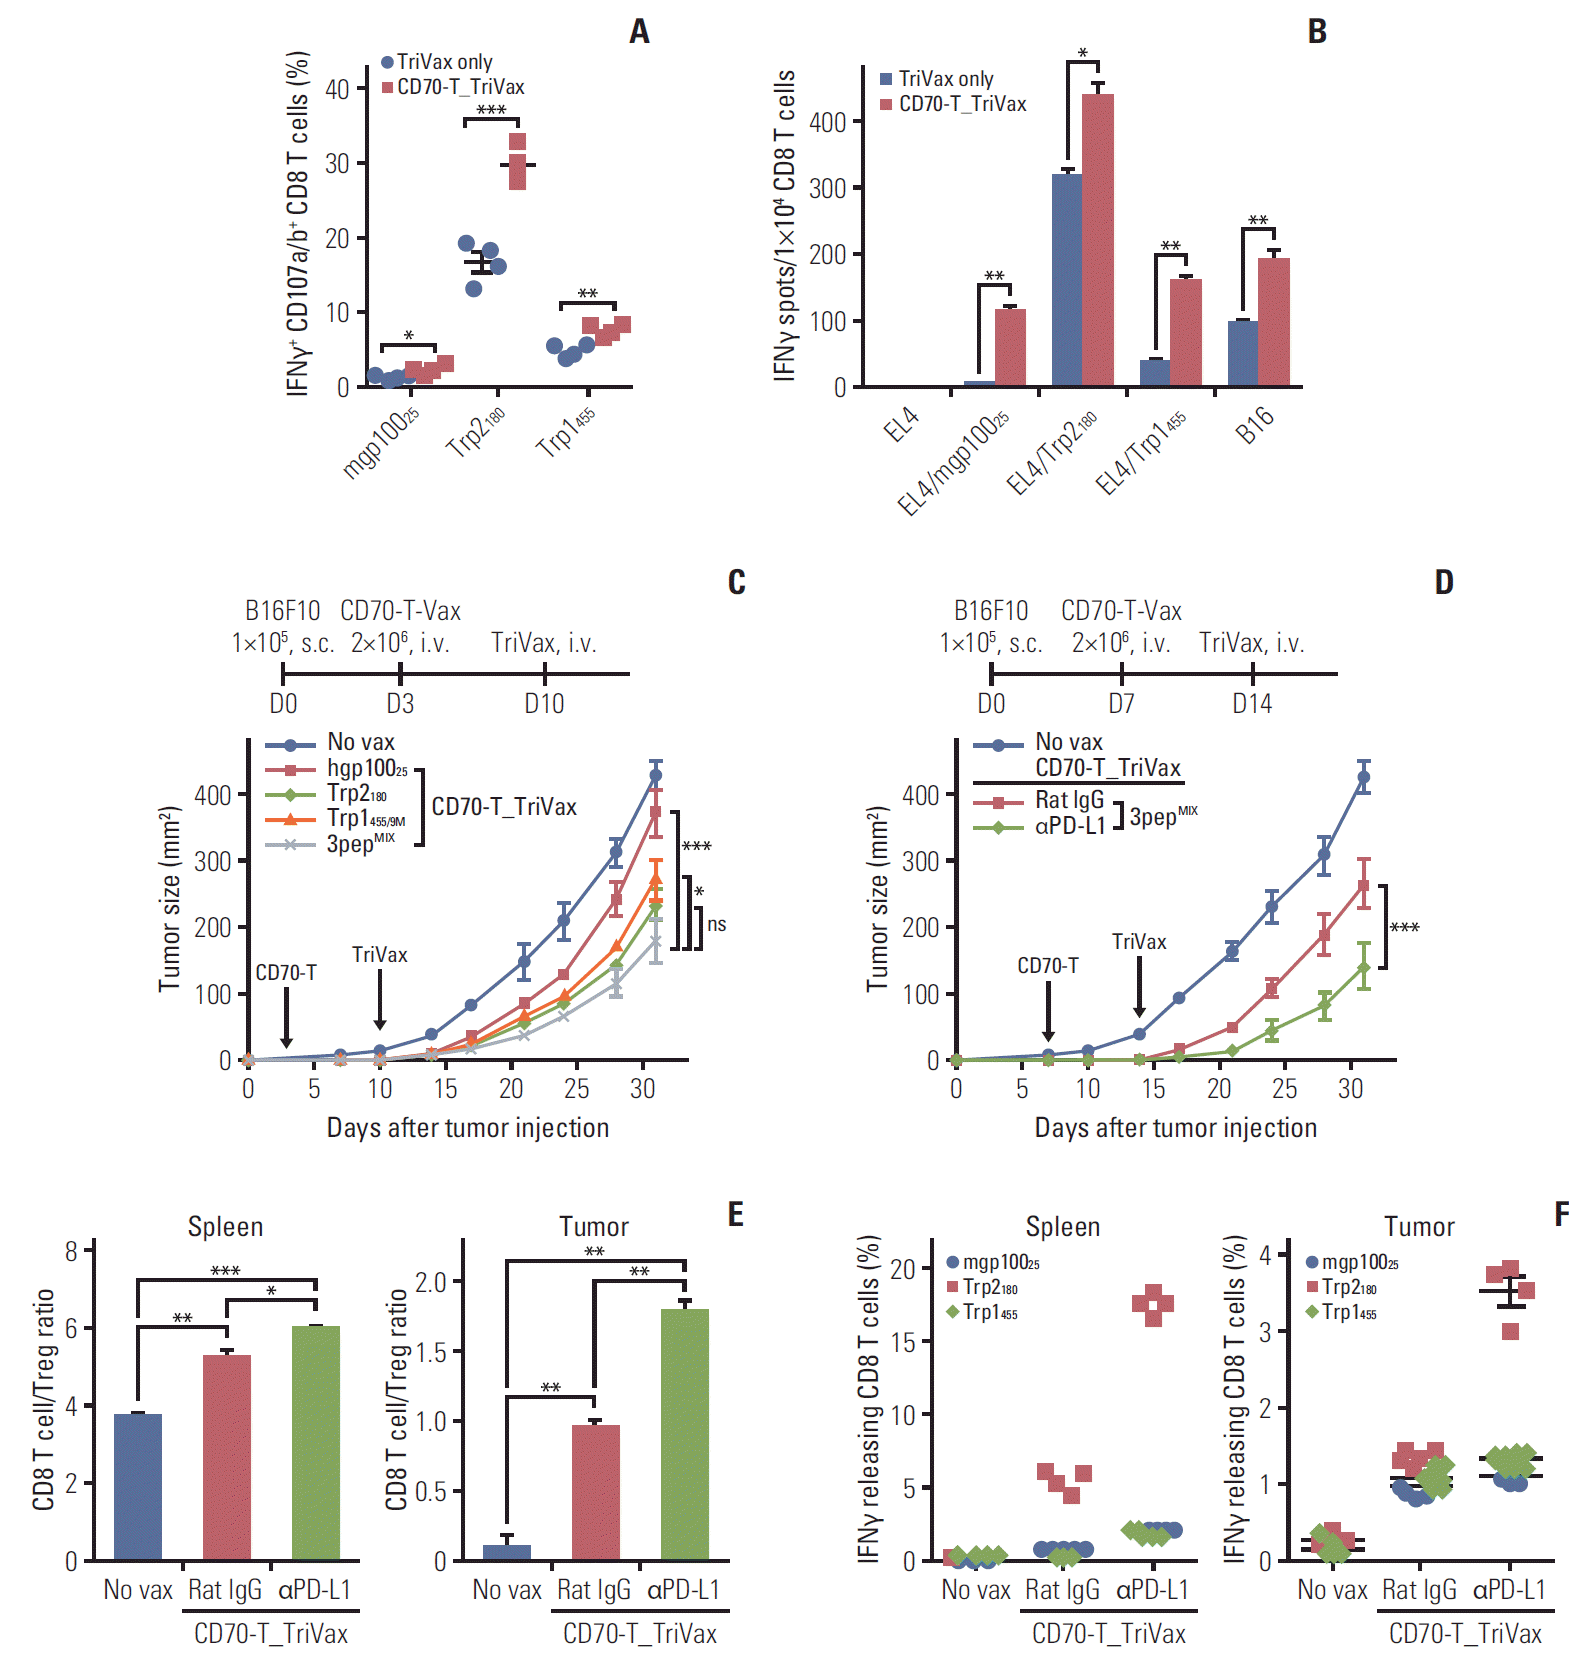 | Fig. 5.Multi-epitope-loaded CD70-T cells priming followed by TriVax booster immunization induces concurrent effective antitumor CD8 T-cell responses. B6 mice (2 per group) were immunized intravenously (i.v.) with CD70-T cells that were loaded with mixture of Trp1455/9M, Trp2180, and hgp10025 peptides; 7 days later, the mice received 3pepMIXTriVax. (A) The frequency of antigen-specific CD8 T cells in spleen was evaluated as in Fig. 1D. Points and standard deviation (SD) indicate values for each individual mouse and SD, respectively. (B) Antigen-induced interferon γ (IFNγ)-secretions with freshly isolated CD8 T cells from pooled splenocytes in A were evaluated as in Fig. 1E. Results represent the average number of spots from duplicate wells with SD (bars) of the means. p-values were calculated using unpaired Student’s t test (ns, not significant; *p < 0.05, **p < 0.01, ***p < 0.001). (C) Therapeutic effectiveness of multi-epitope–loaded CD70-T_TriVax immunization against 3-day–established B16 melanoma. B6 mice (5 per group) were inoculated subcutaneously on day 0 with 1×10⁵ B16 cells and were immunized i.v. on day 3 and 10 (vertical arrow) in combination with CD70-T or TriVax using either individual peptide or mixture of Trp1455/9M, Trp2180, and hgp10025 (3pepMIX) peptides as indicated. (D) Programmed death-1 blockade enhance the therapeutic efficacy of 3pepMIXCD70-T_TriVax immunization against advanced B16 tumors. B6 mice (7 per group) were inoculated subcutaneously (s.c.) on day 0 with 1×10⁵ B16 cells and were immunized as described in Fig. 4B. Rat IgG (as controls) and anti–PD-L1 antibodies were administered intraperitoneally on days +1 and +3 after each immunization. Non-vaccinated mice (No vax) was included as a control. Tumor sizes were determined in individual mice by measurements of two opposing diameters and are presented as tumor areas on mm2. Points and bars indicate the mean for each group of mice and SD, respectively. p-values were calculated using 2-way ANOVA test (ns, not significant; *p < 0.05, ***p < 0.001). (E, F) In a parallel with D, mice (4 per group) were sacrificed on day 21, and the CD8 T-cell responses and immune cell populations were evaluated as described in Fig. 4C and D. (E) CD8 T-cell/Treg ratio as measured by percentage of CD8+ T cells per percentage of CD4+ Foxp3+ T cells cells in each group. Results represent the ave-rage percentage of the gated cells from individual mice with SD (bars) of the means. p-values were calculated using unpaired Student’s t test (*p < 0.05, **p < 0.01, ***p < 0.001). (F) The frequency of antigen-specific CD8 T cells of spleen and tumor site was evaluated by intracellular IFNγ staining. Points and bars indicate values for each individual mouse and SD, respectively. These experiments were repeated twice with similar results.
|
6. Effects of CD70-T vaccination in antitumor efficacy of adoptive T-cell therapy
Although ACT utilizing antigen-specific CD8 T cells has been explored to treat aggressive malignant diseases [20] as one of promising modes of cancer immunotherapy, its implementation in the clinic remains challenging, and in some instances the results are suboptimal. The effectiveness of ACT depends evidently on the ability of the T cells to expand and survive in vivo after infusion into the tumor-bearing hosts. In view of this, we assessed the applicability of CD70-T-cell vaccination to improve the therapeutic effectiveness of adoptively transferred CD8 T cells obtained from Pmel-1 TCR transgenic mice. As shown in Fig. 6A, administration of hgp10025-loaded GFP-T and CD70-T after Pmel-1 ACT revealed similar level of in vivo expansion of Pmel-1 T cells as DC-based vaccination. However interestingly, administration of hgp10025-loaded GFP-T was not quite as effective as CD70-T in inducing lytic functional Pmel-1 T cells capable of recognizing peptide-pulsed EL4 targets and B16 melanoma cells (Fig. 6B and C). Subsequently, three modes of (DC-, GFP-T–, and CD70-T–based) cellular vaccines were compared for their ability to enhance the therapeutic efficacy of ACT with Pmel-1 T cells against 3-day–established B16 melanoma. As shown in Fig. 6D, mice with CD70-T and DC-based vaccination had modest therapeutic effects in comparison to Pmel-1 ACT alone and/or non-vaccinated mice, whereas GFP-T vaccination had negligible therapeutic effects. Measurements of the Pmel-1 T-cell numbers in spleens and tumor sites after eutha-natizing four mice on day14 showed that CD70-T was the most effective vaccine in expanding and migrating into tumor sites of the Pmel-1 T cells in comparison to other vaccination groups (Fig. 6E). Although this vaccination strategy appears to be promising for ACT setting, we hypothesized that the number of T cells that expand after vaccination determine the antitumor effects of ACT. To further increase T-cell numbers, we performed thrice cellular immunization every 3 days beginning 1 day after ACT, including a CD70-T_TriVax regimen where mice received CD70-T cells 1 day after ACT and boosted TriVax once 5 days later. As shown in Fig. 6F, three-time cellular vaccination strategy after ACT substantially improved antitumor effects as compared to one-time cellular vaccination, where CD70-T exhibited similar therapeutic efficacy as DC-based vaccination. Notably, CD70-T_TriVax regimen showed remarkably superior antitumor effects as compared to others strategies. Although thrice vaccination with CD70-T revealed significantly migrated Pmel-1 T cells in tumor site, CD70-T_TriVax regimen were accompanied by a substantial improvement in the sustained numbers of expanded Pmel-1 T cells in spleens and tumor sites as measured on day21 (Fig. 6G). These overall results imply that CD70-T_TriVax regimen led to high expansion and migration of the Pmel-1 T cells into tumor sites in comparison to other cellular vaccination strategies.
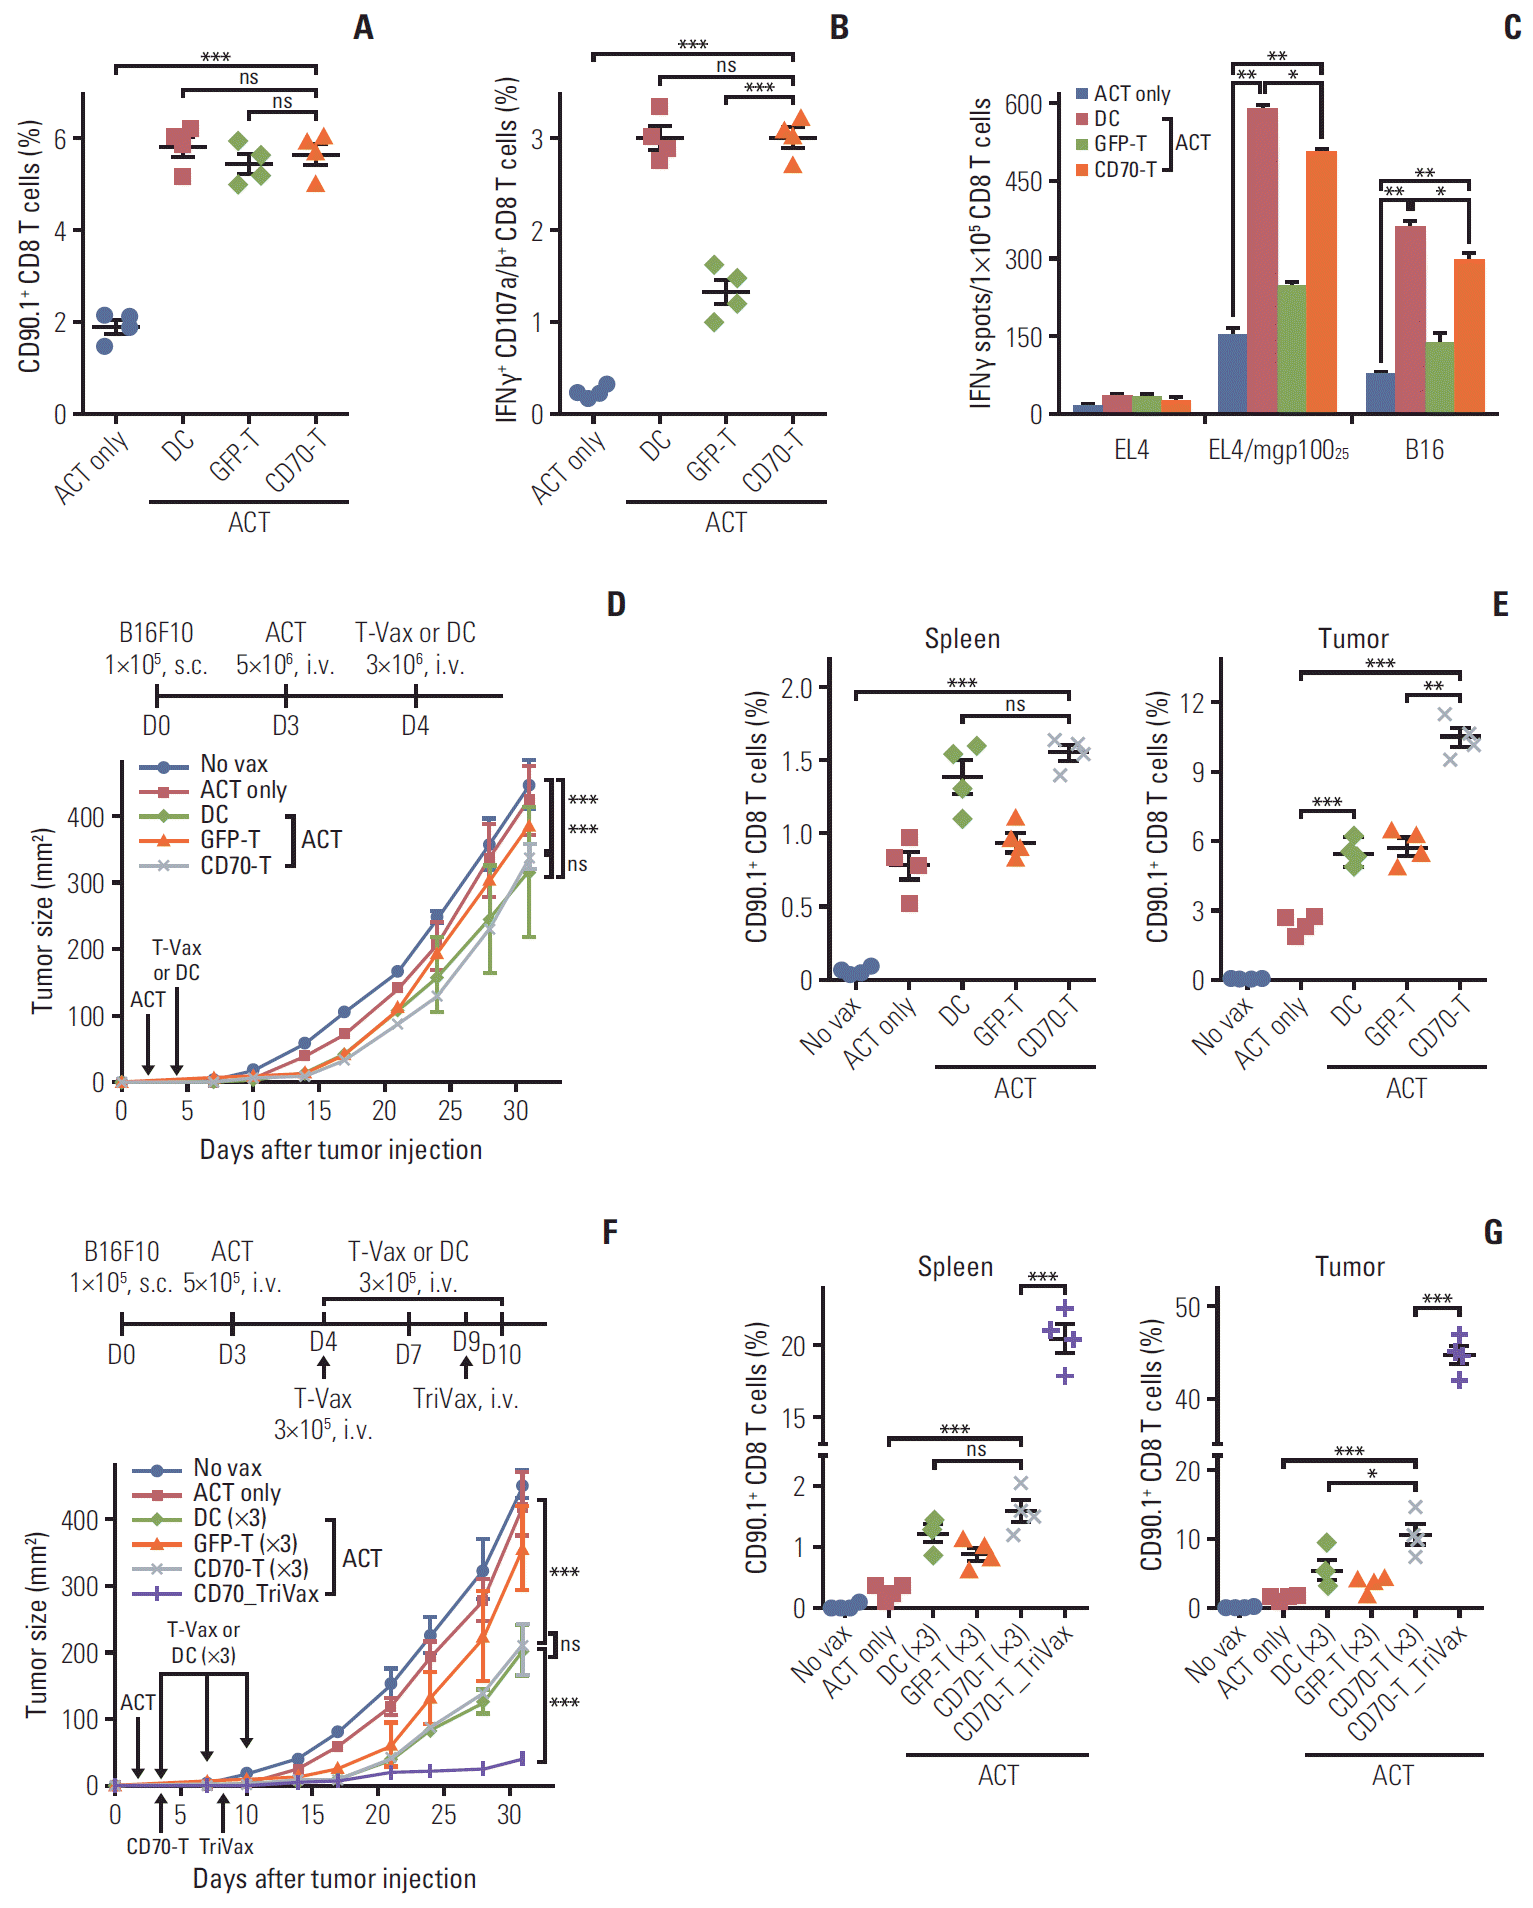 | Fig. 6.Effects of CD70-T vaccination in antitumor efficacy of adoptive T-cell therapy. (A-C) B6 mice (2 per group) were adoptively transferred 5×10⁶ naïve Pmel-1 T cells on day 0, followed by immunization on day 1 with 3×10⁶ hgp10025-pulsed GFP-T and CD70-T cells. Pmel-1 adoptive cell transfer (ACT) alone (ACT only) and dendritic cell vaccinated mice (DC) were included for comparison. (A) Seven days after the immunization, in vivo expansion of Pmel-1 T cells (CD90.1+CD8 T cells) in spleen was assessed. (B) The frequency of mgp10025-specific CD8 T cells in A was evaluated as in Fig. 1D. The results are the sum of two independent experiments with two per group. Points and bars indicate values for each individual mouse and SD, respectively. (C) Antigen-induced interferon γ (IFNγ)-secretions with freshly isolated CD8 T cells from pooled splenocytes in A were evaluated as in Fig. 1E. Results represent the average number of spots from duplicate wells with SD (bars) of the means. p-values were calculated using unpaired Student’s t test (ns, not significant; *p < 0.05, **p < 0.01, ***p < 0.001). (D, F) Antitumor effects of CD70-T immunization after Pmel-1 ACT. B6 mice (5 per group) were inoculated subcutaneously (s.c.) on day 0 with 1×10⁵ B16 cells and received 5×10⁶ Pmel-1 cells on day 3 followed by vaccination with hgp10025-pulsed GFP-T and CD70-T cells once (on day 4; D) or thrice (on day 4, 7, and 10; F, vertical arrows). For CD70-T_TriVax regimen, TriVax was administered intravenously (i.v.) 5 days after CD70-T vaccination. Non-vaccinated mice (No vax), Pmel-1 ACT alone (ACT only) and DC vaccinated mice (DC) were included for comparison. Tumor sizes were determined in individual mice by measurements of two opposing diameters and are presented as tumor areas in mm2. Points and bars indicate the mean for each group of mice and SD, respectively. p-values were calculated using 2-way ANOVA test (ns, not significant; ***p < 0.001). (E, G) In a parallel with D and F, respectively, mice (4 per group) were sacrificed on day 21, and the frequency of Pmel-1 T cells in spleen and tumor site was evaluated. Points and SD indicate values for each individual mouse and SD, respectively. p-values were calculated using unpaired Student’s t test (ns, not significant; *p < 0.05, **p < 0.01, ***p < 0.001). These experiments were repeated twice with similar results.
|
Go to :
Discussion
Over the past decades, numerous groups including ours have devoted their efforts on developing reliable sources of autologous APCs as an alternative to DCs capable of inducing effective tumor-reactive T cells that can recognize and eradicate malignant tumor cells. Mature DCs expressing high level of costimulatory ligands along with MHC complex were well known to be a cellular adjuvant that induces tumor responsive CD8 T-cell responses in vitro and in vivo [3,21]. Moreover, DCs genetically modified to express immunestimulatory molecules, such as additional costimulatory ligands CD70, CD40L, and FLT3L have derived enhanced T cells responses in vitro and in vivo [4,5]. Though DC-based cellular vaccines have been shown to be safe and apparently immunogenic in cancer patients, DCs are present in human peripheral blood cells in such small amounts that it is difficult to obtain sufficient cells for clinical applications, and thus there are difficulties in making genetic modifications to use as cell adjuvants [7]. In this aspect, our findings provide a promising preclinical strategy in which using genetically modified CD8 T cells co-expressing CD70 priming followed by TriVax-boost immunization eliciting substantial antitumor effects in a B16 melanoma model. In the clinical realm, we and others have explored multimodality strategies of engineering DCs to expand upon their maturation and migration capabilities in order to improve APC function and antitumor efficacy [22-24]. Numerous studies have shown that expression of costimulatory ligands CD70, CD80, OX40L, and 4-1BBL on DCs connect with upregulation of cytolysisassociated molecules and cytokine production, optimizing T-cell responses [4,25]. Here, we present evidence that ex vivo-modified T cells have potential to be applied as therapeutic APCs since large numbers can be obtained from a small amount of peripheral blood and they can easily be expanded in vitro to yield a pure and homogeneous population. In view of this, earlier studies have shown that the genetical modification of T cells to express CD80 and 4-1BBL enables them to present exogenous antigens to activate T-cell responses, and to exhibit enhanced in vitro proliferation and survival as well as in vivo expansion and persistence by overcoming the deficiency of APC-dependent costimulatory signals. In the present study, we demonstrated that CD8 T cells modified with numerous costimulatory ligands CD70, CD80, OX40L, and 4-1BBL could be used as an alternative APC source using recombinant retroviruses, which elucidate several properties of stable gene delivery vehicles. Particularly, CD70-T cells were able to stimulate antigen-specific CD8 T cells and elicited effective therapeutic antitumor effects, which are consistent with previous studies demonstrating that CD70-T mediated quantitative and qualitative effects on effector CD8 T-cell formation induced potent antitumor effects [26].
Recently, numerous reports have revealed the efficacy of heterologous prime-boost strategies for generating an amplified number of antigen-specific high-avidity T cells to induce potent immune anticancer immunity to various malignancies. We have also shown a promising vaccination strategy to achieve high levels of tumor-reactive CD8 T-cell responses by heterologous combined administration of antigen-loaded DCs and TriVax booster vaccination [3]. With this regard, we pursued to evaluate heterologous CD70-T_TriVax vaccination strategy, replacing DC-based priming, by using T-cell–based APCs as an alternative to DCs. Although administration of poly-IC plus peptide after CD70-T priming could induce secondary CD8 T-cell responses, the combination of all three components of TriVax booster was more effective in secondary expansion of primed CD8 T cells (Fig. 2A). More importantly, TriVax containing anti-CD40 Abs was most effective in producing potent secondary T-cell response, resulting in higher antitumor effects than CD70-T priming and CD70-T booster strategy (Fig. 3C). It has become clear that multiple immune evasion mechanisms are present in tumor sites where potently inhibit tumor-reactive CD8 T-cell responses. Interestingly, our results showed that the depletion of CD4 T cells exhibited enhanced antitumor effects, though the antitumor effects of CD70-T_TriVax immunization was mediated principally by CD8 T cells, implying that CD4 T cells (including CD4 T regulatory cells) played a vital role on suppressing antitumor immunity and/or tumor growth.
So far, significant advances in potentiating antitumor efficacy by reversing immune tolerance in tumor site have been achieved through obstruction of immune checkpoints including programmed death-1 (PD-1)/PD-L1 interactions. It has been reported that PD-L1 is widely expressed on APCs such as macrophages, DCs, and B cells, and upregulated in response to inflammatory stimuli [27]. We and other have also shown that PD-1/PD-L1 blockade prevents exhaustion of tumor-reactive T cells in several malignancies, augmenting effector function and longevity of antigen-specific T cells at the tumor site [8,28,29]. A previous report demonstrated PD-L1 expression on murine bone marrow-derived DCs and that blockade of PD-1/PD-L1 interaction enhanced the number of T cells infiltrating the tumor and augmented longevity of tumor-reactive T cells in vivo [30]. Indeed, we observed that the systemic administration of anti–PD-L1 Abs with CD70-T_TriVax immunization led to an increase in the frequency of tumor-reactive CD8 T cells that had higher antigen-recognition functionality, resulting in enhancing antitumor efficacy with the increase in overall T-cell numbers in tumor sites (Figs. 4C and 5E). Our results also demonstrate that CD70-T_TriVax strategy allows simultaneous induction of CD8 T-cell responses to multiple epitopes derived from different melanosome antigens, which elicits a significantly improved therapeutic effect in comparison to that of CD70-T_Trivax using a single antigenic peptide (Fig. 5C). It is wellknown that a variety of immunosuppressive mechanisms in tumor sites are involved in promoting selective outgrowth of new subclones that are defective on the expression of immunogenic antigens, leading to become more heterogeneous subsets in a wide range of tumors [31]. Thus, our multi-antigen-targeting CD70-T_Trivax strategy capable of inducing large numbers of multivalent CD8 T cells potentiates the applicability of these regimes to elicit significant therapeutic antitumor benefits along with PD-L1 blockade, which exhibited the amplified frequency of tumor-infiltrating T cells in tumor sites.
Lastly, we assessed whether CD70-T vaccination could drive effective ACT against established B16 melanoma in the absence of concomitant additional procedures (high-dose IL-2 and/or lymphodepletion). In our results, ACT followed by DC-based or genetically modified T-cell–based vaccination increased Pmel-1 T-cell numbers; however, effective antigen-specific CD8 T cells were expended only in DC-based and CD70-T–based vaccination (Fig. 6). More interestingly, the frequency of tumor-infiltrating Pmel-1 T cells augmented only in CD70-T–based vaccinated mice (Fig. 6E). Our results also reveal that a single cellular vaccination strategy after ACT may not sufficient to obtain sufficient therapeutic benefits, and the combination of CD70-T_TriVax with ACT strategy was able to expand large numbers and long-lasting Pmel-1 cells, eliciting substantial therapeutic antitumor effects with enhanced tumor-infiltrating Pmel-1 T cells.
Overall, our findings suggest that in vitro expanded CD70-T could serve as an alternative source of autologous APCs, and the results from mice tumor models demonstrate the applicability of a genetically modified CD70-T–based vaccination strategy to the treatment of a broad variety of malignant tumors to overcome the limitations of DC-based therapeutic vaccines. Furthermore, administration of peptidebased booster containing anti-CD40 Abs after CD70-T priming was substantially effective in producing potent secondary expansion of primed CD8 T cells. Of those, good manufacturing practice (GMP)-grade poly-IC is commercially available and costimulatory agonistic antibodies including anti-CD40 have been developed, which have undergone clinical studies in some cancer patients [32-35]. More importantly, numerous human T-cell epitopes have been identified for decades, and recent progress on application of neo-antigen-derived peptide vaccines to cancer patients is rising [36-38] because GMP-grade peptides containing T-cell epitopes are relatively easy to synthesize cost-effectively. Based on recent knowledge on peptide vaccine, it is evident that the selection of peptide formulations, adjuvants, and route of administration used in most clinical studies were not optimal. In view of this, cell-based vaccine prime and peptide vaccine boost strategies may help further optimization of cancer vaccine using synthetic peptide epitopes, and have a feasibility for application in the clinic.
Go to :
 XML Download