Introduction
Materials and Methods
1. Study design
2. Study treatment
3. Study endpoints
4. FLIE measurement and scoring
5. Statistical analysis
6. Ethical statement
Results
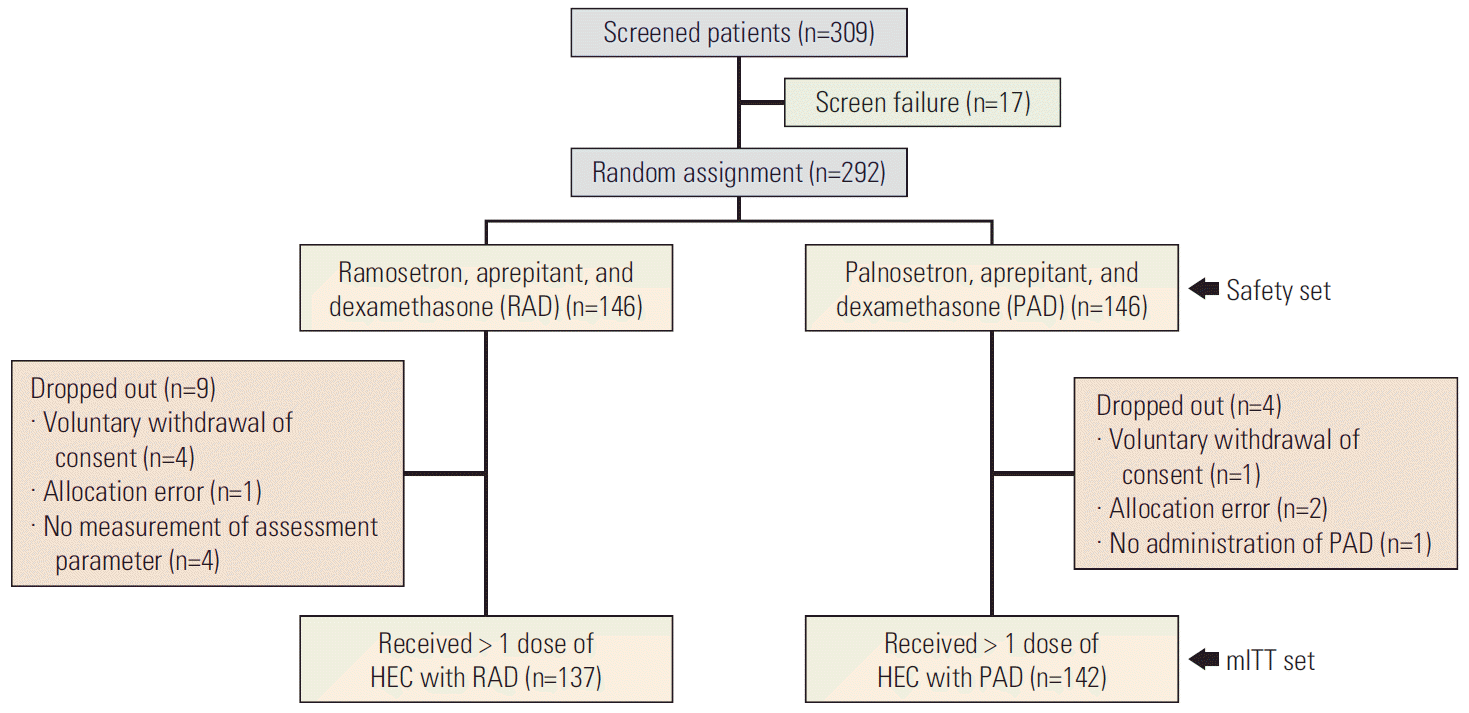
1. Patients
Fig. 1.

Table 1.
| RAD (n=137) | PAD (n=142) | p-value | |
|---|---|---|---|
| Sex | |||
| Male | 86 (62.8) | 87 (61.3) | 0.796 |
| Female | 51 (37.2) | 55 (38.7) | |
| Age (yr) | 59.4±12.0 | 60.3±11.8 | 0.521 |
| Motion sickness | |||
| Yes | 32 (23.4) | 27 (19.0) | 0.374 |
| No | 105 (76.6) | 115 (81.0) | |
| Alcohol drinking | |||
| Yes | 50 (36.5) | 52 (36.6) | 0.983 |
| No | 87 (63.5) | 90 (63.4) | |
| Tumor location | |||
| Lung and thymus | 59 (43.1) | 61 (42.9) | 0.074 |
| Breast | 32 (23.4) | 31 (21.8) | |
| Head and neck | 14 (10.2) | 25 (17.6) | |
| GU and GY | 13 (9.5) | 6 (4.2) | |
| Gastrointestinal | 9 (6.6) | 3 (2.1) | |
| Other | 10 (7.3) | 16 (11.3) | |
| Stage | |||
| I | 17 (12.4) | 13 (9.2) | 0.929 |
| II | 28 (20.4) | 32 (22.5) | |
| III | 36 (26.3) | 37 (26.1) | |
| IV | 54 (39.4) | 58 (40.8) | |
| NA | 2 (1.5) | 2 (1.4) | |
| ECOG performance status | |||
| 0 | 51 (37.2) | 51 (35.9) | 0.466a) |
| 1 | 81 (59.1) | 89 (62.7) | |
| 2 | 5 (3.6) | 2 (1.4) | |
| Cisplatin-based chemotherapyb) | |||
| Yes | 98 (71.5) | 103 (72.5) | 0.894 |
| No | 39 (28.5) | 39 (27.5) | |
| Administration schedule | |||
| Single day | 84 (61.3) | 87 (61.3) | > 0.99 |
| Multiple day | 53 (38.7) | 55 (38.7) |
Values are presented as number (%) or mean±standard deviation. RAD, ramosetron, aprepitant, and dexamethasone; PAD, palonosetron, aprepitant, and dexamethasone; GU, genitourinary; GY, gynecology; Gastrointestinal, esophagus, stomach, colorectum; Others, lymphoma, skin; NA, not available; ECOG, Eastern Cooperative Oncology Group.
b) Individual chemotherapy regimens are detailed in S2 Table.
2. Efficacy
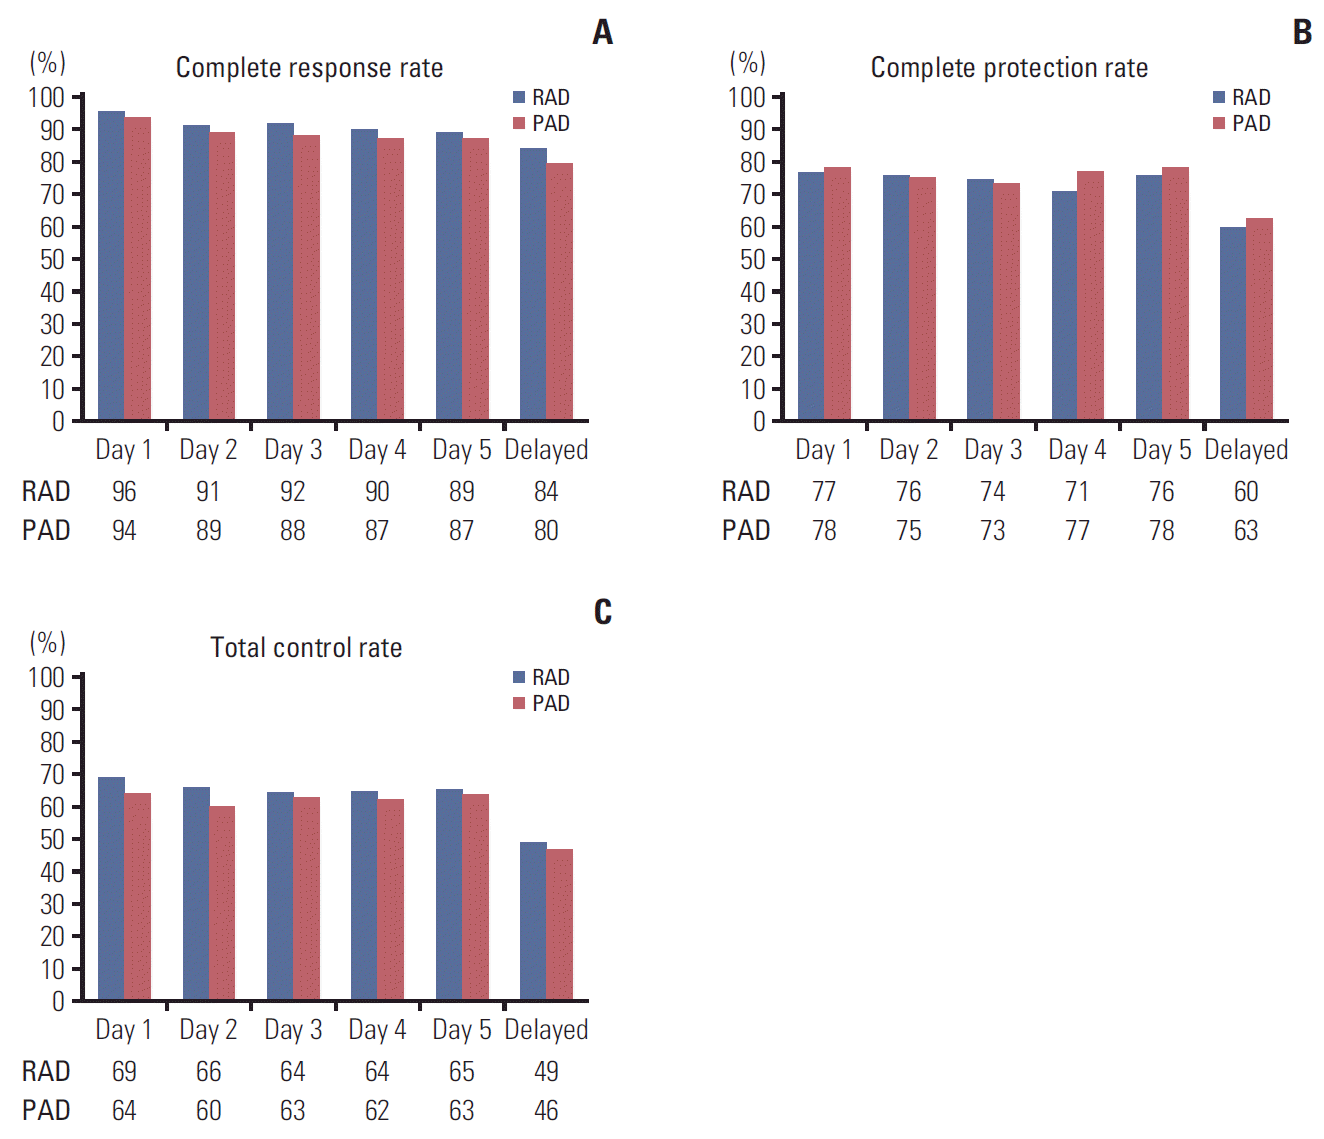
Fig. 2.

Table 2.
| Phase |
No. (%) |
Differencea) (95% CI) | |
|---|---|---|---|
| RAD (n=137) | PAD (n=142) | ||
| CR | |||
| Acute | 131 (95.6) | 133 (93.7) | 2.0 (−3.3 to 7.2) |
| Delayed | 115 (83.9) | 113 (79.6) | 4.4 (−4.7 to 13.4) |
| Overall | 112 (81.8) | 113 (79.6) | 2.2 (−7.1 to 11.4) |
| CP | |||
| Acute | 105 (76.6) | 111 (78.2) | −1.5 (−11.3 to 8.3) |
| Delayed | 82 (59.9) | 89 (62.7) | −2.8 (−14.3 to 8.6) |
| Overall | 77 (56.2) | 83 (58.5) | −2.3 (−13.9 to 9.4) |
| TC | |||
| Acute | 94 (68.6) | 91 (64.1) | 4.5 (−6.6 to 15.6) |
| Delayed | 67 (48.9) | 66 (46.5) | 2.4 (−9.3 to 14.2) |
| Overall | 65 (47.5) | 62 (43.7) | 3.8 (−7.9 to 15.5) |
3. Quality of life
Table 3.
|
Mean±SD or n (%) |
Differencea) (95% CI) | p-value | ||
|---|---|---|---|---|
| RAD (n=132) | PAD (n=138) | |||
| FLIE score | ||||
| Total | 115.5±17.6 | 114.8±16.7 | 0.68 (–3.43 to 4.79) | 0.745 |
| Nausea domain | 54.3±13.9 | 53.8±13.0 | 0.48 (–2.74 to 3.70) | 0.770 |
| Vomiting domain | 61.2±6.5 | 61.0±6.8 | 0.27 (–1.33 to 1.87) | 0.742 |
| NIDL | ||||
| Total ≥ 108 | 99 (75.0) | 102 (73.9) | 1.09 (–9.32 to 11.49) | 0.838 |
| Nausea domain ≥ 54 | 95 (72.0) | 91 (65.9) | 6.24 (–4.74 to 17.22) | 0.267 |
| Vomiting domain ≥ 54 | 123 (93.2) | 126 (91.3) | 1.88 (–4.49 to 8.25) | 0.565 |
4. Adverse events
Table 4.
Values are presented as number (%). Adverse events were graded according to National Cancer Institute–Common Terminology Criteria (CTCAE) ver. 4.03. RAD, ramosetron, aprepitant, and dexamethasone; PAD, palonosetron, aprepitant, and dexamethasone; AST, aspartate aminotransferase; ALT, alanine aminotransferase.
Discussion
Table 5.
| Study | Type of HEC | No. of patients | Antiemetic regimens | CR (%) during study periods | p-value | No emesis CP, or TC (%) during study periods | p-value | Remarks |
|---|---|---|---|---|---|---|---|---|
| Kim et al. [21]a) | CDDP-based (≥ 70 mg/m2) or AC | 299 | RAD vs. OAD (144 vs. 155) | Acute: 97 vs. 94 | - | Acute: 74 vs. 66 | - | Median CDDP dose was 70 mg/m2 in both arms |
| Delayed: 78 vs. 74 | - | Delayed: 52 vs. 41 | - | |||||
| Overall: 77 vs. 72 | - | Overall: 50 vs. 38 | - | |||||
| Suzuki et al. [14]a) | CDDP-based (≥ 50 mg/m2) | 827 | PAD vs. GAD (414 vs. 413) | Acute: 92 vs. 92 | 1.00 | Acute: 81 vs. 81 | 1.00 | More than 70% of patients received ≥ 70 mg/m2 in both arms |
| Delayed: 67 vs. 59 | 0.01 | Delayed: 49 vs. 41 | 0.04 | |||||
| Overall: 66 vs. 59 | 0.05 | Overall: 48 vs. 41 | 0.04 | |||||
| Navari et al. [15]b) | CDDP-based (≥ 70 mg/m2) or AC | 241 | OPD vs. PAD (121 vs. 120) | Acute: 97 vs. 87 | > 0.05 | Acute: 87 vs. 87 | > 0.05 | Nausea was better controlled with OPD |
| Delayed: 77 vs. 73 | > 0.05 | Delayed: 69 vs. 38 | < 0.01 | |||||
| Overall: 77 vs. 73 | > 0.05 | Overall: 69 vs. 38 | < 0.01 | |||||
| Hesketh et al. [16]c) | CDDP-based (≥ 50 mg/m2) | 271 | NEPD vs. PD (135 vs. 136) | Acute: 99 vs. 90 | ≤ 0.01 | Acute: 97 vs. 88 | ≤ 0.01 | Result of NEPA300 arm is described here |
| Delayed: 90 vs. 80 | ≤ 0.05 | Delayed: 82 vs. 74 | ≤ 0.05 | |||||
| Overall: 90 vs. 77 | ≤ 0.01 | Overall: 78 vs. 70 | ≤ 0.01 | |||||
| Roila et al. [17]a) | CDDP-based (≥ 50 mg/m2) | 284 | PADM vs. PAD (137 vs. 147) | Acute: 95 vs. 95 | 1.00 | Acute: 87 vs. 80 | 0.12 | Randomization: metoclopramide vs. aprepitant in delayed phase |
| Delayed: 83 vs. 80 | 0.38 | Delayed: 71 vs. 69 | 0.90 | |||||
| Overall: NR | - | Overall: NR | - | |||||
| Gralla et al. [18] | CDDP-based | 412 | NEPD vs. PAD (308 vs. 103) | Acute: NR | - | NR | - | MEC (76%), HEC (24%) |
| Delayed: NR | - | |||||||
| Overall: 81 vs. 76 | < 0.01 | |||||||
| Wu et al. [19]b) | CDDP-based (75 mg/m2) | 244 | PAD vs. PD (122 vs. 122) | Acute: NR | - | Acute: NR | - | - |
| Delayed: NR | - | Delayed: NR | - | |||||
| Overall: 93 vs. 80 | < 0.01 | Overall*: 75 vs. 71 | > 0.05 | |||||
| Zhang et al. [20]b) | CDDP-based (≥ 50 mg/m2) | 828 | NEPD vs. GAD (412 vs. 416) | Acute: 85 vs. 87 | - | Acute: 69 vs. 68 | - | Risk difference showed non-inferiority of NEPD |
| Delayed: 78 vs. 74 | - | Delayed: 53 vs. 54 | - | |||||
| Overall: 74 vs. 72 | - | Overall: 49 vs. 51 | - |
HEC, highly-emetogenic chemotherapy; CINV, chemotherapy-induced nausea and vomiting; CR, complete response (no emesis, no rescue medication); CP, complete protection (CR and nausea score < 25 [0-100]); TC, total control (CR and no nausea); CDDP, cisplatin; AC, adriamycin, cyclophosphamide; RAD, ramosetron, aprepitant, dexamethasone; OAD, ondansetron, aprepitant, dexamethasone; PAD, palonosetron, aprepitant, dexamethasone; GAD, granisetron, aprepitant, dexamethasone; OPD, olanzapine, palonosetron, dexamethasone; NEPD, netupitant, palonosetron, dexamethasone; PD, palonosetron, dexamethasone; NEPA300, netupitant 300 mg+palonosetron 0.5 mg; PADM, palonosetron, aprepitant, dexamethasone, metoclopramide; NR, not reported; MEC, moderately-emetogenic chemotherapy.


 PDF
PDF Citation
 Print
Print


 XML Download