INTRODUCTION
MATERIALS AND METHODS
Study Design and Participants
Data Collection
Outcomes
Statistical Analysis
RESULTS
Table 1.
| Baseline characteristics | Treated with APRVa (n=11) | Untreated with APRV (n=14) | P-valueb |
|---|---|---|---|
| Age (yr) | 70 (69–77) | 72 (69–74) | 0.647 |
| Male sex | 8 (73) | 6 (43) | 0.227 |
| Weight (kg) | 84 (78–119) | 83 (68–95) | 0.373 |
| BMI (kg/m2) | 31 (28–46) | 27 (23–37) | 0.138 |
| Day of symptoms before admission | 6 (3–10) | 8 (3–14) | 0.709 |
| Hypertension | 10 (46) | 6 (86) | 0.093 |
| Diabetes mellitus | 3 (27) | 5 (36) | 0.999 |
| No. of quadrants with infiltrates on CXR | 3 (2–4) | 4 (3–4) | 0.467 |
| APACHE II score | 16 (12–26) | 17 (13–20) | 0.467 |
| First PaO2/FiO2 ratio (mm Hg) | 151 (72–178) | 157 (137–257) | 0.347 |
| First peak inspiratory pressure (cm H2O) | 24 (22–29) | 22 (20–26) | 0.267 |
| First PEEP (cm H2O) | 12 (1–12) | 10 (10–12) | 0.851 |
| First respiratory compliance (ml/cm H2O) | 32 (23–49) | 46 (35–50) | 0.222 |
Values are presented as median (IQR) or number (%).
APRV: airway pressure release ventilation; BMI: body mass index; CXR: chest X-ray; APACHE: Acute Physiology and Chronic Health Evaluation; PaO2: arterial oxygen partial pressure; FiO2: fractional inspired oxygen; PEEP: positive end-expiratory pressure; IQR: interquartile range.
Table 2.
| Outcome | Treated with APRVa (n=11) | Untreated with APRV (n=14) | P-valueb |
|---|---|---|---|
| Pneumothorax | 1 (9)c | 0 | 0.440 |
| Subcutaneous emphysema | 1 (9)c | 0 | 0.440 |
| Intercostal catheter | 1 (9)c | 0 | 0.440 |
| Tracheostomy | 2 (18) | 1 (7) | 0.565 |
| ICU mortality | 5 (46) | 1 (7) | 0.056 |
| Hospital mortality | 5 (46) | 1 (7) | 0.056 |
| Day 90 mortality | 5 (46) | 1 (7) | 0.056 |
| Ventilator-free survival day up to day 90 after initiation of ventilation | 57 (1–72) | 82 (73–85) | 0.001 |
| Ventilator-free day among survivors | 72 (65–78) | 82 (76–85) | 0.017 |
| Total mechanical ventilation day | 12 (7–23) | 8 (4–13) | 0.107 |
| ICU stay (day) | 20 (8–27) | 11 (7–15) | 0.120 |
| Hospital stay (day) | 33 (7–42) | 19 (14–32) | 0.609 |
| Hydroxychloroquine | 0 | 2 (14) | 0.191 |
Values are presented as number (%) or median (IQR).
APRV: airway pressure release ventilation; ICU: intensive care unit; IQR: interquartile range.
a Median time to initiation of APRV from initiation of invasive mechanical ventilation was 1 day (IQR, 0–4; 4 patients on day 0, 3 patients on day 1, 1 patient each on days 3, 4, 5, and 6), and median duration of APRV use was 7 days (IQR, 6–12);
Table 3.
| Concurrent treatment | Treated with APRVa (n=11) | Untreated with APRV (n=14) | P-valueb |
|---|---|---|---|
| Azithromycin | 10 (91) | 11 (79) | 0.604 |
| Lopinavir/ritonavirc | 0 | 2 (14) | 0.174 |
| Corticosteroids | 3 (27) | 4 (29) | 0.943 |
| Vitamin C | 1 (9) | 0 | 0.250 |
| Prone ventilation | 5 (46) | 1 (7) | 0.056 |
| Day to initiation of prone ventilation from initiation of ventilation | 3 (3–5) | 2 (NA) | 0.333 |
| Nitric oxide | 5 (46) | 1 (7) | 0.050 |
| Day to initiation of nitric oxide | 3 (2–5) | 4 (NA) | 0.667 |
| Prostacyclin | 3 (27) | 0 | 0.072 |
| Day to initiation of prostacyclin | 3 (2-NA) | NA | NA |
Values are presented as number (%) or median (IQR). No patient was treated with renal replacement therapy, remdesivir, tocilizumab, anakinra, interferon 1b, or extracorporeal membrane oxygenation.
APRV: airway pressure release ventilation; NA, not applicable; IQR: interquartile range.
a Median time to initiation of APRV from initiation of invasive mechanical ventilation was 1 day (IQR, 0-4; 4 patients on day 0, 3 patients on day 1, 1 patient each on days 3, 4, 5, and 6), and median duration of APRV use was 7 days (IQR, 6–12);
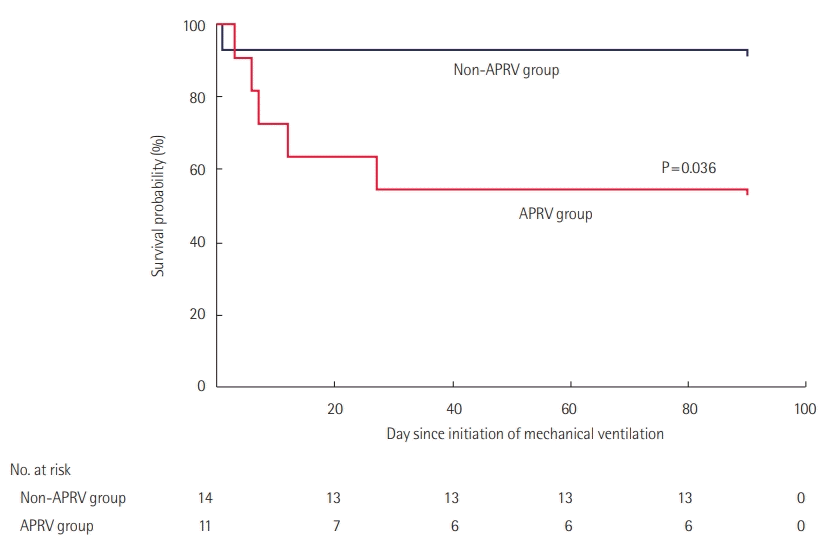
 | Figure 2. Survival curves for patients treated and untreated with airway pressure release ventilation (APRV) during their intensive care unit stay (n=25). The APRV group had a lower probability of survival to day 90 compared to the non-APRV group of mechanically ventilated patients (hazard ratio of survival, 0.17; 95% confidence interval, 0.03–0.89; P=0.036). |
Table 4.
The Hosmer-Lemeshow chi-square and Nagelkerke R2 of the model were 0.820 (P=0.999) and 0.840, respectively. Median and interquartile range of propensity scores for ICU survivors were 0.09 and 0.01–0.91, respectively, and those for ICU non-survivors were 0.95 and 0.16–0.99.
APRV: airway pressure release ventilation; CI: confidence interval; APACHE: Acute Physiology and Chronic Health Evaluation; PaO2: arterial oxygen partial pressure; FiO2: fractional inspired oxygen; CRP: C-reactive protein; CXR, chest X-ray.
Table 5.
| Covariate | HR associated with APRV in relation to survival to ICU discharge (95% CI) | P-value | HR associated with APRV in relation to survival to ICU discharge (95% CI) with adjustment for propensity score | P-value (including adjustment for propensity score) |
|---|---|---|---|---|
| APRV (yes vs. no) | 0.182 (0.06–0.584) | 0.004 | 0.03 (0.01–0.385) | 0.008 |
| APRV+APACHE II score | 0.176 (0.05–0.588) | 0.005 | 0.02 (0.01–0.316) | 0.005 |
| APRV+APACHE II score+PaO2/FiO2 ratio on initiation of mechanical ventilation | 0.08 (0.02–0.384) | 0.002 | 0.02 (0.01–0.328) | 0.007 |
| APRV+APACHE II score+PaO2/FiO2 ratio and respiratory compliance on initiation of mechanical ventilation | 0.07 (0.01–0.362) | 0.002 | 0.02 (0.01–0.334) | 0.007 |
| APRV+APACHE II score+PaO2/FiO2 ratio and respiratory compliance on initiation of mechanical ventilation+ corticosteroid therapy | 0.07 (0.01–0.356) | 0.002 | 0.02 (0.01–0.514) | 0.018 |
| APRV+ | 0.06 (0.01–0.359) | 0.002a | 0.02 (0.01–0.554) | 0.020 |
| APACHE II score+ | 0.88 (0.73–1.06) | 0.164 | 0.89 (0.73–1.08) | 0.238 |
| P/F ratio+ | 1.00 (0.99–1.01) | 0.575 | 1.00 (0.99–1.01) | 0.454 |
| Respiratory compliance on initiation MV+ | 0.99 (0.94–1.03) | 0.552 | 0.99 (0.95–1.04) | 0.645 |
| Corticosteroid therapy+ | 0.35 (0.04–3.47) | 0.371 | 0.60 (0.04–9.88) | 0.724 |
| No quadrants on CXR+ | 1.39 (0.47–4.16) | 0.554 | 1.30 (0.42–3.96) | 0.650 |
| Propensity score | Not included | - | 3.68 (0.11–119) | 0.463 |


 PDF
PDF Citation
 Print
Print


 XML Download