Journal List > Acute Crit Care > v.36(2) > 1154346

Kim, Na, Paik, Joo, and Kim: Risk factors for intensive care unit readmission after lung transplantation: a retrospective cohort study

Abstract

Background

Lung transplantation (LT) is an accepted therapeutic modality for end-stage lung disease patients. Intensive care unit (ICU) readmission is a risk factor for mortality after LT, for which consistent risk factors have not been elucidated. Thus, we investigated the risk factors for ICU readmission during index hospitalization after LT, particularly regarding the posttransplant condition of LT patients.

Methods

In this retrospective study, we investigated all adult patients undergoing LT between October 2012 and August 2017 at our institution. We collected perioperative data from electronic medical records such as demographics, comorbidities, laboratory findings, ICU readmission, and in-hospital mortality.

Results

We analyzed data for 130 patients. Thirty-two patients (24.6%) were readmitted to the ICU 47 times during index hospitalization. At the initial ICU discharge, the Sequential Organ Failure Assessment (SOFA) score (odds ratio [OR], 1.464; 95% confidence interval [CI], 1.083−1.978; P=0.013) and pH (OR, 0.884; 95% CI, 0.813−0.962; P=0.004; when the pH value increases by 0.01) were related to ICU readmission using multivariable regression analysis and were still significant after adjusting for confounding factors. Thirteen patients (10%) died during the hospitalization period, and the number of ICU readmissions was a significant risk factor for in-hospital mortality. The most common causes of ICU readmission and in-hospital mortality were infection-related.

Conclusions

The SOFA score and pH were associated with increased risk of ICU readmission. Early postoperative management of these factors and thorough posttransplantation infection control can reduce ICU readmission and improve the prognosis of LT patients.

INTRODUCTION

Lung transplantation (LT) has become an established therapeutic option for patients with end-stage lung disease over the past few decades, and it results in good functional outcomes and improves quality of life [1]. Surgical outcomes have improved with advances in surgical techniques and perioperative critical care; however, the survival rate after LT is lower than that of other organ transplants [2].
Patients who were readmitted to the intensive care unit (ICU) showed higher mortality and longer hospital length of stay compared to those who were not readmitted [3,4]. Previous studies have shown that factors associated with ICU readmission can be related to the extent of the procedure or procedure-related complications rather than preoperative underlying disease status [5-7]. This implies the importance of optimizing postoperative patient conditions for posttransplant recovery. In addition to the aforementioned conditions, postoperative infection is a particularly important issue in transplant patients, who are highly vulnerable to infection due to the inevitable use of immunosuppressants. Several studies have found that disease severity or vital signs at first ICU discharge are associated with ICU readmission [3,4]; however, consistent factors related to ICU readmission have not been established. There are studies on risk factors for rehospitalization or readmission to the ICU after hospital discharge regarding the mid- and long-term prognoses after LT. However, there is a paucity of data on the risk factors for ICU readmission during the hospitalization period immediately after LT. Therefore, the primary aim of this retrospective study was to investigate the risk factors for ICU readmission during index hospitalization period after LT, especially with regard to patient condition posttransplant.

MATERIALS AND METHODS

Study Protocol

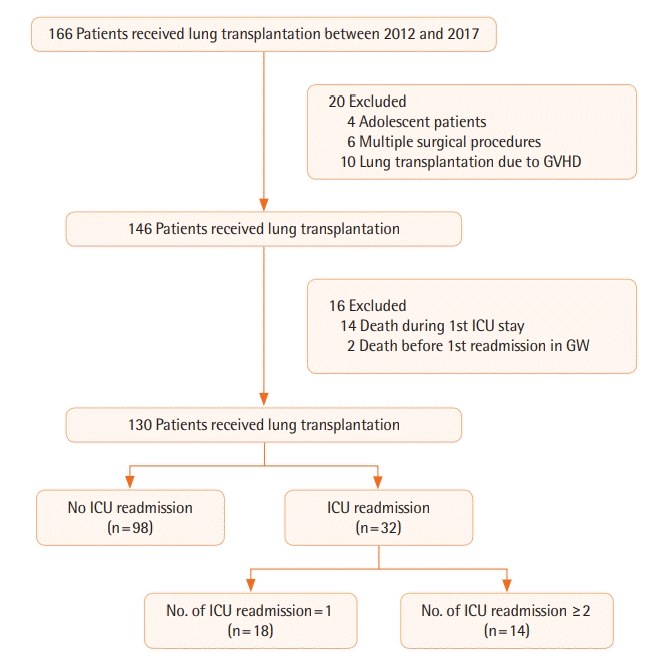
We retrospectively investigated all patients undergoing LT from October 2012 to August 2017 at Severance Hospital, Seoul, South Korea. Patients who had undergone unilateral or bilateral LT were included. The exclusion criteria were as follows: (1) adolescent patient (< 19 years), (2) concurrent other surgical procedure (e.g., heart transplantation, coronary artery bypass grafting), (3) LT due to graft-versus-host disease (GVHD), and (4) death during the first ICU stay or on the general ward (GW) after initial ICU discharge. LT patients were discharged from the ICU when their condition had been stable for longer than 24 hours and was considered to remain stable without full monitoring, which was determined by agreement of the LT team (comprising intensivists, pulmonologists, and cardiothoracic surgeons) under guarantee of caregiver support. The patients were divided into two groups based on whether or not they were readmitted to the ICU. Patients who had been readmitted to the ICU were again divided into two groups depending on number of readmissions (Figure 1).
The study protocol was approved by the Institutional Review Board of Severance Hospital (IRB No. 4-2017-0823). The Board waived the requirement for informed consent because of the retrospective nature of the study. All methods were performed in accordance with the Declaration of Helsinki.

Data Collection

We collected perioperative data from the electronic medical records of eligible patients, including demographics, past medical history, home oxygen therapy, laboratory findings, transthoracic echocardiography and pulmonary function test findings, level of education, performance status, diagnosis for LT, surgery type, and preoperative intubation or extracorporeal membrane oxygenation. Intraoperative data included operation time, intraoperative fluid intake, urine output, estimated blood loss, and transfusion of allogenic blood products. Postoperative data including the number of ICU readmissions, inhospital mortality, Sequential Organ Failure Assessment (SOFA) score, and Acute Physiology and Chronic Health Evaluation (APACHE) II score at initial ICU admission. Variables at initial ICU discharge including SOFA score, vital signs, laboratory findings, duration of mechanical ventilation, reintubation, tracheostomy, postoperative rehabilitation, and length of ICU stay also were investigated. Donor-related data provided by the Korean Network for Organ Sharing (KONOS) included donor age, sex, ratio of arterial oxygen partial pressure to fractional inspired oxygen (PaO2/FiO2 ratio), blood type, cold ischemic time, and waiting days for surgery.

Statistical Analysis

Statistical analyses were performed using SAS ver. 9.4 (SAS Institute, Cary, NC, USA). Data are shown as mean ± standard deviation, median (interquartile range), or number of patients (%). Continuous variables were tested for normality using the Kolmogorov-Smirnov test and compared using the Student t-test or the Mann-Whitney test according to normality. Categorical variables were analyzed using the chi-square test or Fisher’s exact test. Logistic regression analysis was used to detect independent risk factors for ICU readmission. The variables that yielded P-values < 0.1 in intergroup comparison of the data at initial ICU discharge were analyzed by univariable logistic regression. The variables with P-values < 0.05 in univariable logistic regression were analyzed by multivariable logistic regression using stepwise regression. For multivariable analysis, we adjusted for age, sex, performance status, and surgery type. The predictive power of the logistic regression model was assessed using the area under the receiver operating characteristic curve (AUROC). The Jonckheere–Terpstra test was used to investigate the trend of these variables in the multivariable model according to the number of ICU readmissions. The Cox proportional hazard model with time-varying covariates using stepwise regression was used to demonstrate the association between the number of ICU readmissions and in-hospital death. Except when selecting variables for univariable logistic regression analysis, P-values < 0.05 were considered statistically significant.

RESULTS

A total of 166 patients underwent LT between October 2012 and August 2017 (Figure 1). Twenty patients were excluded as follows: 4 patients were adolescents, 6 patients had undergone concurrent other surgical procedures such as heart transplantation and coronary artery bypass grafting, and 10 patients had received LT due to GVHD after bone marrow transplantation. We also excluded 14 patients who died without recovery during the first ICU stay and two patients who died on the GW due to unexpected cardiac arrest after initial ICU discharge. Finally, the data obtained from 130 adult patients who received unilateral (n = 8) or bilateral LT (n = 122) were analyzed. The median follow-up period was 47 days (interquartile range, 29−83). Among eligible patients, 32 (24.6%) were readmitted to the ICU 47 times during index hospitalization period after LT. Among patients readmitted to the ICU, 18 were readmitted to the ICU once, 13 were readmitted to the ICU twice, and 1 was readmitted to the ICU thrice. Throughout the study, we compared the readmission group (n=32) and the control group (n = 98).
Baseline characteristics of recipients are shown in Table 1. Compared to the control group, the readmission group was older (55 [45−60] vs. 62 [53−65], P = 0.003), had more unilateral LT patients (3 [3.1%] vs. 5 [15.6%], P = 0.022), and had a lower percentage of highly educated people (82 [83.7%] vs. 20 [62.5%], P = 0.024) and the proportion of unilateral LT was higher (3 [3.1%] vs. 5 [15.6%], P=0.022) in the readmission group. Forced expiratory volume in 1 second (FEV1; %) was higher (41 [28−50] vs. 51 [37−59], P = 0.013) in the readmission group; however, the FEV1 to forced vital capacity ratio was not different between the groups (P=0.815). Other preoperative characteristics, such as performance status, diagnosis for transplantation, were not different between the groups. There were no donor-related factors that differed between the groups (Table 2).
Perioperative patient data are shown in Table 3. The proportion of preoperative intubation was higher (22 [22.4%] vs. 14 [43.8%], P = 0.024) and preoperative albumin (g/dl) was lower (3.5 [2.9−4.0] vs. 3.1 [2.5−3.6], P = 0.015) in the readmission group, while the intraoperative data did not differ between the groups. Among the recipient features at initial ICU discharge, SOFA score (3 [2−4] vs. 4 [3−6], P = 0.016), serum creatinine (mg/dl; 0.42 [0.32−0.59] vs. 0.52 [0.39−0.85], P = 0.049), and the proportion of tracheostomy (34 [34.7%] vs. 19 [59.4%], P = 0.014) were higher, length of ICU stay (day) was longer (8 [6−12] vs. 10 [6−23], P = 0.017), and pH (7.460 [7.431−7.482] vs. 7.446 [7.371−7.465], P = 0.012) and albumin (g/dl; 3.1 ± 0.3 vs. 3.0 ± 0.3, P = 0.037) were lower in the readmission group (Table 4). The SOFA score (9 [7−11] vs. 10 [8−11], P = 0.295) and APACHE II score (21 [18−24] vs. 21 [17−24], P = 0.807) did not significantly differ between the groups when the patients were admitted to the ICU immediately after LT.
The variables at initial ICU discharge with P-value <0.1, which included PaCO2 (mm Hg; P = 0.051) and duration of mechanical ventilation (hour; P = 0.072), were analyzed using univariable logistic regression (Table 5). In this regression, SOFA score (odds ratio [OR], 1.547; 95% confidence interval [CI], 1.164−2.056; P = 0.003), pH (OR, 0.885; 95% CI, 0.815−0.960; P = 0.003; when the pH value increases by 0.01), PaCO2 (OR, 1.044; 95% CI, 1.003−1.087; P=0.035), albumin (OR, 0.222; 95% CI, 0.051−0.964; P = 0.045), tracheostomy (OR, 2.751; 95% CI, 1.213−6.240; P = 0.015), and length of ICU stay (OR, 1.056; 95% CI, 1.013−1.100; P = 0.010) were independent risk factors for readmission to the ICU during the hospitalization period after LT (Table 5). Variables with P-value <0.05 in univariable logistic regression were analyzed with multivariable logistic regression using stepwise selection. The multivariable model with SOFA score (OR, 1.464; 95% CI, 1.083−1.978; P = 0.013), pH (OR, 0.884; 95% CI, 0.813−0.962; P = 0.004; when the pH value increases by 0.01), and albumin (P = 0.102) yielded the best predictive power, with an AUROC of 0.739 (95% CI, 0.631−0.847; P < 0.001). The SOFA score (OR, 1.527; 95% CI, 1.065−2.190; P = 0.021) and pH (OR, 0.843; 95% CI, 0.764−0.929; P = 0.001; when the pH value increases by 0.01) were significant risk factors when adjusting for the predetermined confounding factors. Further, the predictability of the adjusted multivariable model increased to an AUROC of 0.836 (95% CI, 0.737−0.934; P < 0.001). According to the Jonckheere–Terpstra test, as the number of ICU readmissions increased, the SOFA score increased, and pH and albumin decreased (P = 0.018, P = 0.013, P = 0.034, respectively, respectively).
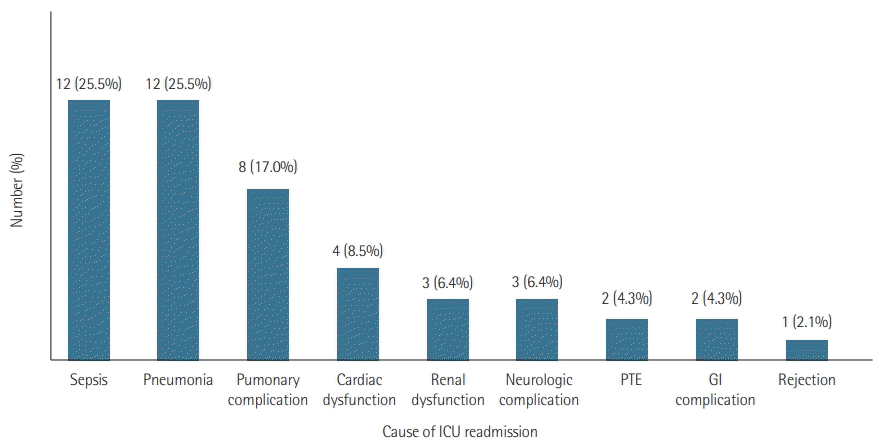
If each readmission to the ICU was considered an independent event, the total number of ICU readmissions was 47 in this study. The most common causes for ICU readmission were sepsis and pneumonia (25.5% for both), followed by pulmonary complications such as intrapulmonary bleeding and bronchopulmonary fistula (17%) and cardiac dysfunction (8.5%). These were analyzed based on the number of ICU readmissions (n = 47) (Figure 2). The median interval between initial ICU discharge and first ICU readmission was 10 days. Among 32 readmitted recipients, 11 were readmitted to the ICU within 5 days for the following causes: sepsis (45.4%), pneumonia (27.3%), and cardiac dysfunction, pulmonary thromboembolism, and renal dysfunction (9.1% for each).
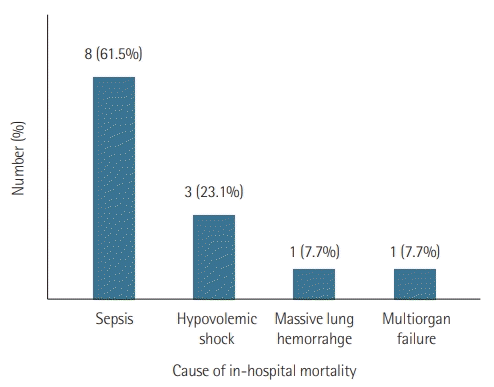
Among the 130 patients included, 13 (10%) died during index hospitalization period after LT due to sepsis (61.5%), hypovolemic shock due to gastrointestinal bleeding (23.1%), massive lung hemorrhage (7.7%), and multiorgan failure (7.7%) (Figure 3). In the Cox proportional hazard model with time-varying covariates, the number of ICU readmissions was a significant risk factor for in-hospital mortality (hazard ratio [HR], 21.34; 95% CI, 2.34−2,831.02; P = 0.003 for ICU readmission once; HR, 34.12; 95% CI, 4.10−4,450.90; P < 0.001 for ICU readmission twice or thrice), as was a lower education level (HR, 3.45; 95% CI, 1.38−9.28; P = 0.008).

DISCUSSION

In this study, 32 patients (24.6%) were readmitted to the ICU before hospital discharge after LT, which was lower than reported in an earlier study that showed an ICU readmission rate of 44% during the first 90 days after LT [8]. However, the readmission rate is higher than that observed in other studies [4,9]. Thirteen (10%) patients died during hospitalization, and the number of ICU readmissions was significantly associated with in-hospital mortality (HR, 21.34 for ICU readmission once; HR, 34.12 for ICU readmission twice or thrice) at a much stronger level than in previous reports [3,4]. The association we found suggests that it is important to prevent ICU readmission through early postoperative management in LT recipients. Therefore, it is essential to identify risk factors for ICU readmission and focus on those factors in LT patients to improve prognosis.
The SOFA score and pH on initial ICU discharge were associated with readmission to the ICU during index hospitalization. The SOFA score is a widely used tool in assessing clinical condition and response to treatment of critically ill patients [10]. The effectiveness of the SOFA score on stratification of morbidity and mortality was reconfirmed through this study. In the present study, pH was statistically lower in the readmission group (7.460 vs. 7.446; P = 0.012), though the difference was not clinically significant. PaCO2 (mm Hg), one of the factors that can affect pH, was investigated; however, it was within normal range and not statistically different between the groups (35 vs. 39; P = 0.051). Sepsis was one of the major ICU readmission causes (25.5%) and can cause metabolic acidosis. However, there were no differences in pH between patients readmitted to the ICU due to sepsis and patients readmitted to the ICU due to other causes. The lower was the pH, the higher was the ICU readmission rate; however, this finding should be interpreted cautiously, and further studies are warranted to identify the clinical usefulness and cut-off values and to clarify the factors that affect pH in posttransplant patients.
In our study, the rate of ICU readmission was higher among eight patients who received unilateral LT than among those who received bilateral LT. The patients received unilateral LT because of unfavorable conditions such as old age, small thoracic cavity with severe adhesion, and fatal arrhythmia during transplantation, which can lead to suboptimal conditions after transplantation, resulting in a high ICU readmission rate. However, the lengths of the initial and total ICU stays did not differ between patients with unilateral vs. bilateral LT (P=0.903 and P = 0.279, respectively), and in-hospital mortality did not occur in patients with unilateral LT. Patients with a lower education level were readmitted to the ICU at a higher rate, and a lower education level was a significant risk factor for in-hospital mortality (HR, 3.45) along with the number of ICU readmissions, which is in line with previous results. Level of education can be a proxy for socioeconomic status, which can influence survival and might be related to willingness to be actively treated [11,12].
Sepsis was one of the leading causes of ICU readmission along with pneumonia (25.5% for both) and the main cause of in-hospital mortality (61.5%), which was consistent with previous studies [13-15]. The results suggest that post-lung transplant infection is the most crucial factor for ICU readmission and mortality during index hospitalization. Posttransplant infection risk in LT recipients regarding immunosuppressive therapy, prophylaxis, and the infection status of donors and recipients is similar to that of other organ-transplant recipients. However, factors such as constant exposure to the various pathogens present in the environment could increase vulnerability of LT recipients to infection [16]. Therefore, post-LT infection control in patients with disrupted lymphatics and short- to long-term lung denervation, including removal of superfluous in-dwelling catheters, optimal dosing of antibiotics, and overall surveillance regarding infection control measures, is of importance to improve patient prognosis [17].
This study is subject to the following limitations. First, it was a single-center study with a relatively small study population. Therefore, our study population might not be representative of the entire LT recipient population. Second, due to the retrospective nature of the study, we cannot rule out selection bias and information bias. Moreover, the retrospective design of the study allowed us to distinguish between pneumonia and rejection; however, this is difficult to perform in clinical practice. Third, surgical techniques and teamwork on the LT team might have improved over time, which could have confounded interpretation of the data. Fourth, GVHD patients were excluded because we considered their underlying disease status as a strong confounding factor in this study. Further, we excluded patients who died during the initial ICU stay or in the GW after the initial ICU discharge; that is, patients who did not have the opportunity for ICU readmission were excluded since it would not be appropriate to include such patients in analysis of the primary outcome. However, this can be considered as excluding the patients in the worst condition.
There have been steady efforts to develop prediction models for early unpredicted ICU readmission after initial ICU discharge in various patient groups [9,18-21]. However, no consensus model is commonly used. Although this retrospective study includes a small population, it is valuable since it can help to develop a predictive model of ICU readmission after initial ICU discharge in patients undergoing LT.
In conclusion, the SOFA score and pH were independently associated with increased risk of ICU readmission after initial ICU discharge during index hospitalization after LT. Careful optimization considering these factors and thorough postsurgical infection control can reduce the ICU readmission rate and increase patient survival. Further large-scale studies are warranted to establish a predictive model that considers a larger number of factors.

KEY MESSAGES

▪ Higher Sequential Organ Failure Assessment (SOFA) score and lower pH at the initial intensive care unit (ICU) discharge were risk factors for ICU readmission during index hospitalization after lung transplantation (LT).
▪ The most common causes of ICU readmission and inhospital mortality were infection-related.
▪ Early postoperative management considering SOFA score, pH, and thorough posttransplantation infection control can reduce ICU readmission and increase survival in LT patients.

Notes

CONFLICT OF INTEREST No potential conflict of interest relevant to this article was reported.

AUTHOR CONTRIBUTIONS

Conceptualization: HBK. Data curation: HBK, HCP, HJ. Formal analysis: HBK. Methodology: HBK, JK. Project administration: JK. Visualization: HBK, JK. Writing–original draft: HBK. Writing–review & editing: SN, JK.

ACKNOWLEDGMENTS

We would like to express our great appreciation to Jinae Lee, PhD, Biometrics, DreamCIS, Seoul, Republic of Korea, for invaluable support regarding statistical analyses.

REFERENCES

1. Rutherford RM, Fisher AJ, Hilton C, Forty J, Hasan A, Gould FK, et al. Functional status and quality of life in patients surviving 10 years after lung transplantation. Am J Transplant. 2005; 5:1099–104.
crossref
2. Wolfe RA, Roys EC, Merion RM. Trends in organ donation and transplantation in the United States, 1999-2008. Am J Transplant. 2010; 10(4 Pt 2):961–72.
crossref
3. Rosenberg AL, Hofer TP, Hayward RA, Strachan C, Watts CM. Who bounces back? Physiologic and other predictors of intensive care unit readmission. Crit Care Med. 2001; 29:511–8.
crossref
4. Rosenberg AL, Watts C. Patients readmitted to ICUs: a systematic review of risk factors and outcomes. Chest. 2000; 118:492–502.
5. Snow N, Bergin KT, Horrigan TP. Readmission of patients to the surgical intensive care unit: patient profiles and possibilities for prevention. Crit Care Med. 1985; 13:961–4.
6. Metnitz PG, Fieux F, Jordan B, Lang T, Moreno R, Le Gall JR. Critically ill patients readmitted to intensive care units: lessons to learn? Intensive Care Med. 2003; 29:241–8.
7. Alban RF, Nisim AA, Ho J, Nishi GK, Shabot MM. Readmission to surgical intensive care increases severity-adjusted patient mortality. J Trauma. 2006; 60:1027–31.
crossref
8. Vigneswaran WT, Helenowski M, Bhorade SM, Lamounier F, Alex C, Garrity ER Jr. Early readmission is a predictor of overall survival following isolated lung transplantation. Int Surg. 2010; 95:299–304.
9. Jung JJ, Cho JH, Hong TH, Kim HK, Choi YS, Kim J, et al. Intensive care unit (ICU) readmission after major lung resection: prevalence, patterns, and mortality. Thorac Cancer. 2017; 8:33–9.
crossref
10. Lambden S, Laterre PF, Levy MM, Francois B. The SOFA scoredevelopment, utility and challenges of accurate assessment in clinical trials. Crit Care. 2019; 23:374.
crossref
11. Hussain SK, Lenner P, Sundquist J, Hemminki K. Influence of education level on cancer survival in Sweden. Ann Oncol. 2008; 19:156–62.
crossref
12. Hwang KT, Noh W, Cho SH, Yu J, Park MH, Jeong J, et al. Education level is a strong prognosticator in the subgroup aged more than 50 years regardless of the molecular subtype of breast cancer: a study based on the nationwide Korean breast cancer registry database. Cancer Res Treat. 2017; 49:1114–26.
crossref
13. Cohen J, Singer P, Raviv Y, Bakal I, Shitrit D, Lev S, et al. Outcome of lung transplant recipients requiring readmission to the intensive care unit. J Heart Lung Transplant. 2011; 30:54–8.
crossref
14. Alrawashdeh M, Zomak R, Dew MA, Sereika S, Song MK, Pilewski JM, et al. Pattern and predictors of hospital readmission during the first year after lung transplantation. Am J Transplant. 2017; 17:1325–33.
crossref
15. González-Castro A, Suberviola B, Llorca J, González-Mansilla C, Ortiz-Melón F, Miñambres E. Prognosis factors in lung transplant recipients readmitted to the intensive care unit. Transplant Proc. 2007; 39:2420–1.
crossref
16. Clauss HE, Bettiker RL, Samuel R, Truant AL, Jungkind D, Suh B. Infections in heart and lung transplant recipients. Clin Microbiol Newsl. 2012; 34:19–25.
crossref
17. Fishman JA. Vancomycin-resistant Enterococcus in liver transplantation: what have we left behind? Transpl Infect Dis. 2003; 5:109–11.
crossref
18. Gajic O, Malinchoc M, Comfere TB, Harris MR, Achouiti A, Yilmaz M, et al. The stability and workload index for transfer score predicts unplanned intensive care unit patient readmission: initial development and validation. Crit Care Med. 2008; 36:676–82.
crossref
19. Jo YS, Lee YJ, Park JS, Yoon HI, Lee JH, Lee CT, et al. Readmission to medical intensive care units: risk factors and prediction. Yonsei Med J. 2015; 56:543–9.
crossref
20. Uppanisakorn S, Bhurayanontachai R, Boonyarat J, Kaewpradit J. National Early Warning Score (NEWS) at ICU discharge can predict early clinical deterioration after ICU transfer. J Crit Care. 2018; 43:225–9.
crossref
21. Ouanes I, Schwebel C, Français A, Bruel C, Philippart F, Vesin A, et al. A model to predict short-term death or readmission after intensive care unit discharge. J Crit Care. 2012; 27:422. e1-9.
crossref

Figure 1.
Flow diagram of the study. GVHD: graft-versus-host disease; ICU: intensive care unit; GW: general ward.
acc-2020-01144f1.tif
Figure 2.
Causes of intensive care unit (ICU) readmission. PTE: pulmonary thromboembolism; GI: gastrointestinal.
acc-2020-01144f2.tif
Figure 3.
Cause of in-hospital mortality.
acc-2020-01144f3.tif
Table 1.
Baseline characteristics of recipients according to ICU readmission
Variable Total (n=130) Readmission
P-value
No (n=98) Yes (n=32)
Age (yr) 56 (47−62) 55 (45−60) 62 (53−65) 0.003*
Male sex 77 (59.2) 54 (55.1) 23 (71.9) 0.103
Body mass index (kg/m2) 23.1 (19.9−30.9) 22.6 (19.8−30.7) 23.4 (20.3−30.9) 0.929
Hypertension 24 (18.5) 17 (17.3) 7 (21.9) 0.603
Diabetes mellitus 24 (18.5) 15 (15.3) 9 (28.1) 0.120
Coronary artery occlusive disease 11 (8.5) 8 (8.2) 3 (9.4) >0.999
Atrial fibrillation/flutter 5 (3.8) 5 (5.1) 0 0.333
Chronic kidney disease 1 (0.8) 0 1 (3.1) 0.246
Liver cirrhosis 6 (4.6) 4 (4.1) 2 (6.2) 0.636
LVEF (%) 64±7 64±7 64±10 0.847
Pulmonary hypertension 85 (65.4) 62 (63.3) 23 (71.9) 0.402
FVC (% predicted) 41±15 39±15 46±17 0.059
FEV1 (% predicted) 43 (29−53) 41 (28−50) 51 (37−59) 0.013*
FEV1/FVC 86 (79−91) 86 (79−92) 86 (78−89) 0.815
DLCO (% predicted) 29 (23−39) 29 (23−39) 30 (21−35) 0.901
Home oxygen therapy 81 (62.3) 59 (60.2) 22 (68.8) 0.411
ECOG performance status 0.197
 0 1 (0.8) 1 (1) 0
 1 52 (40) 44 (44.9) 8 (25)
 2 17 (13.1) 13 (13.3) 4 (12.5)
 3 39 (30) 27 (27.6) 12 (37.5)
 4 21 (16.2) 13 (13.3) 8 (25)
Level of education 0.024*
 Middle school graduate or lower 28 (21.5) 16 (16.3) 12 (37.5)
 High school graduate or higher 102 (78.5) 82 (83.7) 20 (62.5)
Diagnosis 0.362
 Idiopathic pulmonary fibrosis 98 (75.4) 76 (77.6) 22 (68.8)
 Bronchiolitis obliterans 10 (7.7) 7 (7.1) 3 (9.4)
 COPD 8 (6.2) 6 (6.1) 2 (6.3)
 Bronchiectasis 6 (4.6) 4 (4.1) 2 (6.3)
 PPH 2 (1.5) 0 2 (6.3)
 Lymphangioleiomyomatosis 3 (2.3) 2 (2) 1 (3.1)
 Acute interstitial pneumonia 2 (1.5) 2 (2) 0
 Destroyed lung due to pulmonary tuberculosis 1 (0.8) 1 (1) 0
Transplantation type 0.022*
 Bilateral 122 (93.8) 95 (96.9) 27 (84.4)
 Unilateral 8 (6.2) 3 (3.1) 5 (15.6)

Values are presented as median (interquartile range), number (%), or mean±standard deviation.

ICU: intensive care unit; LVEF: left ventricular ejection fraction; FVC: forced vital capacity; FEV1: forced expiratory volume in 1 second; DLCO: diffusing capacity for carbon monoxide; ECOG: Eastern Cooperative Oncology Group; COPD: chronic obstructive pulmonary disease; PPH: primary pulmonary hypertension.

* P<0.05 between the two groups.

Table 2.
KONOS data including donor-related factors
Factor Total (n=130) Readmission
P-value
No (n= 98) Yes (n=32)
Age (yr) 44 (30−51) 44 (30−51) 46 (40−51) 0.311
Male sex 75 (57.7) 55 (56.1) 20 (62.5) 0.545
P/F ratio 446±92 454±90 421±94 0.073
Donor-recipient match
 Sex 94 (72.3) 69 (70.4) 25 (78.1) 0.498
 ABO type 111 (85.4) 87 (88.8) 24 (75.0) 0.081
Ischemia time (min) 215 (165−278) 206 (159−284) 239 (186−273) 0.301
Waiting days for transplant (day) 70 (21−148) 85 (24−166) 51 (11−106) 0.078

Values are presented as median (interquartile range), number (%), or mean±standard deviation.

KONOS: Korean Network for Organ Sharing; P/F ratio: the ratio of arterial oxygen partial pressure to fractional inspired oxygen.

Table 3.
Perioperative data of patients
Variable Total (n=130) Readmission
P-value
No (n= 98) Yes (n=32)
Preoperative data
 Preoperative intubation 36 (27.7) 22 (22.4) 14 (43.8) 0.024*
 Preoperative ECMO 18 (13.8) 14 (14.3) 4 (12.5) >0.999
 WBC (/mm3) 9,465 (7,222−1,2560) 9,575 (6,928−12,158) 8,910 (7,675−13,968) 0.638
 Neutrophil (%) 75 (67−87) 74 (66−86) 76 (67−89) 0.301
 Hemoglobin (g/dl) 12.5±2.4 12.5±2.4 12.5±2.6 0.951
 Platelet (×103/mm3) 215 (32−282) 218 (133−282) 210 (125−264) 0.511
 Creatinine (mg/dl) 0.60 (0.45−0.72) 0.6 (0.46−0.72) 0.55 (0.44−0.8) 0.787
 Albumin (g/dl) 3.4 (2.8−4.0) 3.5 (2.9−4.0) 3.1 (2.5−3.6) 0.015*
Intraoperative data
 Operation time (min) 371 (341−429) 365 (339−425) 391 (359−445) 0.196
 Fluid administration (ml) 7,075 (5,288−9,263) 7,054 (5,288−8,663) 7,525 (5,050−11,288) 0.270
 Urine output (ml) 1,090 (673-1,951) 1,048 (609-1,798) 1,173 (753-3,084) 0.260
 Estimated blood loss (ml) 1,950 (1,000−3,300) 1,755 (956−3,038) 2,325 (1,575−3,425) 0.064
Transfusion (unit)
 Red blood cell 6 (4−9) 6 (4−9) 7 (4−10) 0.274
 Fresh frozen plasma 3 (0−5) 3 (0−5) 3 (1−3) 0.862
 Platelet concentrate 5 (0−6) 5 (0−8) 6 (0−6) 0.866

Values are presented as number (%), median (interquartile range), or mean±standard deviation.

ECMO: extracorporeal membrane oxygenation; WBC: white blood cell.

* P<0.05 between the two groups.

Table 4.
Characteristics of recipients at the initial ICU discharge
Variable Total (n=130) Readmission
P-value
No (n= 98) Yes (n=32)
SOFA score 3 (2−4) 3 (2−4) 4 (3−6) 0.016*
Heart rate (bpm) 98±15 98±13 96±20 0.516
Mean arterial pressure (mm Hg) 93±12 94±11 92±13 0.625
SpO2 (%) 100 (98−100) 100 (98−100) 100 (98−100) 0.585
Body temperature (°C) 36.6 (36.5−37.0) 36.6 (36.5−37.0) 36.6 (36.5−37.1) 0.922
pH 7.454 (7.417−7.481) 7.460 (7.431−7.482) 7.446 (7.371−7.465) 0.012*
PaCO2 (mm Hg) 36 (31−42) 35 (30−41) 39 (33−45) 0.051
PaO2 (mm Hg) 113 (93−140) 110 (93−137) 124 (95−152) 0.262
P/F ratio 281 (215−359) 280 (217−355) 294 (202−365) 0.820
WBC (/mm3) 11,240 (7,970−14,580) 11,545 (8,245−14,580) 10,490 (7,750−14,440) 0.581
Neutrophil (%) 91.3 (88.5−93.3) 91.4 (88.5−93) 91.3 (87.6−93.7) 0.967
Hemoglobin (g/dl) 10.1 (9.3−11.0) 10.2 (9.5−11.0) 9.6 (9.0−11.1) 0.228
Platelet (×103/mm3) 158 (115−232) 159 (118−243) 123 (107−201) 0.259
Creatinine (mg/dl) 0.43 (0.32−0.62) 0.42 (0.32−0.59) 0.52 (0.39−0.85) 0.049*
Albumin (g/dl) 3.1±0.3 3.1±0.3 3.0±0.3 0.037*
MV duration (hr) 126 (70−288) 110 (65−273) 179 (87−349) 0.072
Reintubation 21 (16.2) 13 (13.3) 8 (25) 0.164
Tracheostomy 53 (40.8) 34 (34.7) 19 (59.4) 0.014*
Rehabilitation 66 (50.8) 49 (50.0) 17 (53.1) 0.759
ICU LOS (day) 8 (6−15) 8 (6−12) 10 (6−23) 0.017*

Values are presented as median (interquartile range), mean±standard deviation, or number (%).

ICU: intensive care unit; SOFA: Sequential Organ Failure Assessment; SpO2: peripheral oxygen saturation; PaCO2: arterial carbon dioxide partial pressure; PaO2: arterial oxygen partial pressure; P/F ratio: the ratio of arterial oxygen partial pressure to fractional inspired oxygen; WBC: white blood cell; MV: mechanical ventilation; LOS: length of stay.

* P<0.05 between two groups.

Table 5.
Risk factors for ICU readmission among factors of the initial ICU discharge
Variable Univariable
Multivariable (unadjusted)
Multivariable (adjusted)a
OR (95% CI) P-value OR (95% CI) P-value OR (95% CI) P-value
SOFA score 1.547 (1.164−2.056) 0.003* 1.464 (1.083−1.978) 0.013* 1.527 (1.065−2.190) 0.021*
pHb 0.885 (0.815−0.960) 0.003* 0.884 (0.813−0.962) 0.004* 0.843 (0.764−0.929) 0.001*
PaCO2 1.044 (1.003−1.087) 0.035*
Creatinine 1.788 (0.865−3.695) 0.117
Albumin 0.222 (0.051−0.964) 0.045* 0.267 (0.055−1.302) 0.102 0.311 (0.050−1.190) 0.207
MV duration 1.001 (1.000−1.002) 0.149
Tracheostomy 2.751 (1.213−6.240) 0.015*
ICU LOS 1.056 (1.013−1.100) 0.010*

ICU: intensive care unit; OR: odds ratio; CI: confidence interval; SOFA: Sequential Organ Failure Assessment; PaCO2: arterial carbon dioxide partial pressure; MV: mechanical ventilation; LOS: length of stay.

a Adjusted for age, sex, performance status, and surgery type;

b Results for an increase in pH value of 0.01.

* P<0.05 between two groups.

TOOLS
Similar articles