Introduction
Materials and Methods
1. Study design
2. Eligibility
3. Statistical analysis
4. Biomarker analysis
5. Ethical statement
Results
1. Patients
Table 1.
ECOG PS, Eastern Cooperative Oncology Group performance status; LDH, lactate dehydrogenase; DLBCL, diffuse large B-cell lympho-ma; PMBCL, primary mediastinal large B-cell lymphoma; PTCL-NOS, peripheral T-cell lymphoma not otherwise specified; ENKTL, extranodal NK/T-cell lymphoma; AITL, angioimmunoblastic T-cell lymphoma; MF, mycosis fungoides.
2. Efficacy
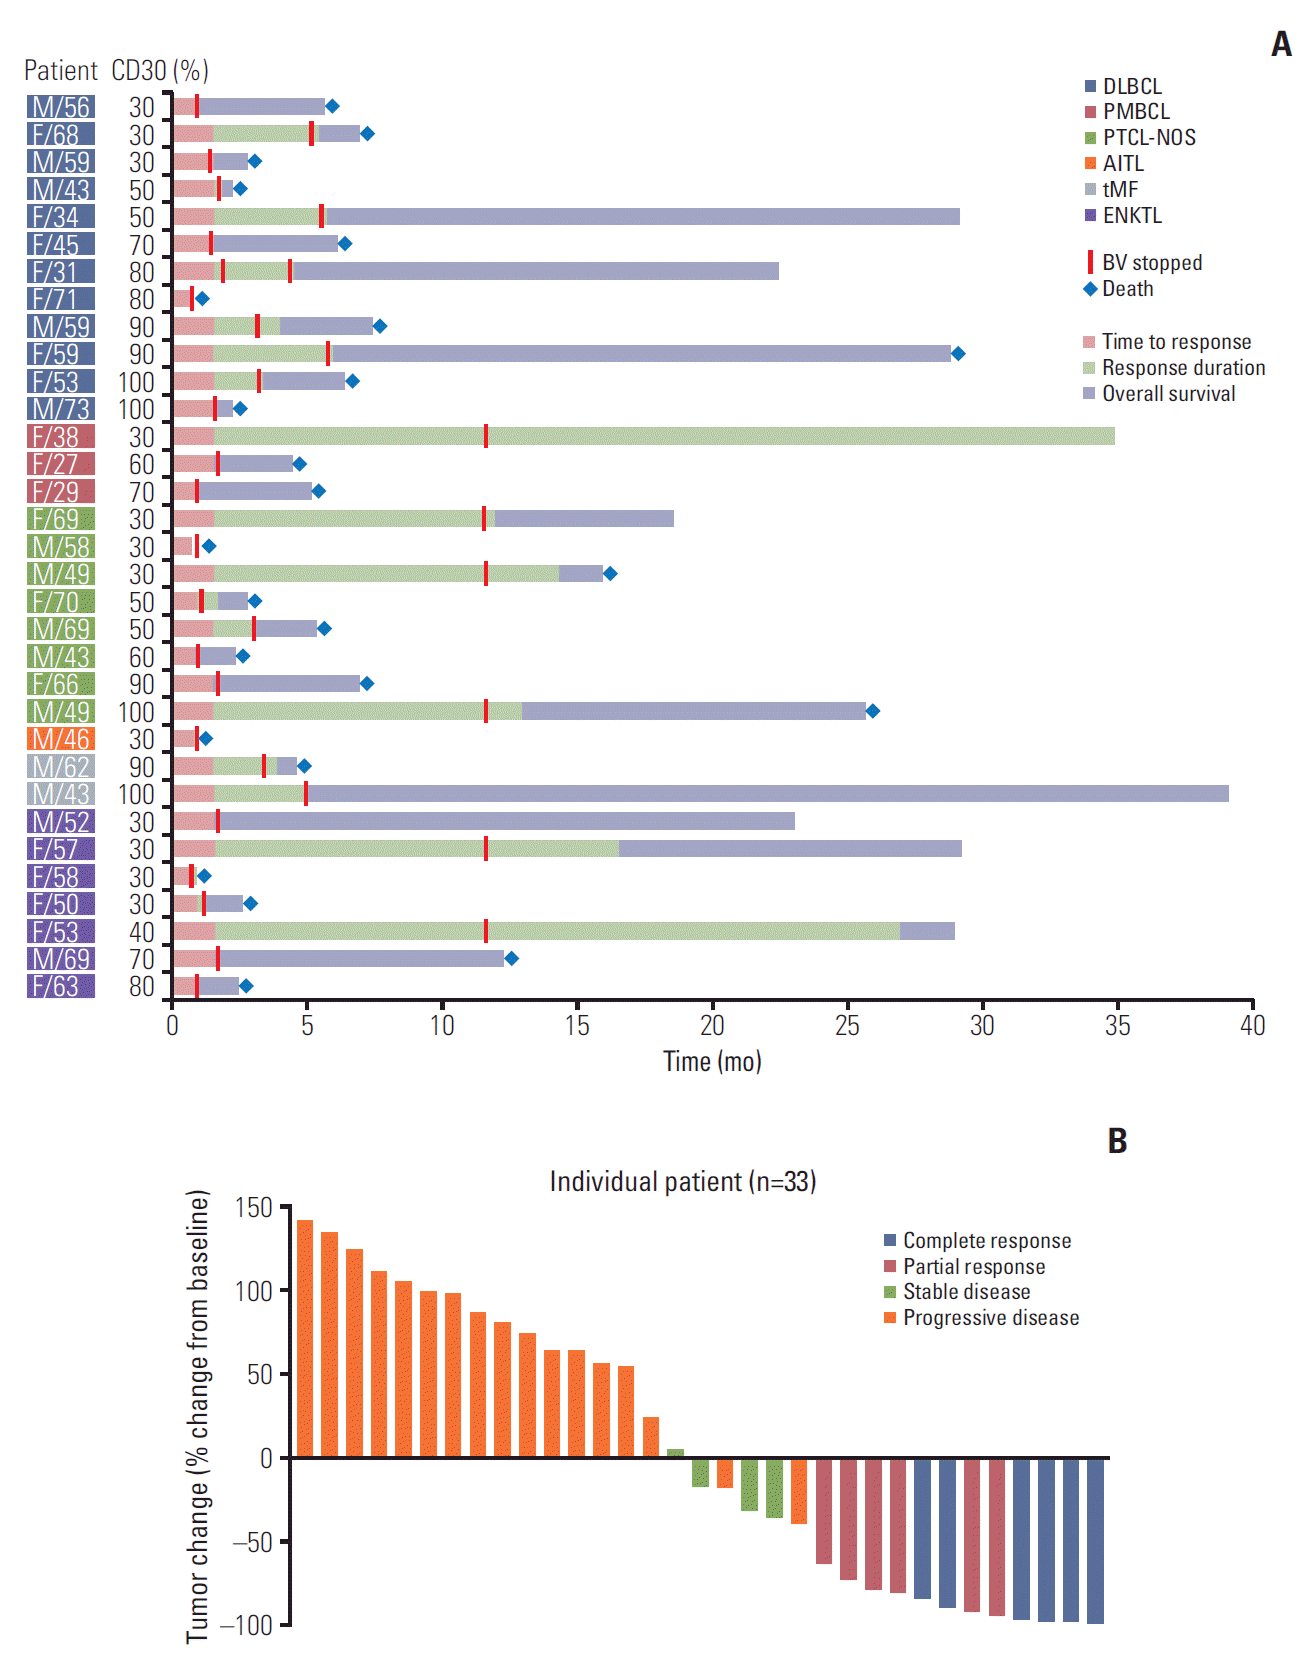
 | Fig. 1.(A) Swimmer plot for clinical course and duration of response in all patients. (B) Waterfall plot of percent change from baseline tumor size in all patients. DLBCL, diffuse large B-cell lymphoma; PMBCL, primary mediastinal B-cell lymphoma; PTCL-NOS, peripheral T-cell lymphoma not otherwise specified; AITL, angioimmunoblastic T-cell lymphoma; tMF, transformed mycosis fungoides; ENKTL, extranodal natural killer/T-cell lymphoma; BV, brentuximab vedotin. |
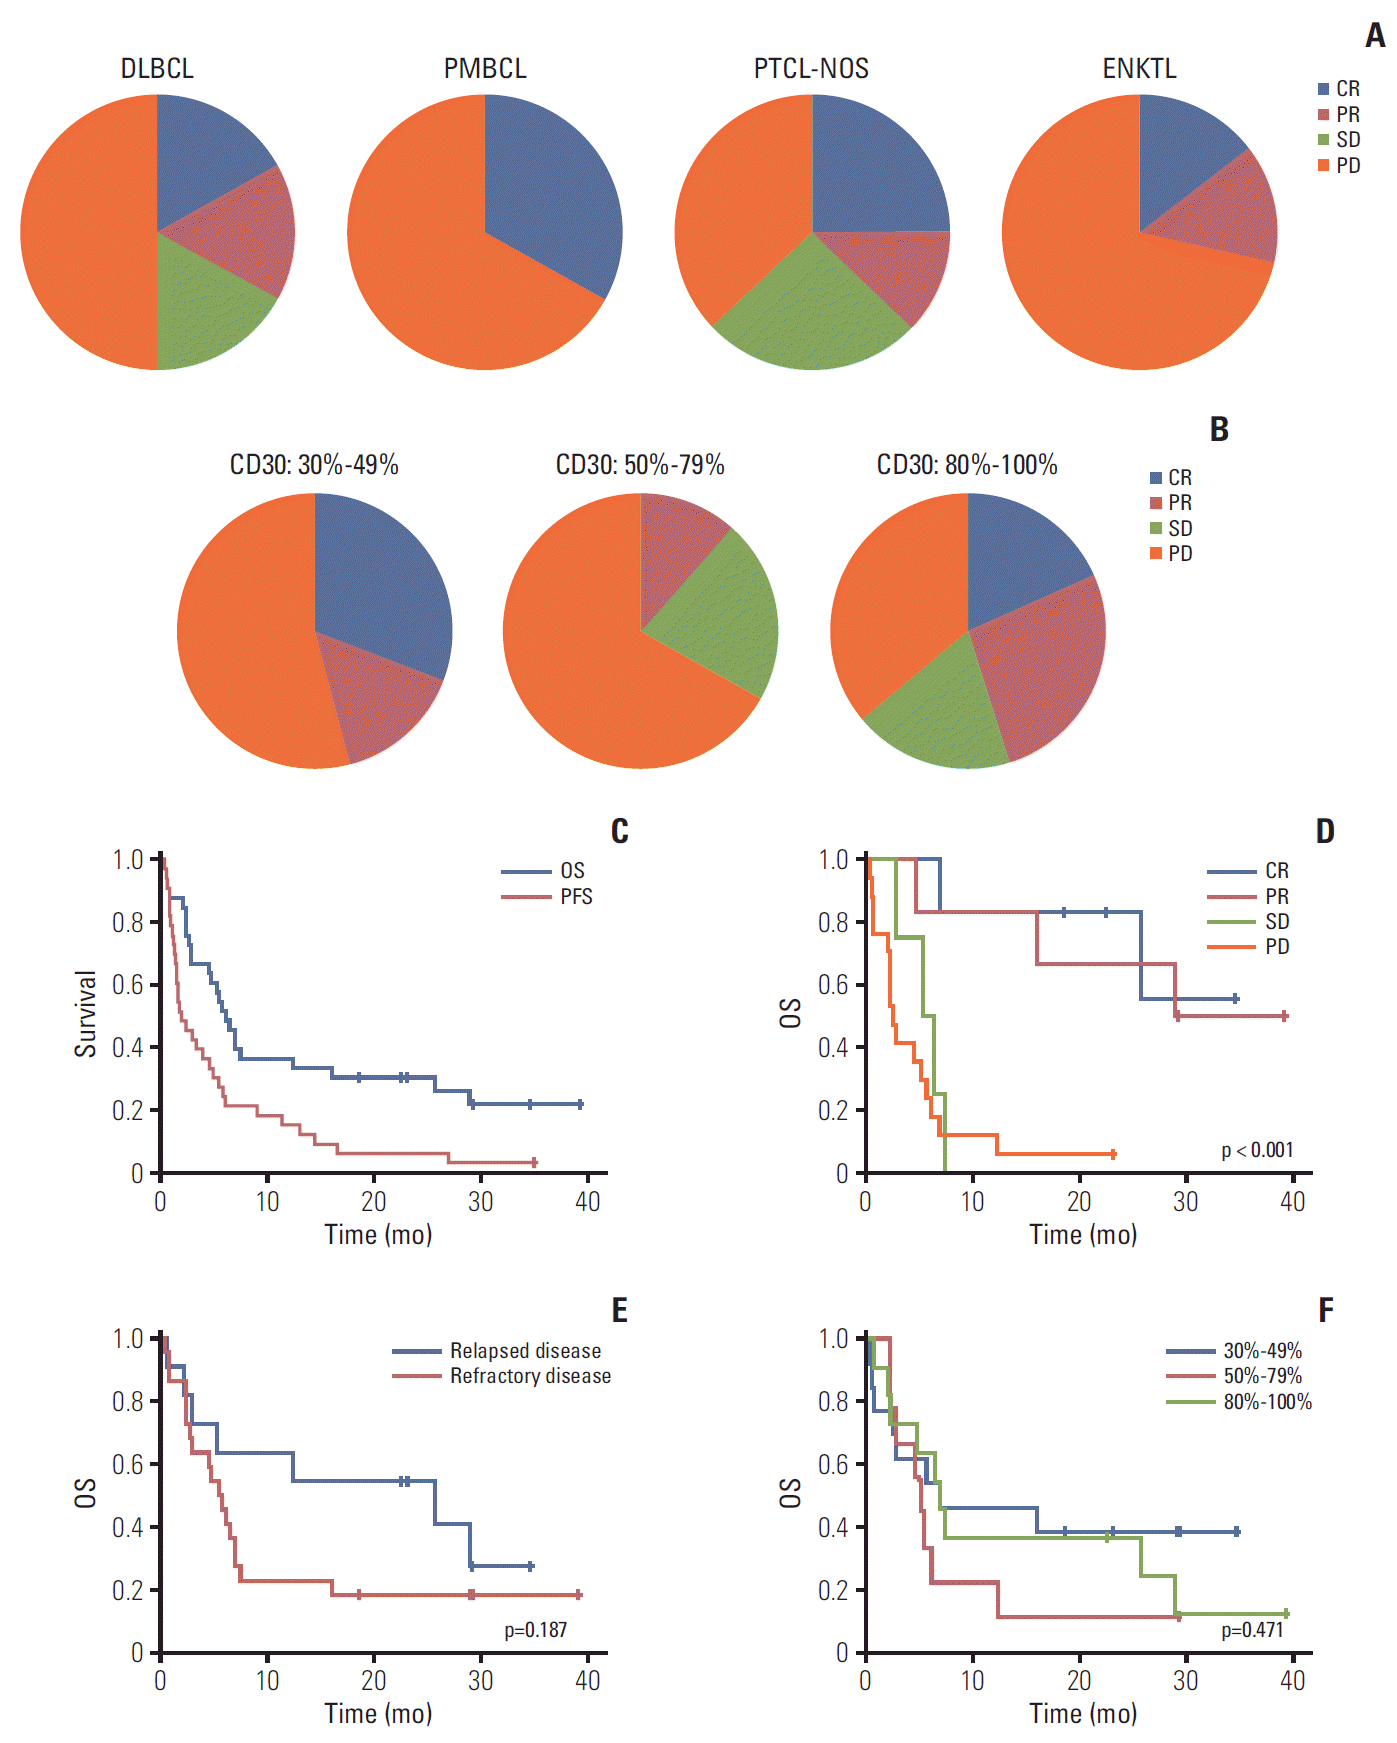
 | Fig. 2.(A) Response within each subtype. (B) Comparison of response based on percentage of CD30-positive tumor cells. (C) Progression-free survival (PFS) and overall survival (OS) for 33 patients. (D) OS between responders and nonresponders. (E) OS between relapsed and refractory patients. (F) OS based on percentage of CD30-positive tumor cells. DLBCL, diffuse large B-cell lymphoma; PMBCL, primary mediastinal B-cell lymphoma; PTCL-NOS, peripheral T-cell lymphoma not otherwise specified; ENKTL, extranodal natural killer/T-cell lymphoma; CR, complete response; PR, partial response; SD, stable disease; PD, progressive disease. |
3. CD30 expression in responding patients
4. Survival outcome
5. Adverse events
Table 2.
6. Biomarker analysis for predicting outcome of BV treatment
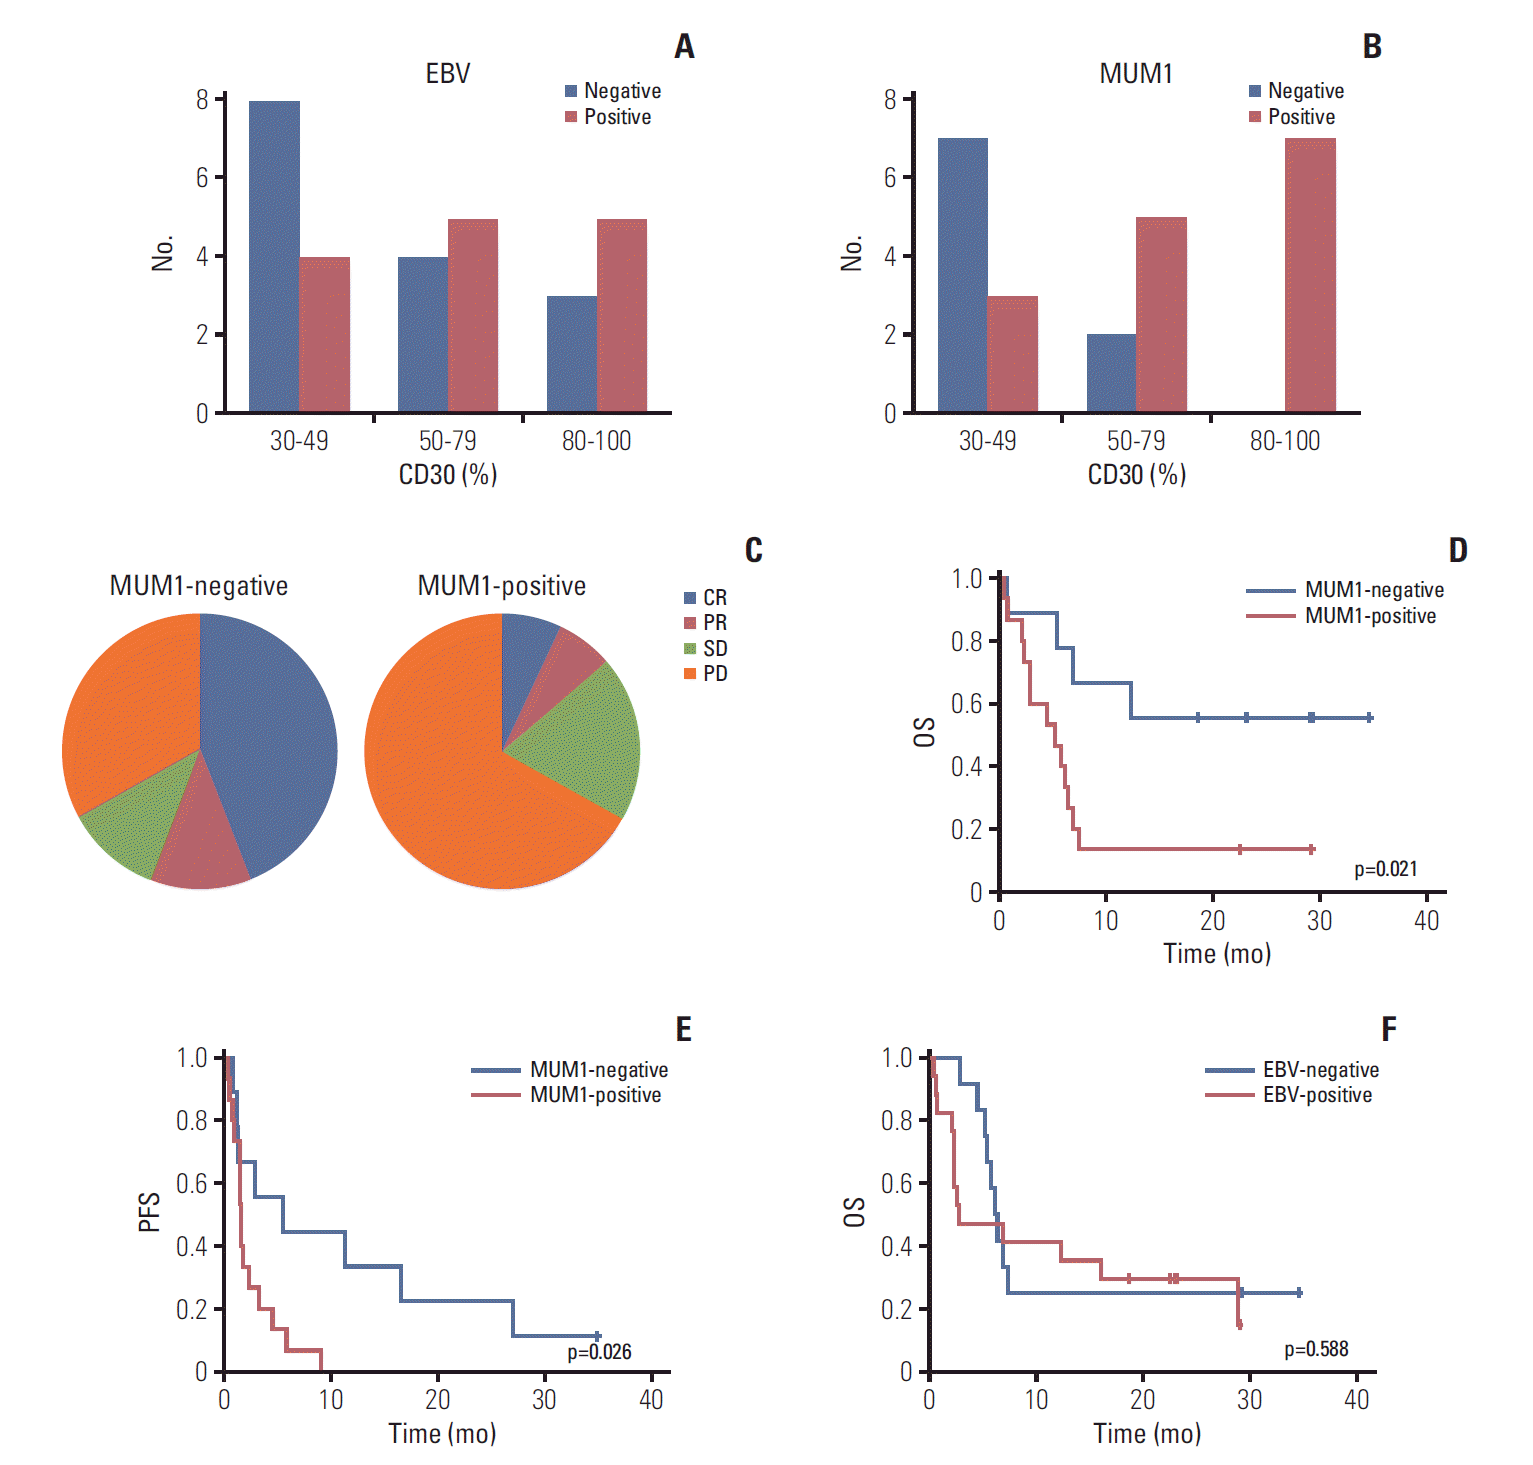
 | Fig. 3.(A) Epstein-Barr virus (EBV)–positive patients based on percentage of CD30-positive tumor cells. (B) Multiple myeloma oncogene 1 (MUM1)–negative patients based on percentage of CD30-positive tumor cells. (C) Response to brentuximab vedotin by MUM1-negative and -positive patients. (D, E) Overall survival (OS) and progression-free survival (PFS) of MUM1-negative and -positive patients. (F) OS of EBV-positive and -negative patients. |
7. Heterogeneity of response
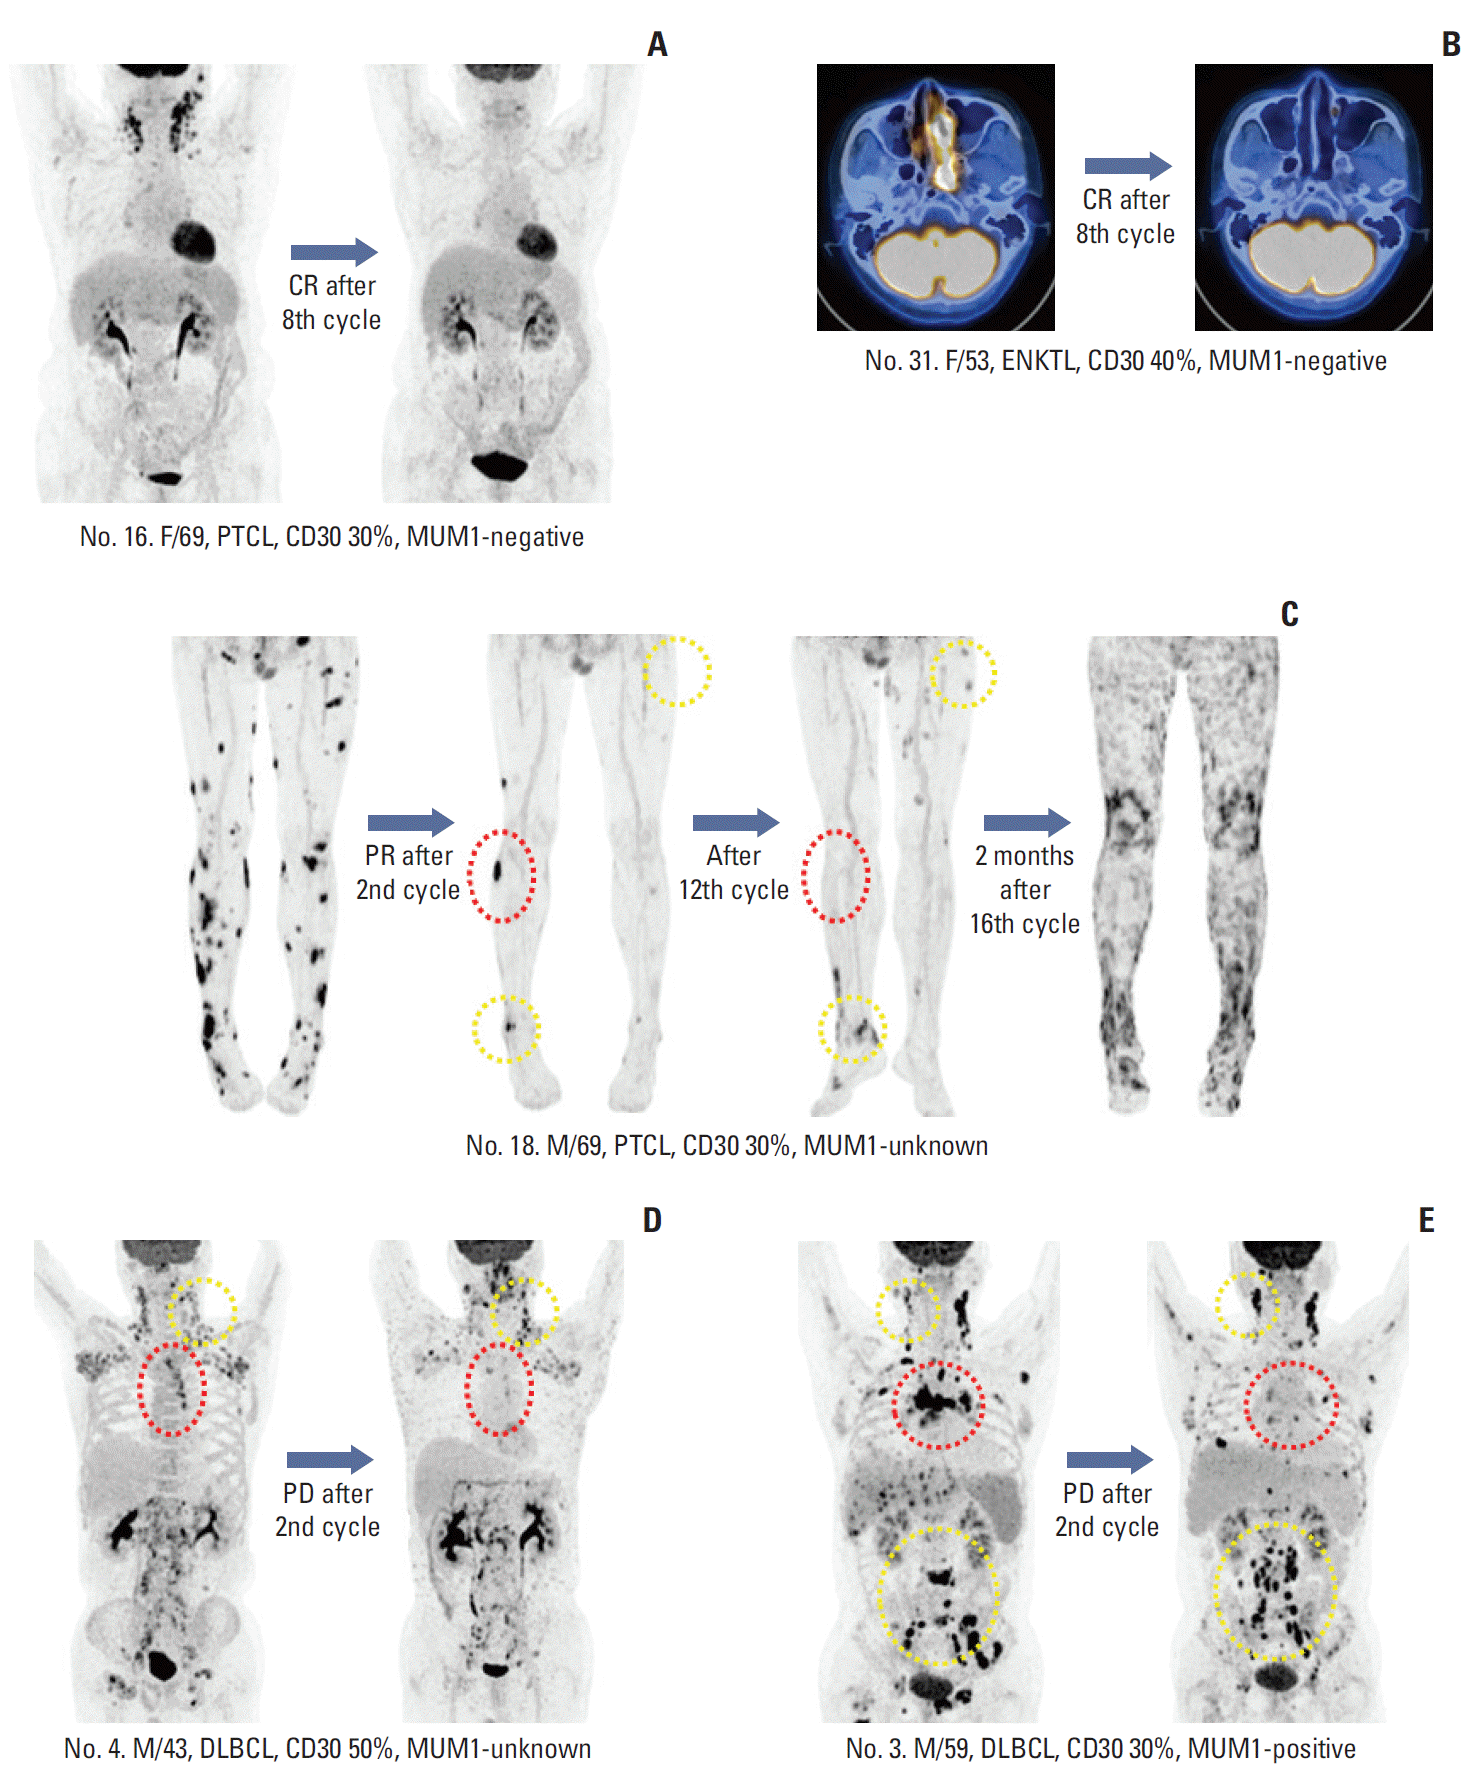
 | Fig. 4.(A, B) Patients who achieved complete response (CR) with complete disappearance of fluorine-18 deoxyglucose uptake. (C) Patient with peripheral T-cell lymphoma (PTCL) showing partial response (PR) after the second cycle. His remaining target lesions disappeared after the 12th cycle (red dotted line), although new lesions appeared (yellow dotted line). (D, E) Two patients showed progressive disease (PD) after their second cycle of brentuximab vedotin. Their responses differed based on site because several lesions disappeared (red dotted line) while others progressed (yellow dotted line). MUM1, multiple myeloma oncogene 1; ENKTL, extranodal natural killer/T-cell lymphoma. DLBCL, diffuse large B-cell lymphoma. |
Discussion
Table 3.
| Variable | DLBCL [6] | PTCL [7] | PMBCL [8] | Present study |
|---|---|---|---|---|
| No. | 49 | 35 | 15 | 33 |
| Age (yr) | 62 (17-85) | 64 (33-83) | 29 (19-73) | 56 (27-73) |
| DLBCL-NOS | 43 | - | - | 12 |
| EBV-positive DLBCL | 5 | - | - | - |
| T-cell–rich B cell | 1 | - | - | - |
| PMBCL | - | - | 15 | 3 |
| PTCL | - | 22 | - | 8 |
| AITL | - | 13 | - | 1 |
| ENKTL | - | - | - | 7 |
| Transformed MF | - | - | - | 2 |
| ECOG PS 0/1 | 45 (91.8) | 30 (85.7) | Not reported | 33 (100) |
| CD30+ cell | 25 (0-100) | Not reported | Not reported | 30 (30-100) |
| Stage III/IV | 35 (71.4) | 27 (77.1) | 8 (53.3) | 26 (79) |
| Refractory to most recent prior therapy | 40 (81.6) | 22 (62.8) | 11 (73.3) | 22 (67) |
| No. of previous treatments | 3 (1-6) | 2 (1-9) | 3 (1-4) | 3 (2-10) |
| Previous ASCT | 10 (20.4) | 3 (9) | 8 (53) | 7 (21.2) |
| Disease control rate | 32/48 (66.7) | 20/34 (58.8) | 3/15 (20.0) | 16/33 (48.4) |
| Objective response rate | 21/48 (43.7) | 14/34 (41.1) | 2/15 (13.3) | 12/33 (36.3) |
| CR rate | 8/48 (16.7) | 8/34 (23.5) | 0 | 6/33 (18.1) |
| Progression-free survival (mo) | 4.0 (0.6-24) | 2.6 (not reported) | - | 1.9 (0.4-35.0) |
| Duration of response (mo) | 5.6 (0.0-22.7) | 7.6 (1.3-14) | < 3-4 | 6.0 (3.9-35.0) |
| Duration of complete response (mo) | 16.6 (2.7-22.7) | Not reported | - | 11.3 (4.5-35.0) |
Values are presented as median (range) or number (%). DLBCL, diffuse large B-cell lymphoma; PTCL, peripheral T-cell lymphoma; PMBCL, primary mediastinal large B-cell lymphoma; NOS, not otherwise specified; EBV, Epstein-Barr virus; AITL, angioimmunoblastic T-cell lymphoma; ENKTL, extranodal NK/T-cell lymphoma; MF, mycosis fungoides; ECOG PS, Eastern Cooperative Oncology Group performance status; ASCT, autologous stem cell transplantation; CR, complete response.


 PDF
PDF Citation
 Print
Print


 XML Download