Abstract
Purpose
Although imatinib-induced hepatotoxicity may aggravate the patient’s clinical condition and alter the treatment plan, the underlying mechanism of and factors influencing imatinib-induced hepatotoxicity have rarely been investigated. The purpose of this study was to investigate factors affecting on the incidence of hepatotoxicity within 90 days after starting imatinib treatment and time to onset of imatinib-induced hepatotoxicity.
Materials and Methods
We retrospectively evaluated the records of 177 patients receiving imatinib from October 2012 to September 2017. The analyzed factors included sex, age, body weight, body surface area, underlying disease, and concomitant drugs.
Results
The proportion of patients with hepatotoxicity within 90 days after imatinib administration was 33.9%. Proton pump inhibitors (PPIs) increased the incidence of hepatotoxicity approximately 3.8-fold and doubled the hazard of time to reach hepatotoxicity. Patients with liver disease or hepatitis B virus (HBV) carriers had a more than 8-fold higher risk of hepatotoxicity and a 5.2-fold increased hazard of hepatotoxicity compared to those without liver disease or HBV. Patients with body weight under 55 kg had a 2.2-fold higher risk for occurrence of hepatotoxicity. Patients with an imatinib dose > 400 mg had a 2.3-fold increased hazard of time to reach hepatotoxicity compared to those with an imatinib dose ≤ 400 mg.
Imatinib is the first tyrosine kinase inhibitor (TKI) approved for the treatment of chronic myeloid leukemia (CML), Philadelphia chromosome-positive acute lymphoblastic leukemia (ALL), and gastrointestinal stromal tumors (GIST) [1]. Its mechanism of action involves preventing the phosphorylation of the cell cycle-regulating substrate by occupying the adenosine triphosphate-binding site of several tyrosine kinase molecules including Bcr-Abl, c-KIT, and platelet-derived growth factor receptors (PDGFRα and PDGFRβ) [2,3].
Various adverse effects of imatinib have been reported. The common adverse effects include nausea, fluid retention, muscle cramps, diarrhea, and vomiting, which are generally mild to moderate in severity and manageable [2]. Elevated alanine aminotransferase (ALT) and aspartate aminotransferase (AST) is another important adverse effect although it occurs relatively less frequently [4]. Clinical studies have reported that the incidence of a grade Ⅱ or higher abnormality in serum aminotransferases was about 5% and the incidence of grade Ⅲ-Ⅳ elevation was 1.0% to 5.1% [2,5,6].
Hepatotoxicity of imatinib could aggravate the patient’s clinical condition and alter the patient’s treatment plan. Permanent imatinib discontinuation due to hepatotoxicity is necessary in 0.5% of patients [6]. Fatal cases associated with severe hepatotoxicity have been reported including acute hepatitis, severe hyperbilirubinemia, and focal necrosis, which led to liver failure and death [7,8]. Therefore, the identification of risk factors for imatinib-induced hepatotoxicity could reduce the occurrence of hepatotoxicity, thereby preventing progression to chronic liver disease and/or acute liver failure. However, the factors for imatinib-induced hepatotoxicity have rarely been investigated.
In general, it was reported that 62% of drug-induced hepatotoxicity cases occurred within one month from medication commencement [9]. In the case of imatinib, a review article described that the elevation of transaminase levels were generally observed during the first 2-3 months after imtinib initiation [10]. In addition, another study showed that the latency to onset of hepatic injury by imatinib was 12 to 77 days [11]. Based on such information from previous literature regarding the onset of imatinib-induced hepatotoxicity, the aim of this study was to investigate factors affecting the incidence of hepatotoxicity within 90 days after starting imatinib treatment and time to onset of imatinib-induced hepatotoxicity.
This retrospective study was performed using medical records from October 2012 to September 2017 at Seoul National University Hospital, Korea. Eligible patients were older than 18 years and received imatinib for treatment of Philadelphia chromosome-positive ALL, CML, GIST, and other malignancies. Patients were excluded if they already had elevated AST/ALT or were concurrently receiving hepatotoxic anti-cancer drugs such as cyclophosphamide, cytarabine, etoposide, methotrexate, and vincristine.
The following demographic and clinical data were collected: sex, age, body weight, body surface area (BSA), underlying disease, imatinib daily dose, and concomitant medications. Concomitant medications included cytochrome P450 (CYP) 3A4 inhibitors, CYP3A4 inducers, H2-antagonists, and proton pump inhibitors (PPIs). CYP3A4 inhibitors included aprepitant, ciprofloxacin, fluconazole, nicardipine, nifedipine, posaconazole, and tamoxifen. CYP3A4 inducers included clarithromycin, dexamethasone, and rifampicin (rifampin). H2-antagonists included famotidine and ranitidine. PPIs included (es)omeprazole, lansoprazole, and pantoprazole.
Patients received imatinib (dose range, 100 to 800 mg/day) orally. Serum AST and ALT levels were obtained before initiation of therapy and every month thereafter. The hepatotoxicity grade was determined using Common Terminology Criteria for Adverse Events (CTCAE), ver. 4.0. The CTCAE defines grade Ⅰ, grade Ⅱ, grade Ⅲ, and grade Ⅳ toxicity levels of AST and ALT as 1 to 3 times, 3 to 5 times, 5 to 20 times, and more than 20 times the upper limit of normal, respectively. In this study, hepatotoxicity was defined as grade I or higher.
The chi-square or Fisher exact test was used to compare categorical variables between patients with and without hepatotoxicity. Multivariate logistic regression analysis was used to identify independent risk factors for hepatotoxicity. Factors having a p-value less than 0.2 from the univariate analysis along with the strong confounders of sex, age, and BSA were included in the multivariate analysis. Odds ratio (OR) and adjusted OR were estimated from univariate and multivariate analyses, respectively. Attributable risk (%) was calculated as (1–1/OR)×100. The time to reach hepatotoxicity was analyzed using Kaplan-Meier survival curves and the log-rank test. The Cox proportional-hazards model was used for the multivariate analysis. Factors having a p-value less than 0.2 from the univariate analysis along with the strong confounders of sex, age, and BSA were included in the multivariate analysis. Hazard ratio (HR) and adjusted HR were calculated from the univariate and multivariate analyses, respectively. p-values less than 0.05 were considered statistically significant.
To test the model’s goodness of fit, we performed a Hosmer-Lemeshow test. Discrimination of the model was further analyzed by the area under the receiver operating characteristic curve (AUROC) to assess the ability of the risk factor to predict hepatotoxicity related to imatinib administration. All statistical analyses were performed with the SPSS ver. 20.0 for Windows (IBM Corp., Armonk, NY).
A total of 301 patients treated from October 2012 to September 2017 were eligible for participation in the study. We excluded patients who did not have AST/ALT level results before administration of imatinib (n=4) and who had elevated AST/ALT levels on the first day of imatinib administration (n=98). Patients who received concomitant anti-cancer drugs were also excluded (n=22). Consequently, data from 177 patients with imatinib administration were analyzed.
As shown in Table 1, 101 patients (57.1%) were older than 60 years (age range, 21 to 90 years). Approximately 51% of the study patients were male. Drugs concurrently administered with imatinib were CYP3A4 inducers (n=1), CYP3A4 inhibitors (n=4), H2-antagonists (n=16), PPIs (n=18), and any of the two anti-acid secreting agents (H2-antagonist/PPI, n=32). The proportion (number) of patients with hepatotoxicity within 90 days after initiation of imatinib administration was 33.9% (n=60). Among 60 patients with hepatotoxicity, the number of patients with grade II and grade III hepatotoxicity was three each, while the other 54 patients experienced grade I hepatotoxicity. In the univariate analysis, co-administration of PPIs, body weight under 55 kg, and presence of liver disease or hepatitis B virus (HBV) were significant factors for hepatotoxicity within 90 days.
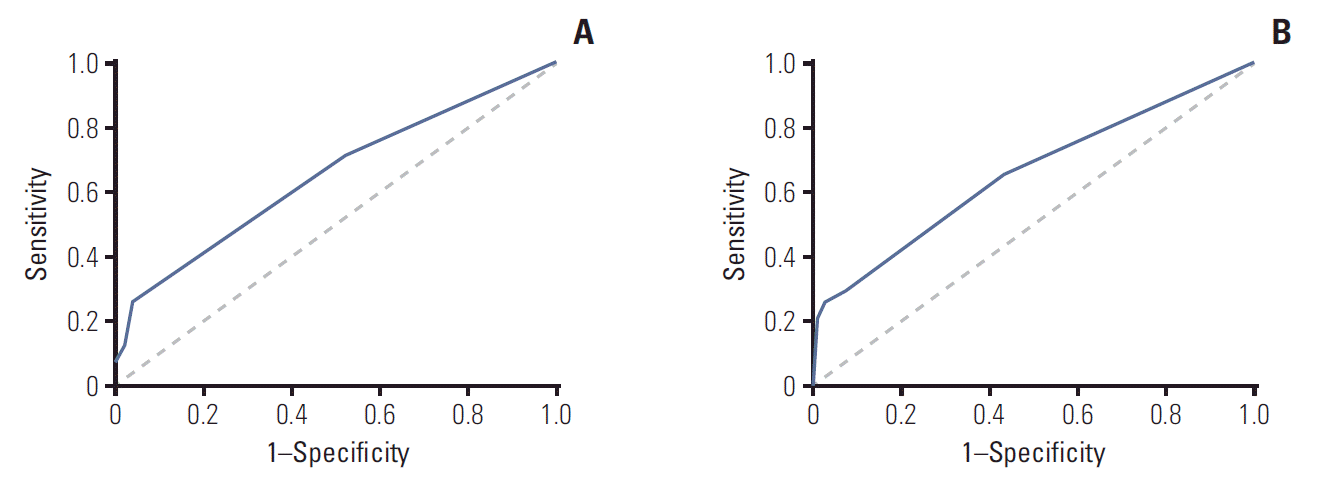
Univariate analysis showed that patients who took PPIs with imatinib had a 3.5-fold increased incidence of hepatotoxicity than those not using PPIs (Table 2). Also, patients with body weight < 55 kg had a 2.3-fold increased incidence of hepatotoxicity than those with body weight ≥ 55 kg. Presence of liver disease or HBV increased hepatotoxicity by 3.7 times. Because BSA and body weight are co-related, two models were conducted for multivariate analysis. Model I included the presence of liver disease or HBV and PPIs in addition to sex, age, and BSA; model II included body weight instead of BSA. Based on both models, PPIs and the presence of liver disease or HBV increased the incidence of hepatotoxicity approximately 3.8-fold and 8.5-fold, respectively, after controlling for variables with p-values less than 0.2 from the univariate analysis. Patients with body weight under 55 kg had a 2.2-fold increased incidence of hepatotoxicity. The Hosmer-Lemeshow test for multivariate models revealed good fit (χ2=0.395, p=0.821 for model I and χ2=4.201, p=0.122 for model II). As shown in Fig. 1, the AUROC was 0.650 (95% confidence interval [CI], 0.559 to 0.740) for model I and 0.657 (95% CI, 0.566 to 0.748) for model II.
Among the 177 patients, 100 patients who had hepatotoxicity during the study period were evaluated for time to reach hepatotoxicity. The median time to hepatotoxicity was 70 days. Presence of liver disease or HBV and daily imatinib dose greater than 400 mg were significant factors for time to hepatotoxicity (Table 3). Multivariate analysis showed that patients taking PPIs and patients with liver disease or HBV had an approximately 2.1- and 5.2-fold increased hazard of hepatotoxicity compared to those not taking PPIs and without liver disease or HBV, respectively (Table 4). Patients who received an imatinib dose > 400 mg had a 2.3-fold increased hazard of hepatotoxicity compared to those with an imatinib dose ≤ 400 mg.
The results of this study showed that PPIs and the presence of liver disease or HBV were significant factors for hepatotoxicity within 90 days after imatinib initiation and the hazard of time to reach hepatotoxicity. PPI use increased the incidence of hepatotoxicity around 3.8-fold and the hazard of time to reach hepatotoxicity 2.1-fold. Patients with liver disease or HBV carriers had more than 8-fold higher risk of hepatotoxicity and 5.2-fold increased hazard of time to hepatotoxicity compared to patients without liver disease or HBV. Patients with body weight under 55 kg had a 2.2-fold higher risk for occurrence of hepatotoxicity. Patients who received imatinib at a dose larger than 400 mg had 2.3-fold increased hazard of time to reach hepatotoxicity compared with those who received imatinib at a dose of 400 mg or less.
The presence of liver disease or HBV was a significant factor for the incidence of hepatotoxicity within 90 days. Patients with pre-existing elevated AST/ALT values were excluded from the study; the patients included in this study who had liver disease or who were HBV carriers had normal AST/ALT levels before imatinib administration. There is limited previous research on imatinib-induced hepatotoxicity in patients with hepatic impairment. However, because imatinib is metabolized in the liver, the plasma concentration of imatinib may be increased in patients with liver disease or who are HBV carriers [3]. A clinical study showed that the mean maximum concentration (Cmax)/dose of imatinib and area under the curve (AUC)/dose of imatinib in patients with severely impaired liver function increased by approximately 63% and 45%, respectively [12]. The presence of liver disease or HBV may increase the exposure of imatinib, which can lead to hepatotoxicity.
Body weight under 55 kg and dose larger than 400 mg resulted in a significantly higher occurrence of hepatotoxicity and hazard of time to hepatotoxicity. The incidence of hepatotoxicity approximately doubled in patients who received imatinib > 400 mg compared to those who received ≤ 400 mg, although statistical significance was not obtained. The dose of imatinib is usually determined by disease diagnosed and the phase of disease, not by body weight or BSA [12]. According to the report of a phase III study comparing the effects of high-dose imatinib (800 mg daily) and conventional dose imatinib (400 mg daily) in patients with unresectable or metastatic GIST, patients in the high-dose arm experienced more severe adverse events including hepatic toxicity [13]. Another study showed that there was an inverse correlation between steady-state trough levels of imatinib and body weight [14]. Therefore, it is logical that patients who have lower body weight may experience more drug-induced toxicity.
Imatinib is known to be a substrate of ABCB1 and as both a substrate and inhibitor of ABCG2, the adenosine triphosphate-binding cassette transporters [15,16]. ABCG2 acts as a drug-efflux pump and is expressed in various normal tissues including the liver [17,18]. Use of an ABCG2 inhibitor can increase the concentration of ABCG2 substrates in tissues. PPIs, which are ABCG2 inhibitors, can increase the concentration of the imatinib in the liver, thereby leading to hepatotoxicity. In addition, PPI itself can cause hepatotoxicity, although only a case report is available for evidence [19].
Other anti-acid secreting agents, H2-antagonists, are not only substrates of ABCB1 but also inhibitors. In the liver and the gastrointestinal tract, ABCB1 mediates drug export for protecting the organs [20]. However, unlike PPIs, concomitant administration of H2-antagonists was not a significant factor for hepatotoxicity in our study, possibly due to other roles of H2-antagonists relevant to imatinib metabolization, including inhibiting organic cation transporters (OCTs).
Imatinib is transported into cells via the OCT proteins, members of the solute carrier superfamily [21,22]. Among them, OCT1 influx protein is known to play a major role in mediating the uptake of imatinib [21,22]. According to the report of a previous study using cell-lines, imatinib is transported by ABCB1 and human OCT1 (hOCT1), and hOCT1 inhibitors including verapamil, amantadine, procainamide, and prazosin decreased the uptake of imatinib [22]. The H2-antagonists, such as ranitidine and famotidine used by patients in this study, are hOCT1 inhibitors [23]. Co-administration of H2-antagonists with imatinib may initially decrease the intracellular exposure of imatinib by inhibition of OCT1, thereby reducing not only therapeutic efficacy but also adverse effects including hepatotoxicity [24,25].
Meanwhile, it has been reported that anti-secreting agent such as PPIs and H2-antagonists can reduce the absorption of many TKIs such as nilotinib, gefitinib, and erlotinib by elevating the gastric pH [26]. However, imatinib is known to be affected minimally by acid-reducing agents. The concomitant administration of omeprazole and antacid did not significantly change the AUC or Cmax of imatinib [26].
Plasma concentration of imatinib is influenced by CYP3A4 inducers or inhibitors because imatinib is predominantly metabolized by CYP3A4 [2,27]. Co-administration of ketoconazole, a selective CYP3A4 inhibitor, significantly increased mean Cmax and area under the curve at 24 hours (AUC24) of imatinib by 26% and 40%, respectively [28]. A study revealed that concomitant use of rifampicin, a strong CYP3A4 inducer, decreased imatinib Cmax and AUC24 by 54% and 68%, respectively [29]. In contrast, our study failed to demonstrate that CYP3A4 inducers/inhibitors affected incidence of hepatotoxicity and time to reach hepatotoxicity. This was probably because of the small sample size; only one patient was concomitantly treated with a CYP3A4 inducer and four with a CYP3A4 inhibitor.
The Hosmer-Lemeshow test results showed that the fit of the model for factors on increasing risk of hepatotoxicity was satisfactory. Limitations of this study relate to its retrospective single-center design. In addition, most (90%) patients had grade Ⅰ hepatotoxicity, which may not affect clinical practices. However, to our knowledge, this is the first study to investigate factors influencing imatinib-induced hepatotoxicity. Further prospective studies involving a larger number of patients and multicenter design are needed to confirm these findings and determine factors for high-grade hepatotoxicity.
In conclusion, this study showed that the presence of liver disease or HBV and the concomitant use of PPIs were associated with imatinib-induced hepatotoxicity. Considering that this is a retrospective single-center study, our findings require confirmation through a large, prospective multicenter study.
References
1. Zhuang W, Xie JD, Zhou S, Zhou ZW, Zhou Y, Sun XW, et al. Can therapeutic drug monitoring increase the safety of Imatinib in GIST patients? Cancer Med. 2018; 7:317–24.
2. Cohen MH, Williams G, Johnson JR, Duan J, Gobburu J, Rahman A, et al. Approval summary for imatinib mesylate capsules in the treatment of chronic myelogenous leukemia. Clin Cancer Res. 2002; 8:935–42.
3. Peng B, Lloyd P, Schran H. Clinical pharmacokinetics of imatinib. Clin Pharmacokinet. 2005; 44:879–94.
4. O'Brien SG, Guilhot F, Larson RA, Gathmann I, Baccarani M, Cervantes F, et al. Imatinib compared with interferon and low-dose cytarabine for newly diagnosed chronic-phase chronic myeloid leukemia. N Engl J Med. 2003; 348:994–1004.
5. Dematteo RP, Ballman KV, Antonescu CR, Maki RG, Pisters PW, Demetri GD, et al. Adjuvant imatinib mesylate after resection of localised, primary gastrointestinal stromal tumour:a randomised, double-blind, placebo-controlled trial. Lancet. 2009; 373:1097–104.
6. Johnson JR, Bross P, Cohen M, Rothmann M, Chen G, Zajicek A, et al. Approval summary: imatinib mesylate capsules for treatment of adult patients with newly diagnosed philadelphia chromosome-positive chronic myelogenous leukemia in chronic phase. Clin Cancer Res. 2003; 9:1972–9.
7. Mindikoglu AL, Regev A, Bejarano PA, Martinez EJ, Jeffers LJ, Schiff ER. Imatinib mesylate (gleevec) hepatotoxicity. Dig Dis Sci. 2007; 52:598–601.
8. Kong JH, Yoo SH, Lee KE, Nam SH, Kwon JM, Lee SM, et al. Early imatinib-mesylate-induced hepatotoxicity in chronic myelogenous leukaemia. Acta Haematol. 2007; 118:205–8.
9. Takikawa H. Recent status of drug-induced liver injury and its problem in japan. Jpn Med Assoc J. 2010; 53:243–7.
10. Guilhot F. Indications for imatinib mesylate therapy and clinical management. Oncologist. 2004; 9:271–81.
11. Shah RR, Morganroth J, Shah DR. Hepatotoxicity of tyrosine kinase inhibitors: clinical and regulatory perspectives. Drug Saf. 2013; 36:491–503.
12. Highlights of prescribing information: Gleevec (imatinib mesylate) [Internet]. East Hanover, NJ: Novartis Pharmaceuticals Corporation;2018. [cited 2018 Nov 5]. Available from: https://www.accessdata.fda.gov/drugsatfda_docs/label/2018/021588s053lbl.pdf.
13. Blanke CD, Rankin C, Demetri GD, Ryan CW, von Mehren M, Benjamin RS, et al. Phase III randomized, intergroup trial assessing imatinib mesylate at two dose levels in patients with unresectable or metastatic gastrointestinal stromal tumors expressing the kit receptor tyrosine kinase: S0033. J Clin Oncol. 2008; 26:626–32.
14. Larson RA, Druker BJ, Guilhot F, O’Brien SG, Riviere GJ, Krahnke T, et al. Imatinib pharmacokinetics and its correlation with response and safety in chronic-phase chronic myeloid leukemia: a subanalysis of the IRIS study. Blood. 2008; 111:4022–8.
15. Eadie LN, Hughes TP, White DL. Interaction of the efflux transporters ABCB1 and ABCG2 with imatinib, nilotinib, and dasatinib. Clin Pharmacol Ther. 2014; 95:294–306.
16. Burger H, Nooter K. Pharmacokinetic resistance to imatinib mesylate: role of the ABC drug pumps ABCG2 (BCRP) and ABCB1 (MDR1) in the oral bioavailability of imatinib. Cell Cycle. 2004; 3:1502–5.
17. Sharom FJ. ABC multidrug transporters: structure, function and role in chemoresistance. Pharmacogenomics. 2008; 9:105–27.
18. Cho S, Yee J, Kim JY, Jeong Rhie S, Gwak HS. Effects of concomitant medication use on gefitinib-induced hepatotoxicity. J Clin Pharmacol. 2018; 58:263–8.
19. Lodato F, Azzaroli F, Di Girolamo M, Feletti V, Cecinato P, Lisotti A, et al. Proton pump inhibitors in cirrhosis: tradition or evidence based practice? World J Gastroenterol. 2008; 14:2980–5.
20. Hodges LM, Markova SM, Chinn LW, Gow JM, Kroetz DL, Klein TE, et al. Very important pharmacogene summary: ABCB1 (MDR1, P-glycoprotein). Pharmacogenet Genomics. 2011; 21:152–61.
21. Crossman LC, Druker BJ, Deininger MW, Pirmohamed M, Wang L, Clark RE. hOCT 1 and resistance to imatinib. Blood. 2005; 106:1133–4.
22. Thomas J, Wang L, Clark RE, Pirmohamed M. Active transport of imatinib into and out of cells: implications for drug resistance. Blood. 2004; 104:3739–45.
23. Bourdet DL, Pritchard JB, Thakker DR. Differential substrate and inhibitory activities of ranitidine and famotidine toward human organic cation transporter 1 (hOCT1; SLC22A1), hOCT2 (SLC22A2), and hOCT3 (SLC22A3). J Pharmacol Exp Ther. 2005; 315:1288–97.
24. Haouala A, Widmer N, Duchosal MA, Montemurro M, Buclin T, Decosterd LA. Drug interactions with the tyrosine kinase inhibitors imatinib, dasatinib, and nilotinib. Blood. 2011; 117:e75–87.
25. White DL, Saunders VA, Dang P, Engler J, Zannettino AC, Cambareri AC, et al. OCT-1-mediated influx is a key determinant of the intracellular uptake of imatinib but not nilotinib (AMN107): reduced OCT-1 activity is the cause of low in vitro sensitivity to imatinib. Blood. 2006; 108:697–704.
26. Budha NR, Frymoyer A, Smelick GS, Jin JY, Yago MR, Dresser MJ, et al. Drug absorption interactions between oral targeted anticancer agents and PPIs: is pH-dependent solubility the Achilles heel of targeted therapy? Clin Pharmacol Ther. 2012; 92:203–13.
27. Deininger MW, Druker BJ. Specific targeted therapy of chronic myelogenous leukemia with imatinib. Pharmacol Rev. 2003; 55:401–23.
Table 1.
Characteristic | No. (%) (n=177) |
Hepatotoxicity |
p-value | |
---|---|---|---|---|
Presence (n=60) | Absence (n=117) | |||
Age (yr) | ||||
< 60 | 76 (42.9) | 24 (40.0) | 52 (44.4) | 0.572 |
≥ 60 | 101 (57.1) | 36 (60.0) | 65 (55.6) | |
Sex | ||||
Male | 90 (50.8) | 31 (51.7) | 59 (50.4) | 0.876 |
Female | 87 (49.2) | 29 (48.3) | 58 (49.6) | |
Body weight (kg)a) | ||||
< 55 | 72 (43.9) | 33 (56.9) | 39 (36.8) | 0.013 |
≥ 55 | 92 (56.1) | 25 (43.1) | 67 (63.2) | |
BSA (m2)b) | ||||
< 1.6 | 83 (50.9) | 35 (60.3) | 48 (45.7) | 0.074 |
≥ 1.6 | 80 (49.1) | 23 (39.7) | 57 (54.3) | |
CVD or DM | ||||
Yes | 69 (39.0) | 21 (35.0) | 48 (41.0) | 0.437 |
No | 108 (61.0) | 39 (65.0) | 69 (59.0) | |
Liver metastasis | ||||
Yes | 20 (11.3) | 5 (8.3) | 15 (12.8) | 0.372 |
No | 157 (88.7) | 55 (91.7) | 102 (87.2) | |
Presence of liver disease or HBV | ||||
Yes | 11 (6.2) | 7 (11.7) | 4 (3.4) | 0.031 |
No | 166 (93.8) | 53 (88.3) | 113 (96.6) | |
Daily dose (mg) | ||||
≤ 400 | 166 (93.8) | 55 (91.7) | 111 (94.9) | 0.403 |
> 400 | 11 (6.2) | 5 (8.3) | 6 (5.1) | |
CYP3A4 inducer | ||||
Yes | 1 (0.6) | 0 | 1 (0.9) | 0.473 |
No | 176 (99.4) | 60 (100) | 116 (99.1) | |
CYP3A4 inhibitor | ||||
Yes | 4 (2.3) | 1 (1.7) | 3 (2.6) | 0.704 |
No | 173 (97.7) | 59 (98.3) | 114 (97.4) | |
PPI | ||||
Yes | 18 (10.2) | 11 (18.3) | 7 (6.0) | 0.010 |
No | 159 (89.8) | 49 (81.7) | 110 (94.0) | |
H2-antagonist | ||||
Yes | 16 (9.0) | 4 (6.7) | 12 (10.3) | 0.430 |
No | 161 (91.0) | 56 (93.3) | 105 (89.7) | |
H2-antagonist/PPI | ||||
Yes | 32 (18.1) | 13 (21.7) | 19 (16.2) | 0.374 |
No | 145 (81.9) | 47 (78.3) | 98 (83.8) |
Table 2.
Characteristic | Unadjusted OR (95% CI) |
Model Ⅰ |
Model Ⅱ |
||
---|---|---|---|---|---|
Adjusted OR (95% CI) | Attributable risk (%) | Adjusted OR (95% CI) | Attributable risk (%) | ||
Female sex | 0.952 (0.511-1.774) | - | - | - | - |
Age ≥ 60 yr | 1.200 (0.638-2.258) | - | - | - | - |
BSA < 1.6 m2 | 1.808 (0.943-3.460) | 1.981 (0.992-3.953) | 49.52 | - | - |
BW < 55 kg | 2.268 (1.181-4.348)* | - | - | 2.247 (1.134-4.464)* | 55.50 |
Presence of liver disease or HBV | 3.731 (1.047-13.300)* | 8.744 (1.685-45.383)* | 88.56 | 8.292 (1.586-43.363)* | 87.94 |
PPI | 3.528 (1.290-9.644)* | 3.882 (1.318-11.431)* | 74.24 | 3.806 (1.279-11.326)* | 73.73 |
For model Ⅰ construction, sex, age, BSA, presence of liver disease or HBV, and PPI were included for analysis. For model Ⅱ construction, sex, age, BW, presence of liver disease or HBV, and PPI were included for analysis. OR, odds ratio; CI, confidence interval; BSA, body surface area; BW, body weight; HBV, hepatitis B virus; PPI, proton pump inhibitor.
Table 3.
Characteristic | No. (%) (n=100) | Time to hepatotoxicity Median (95% CI, day) | p-value |
---|---|---|---|
Age (yr) | |||
< 60 | 40 (40.0) | 56 (34.307-77.693) | 0.760 |
≥ 60 | 60 (60.0) | 77 (36.537-117.463) | |
Sex | |||
Male | 57 (57.0) | 77 (42.828-111.172) | 0.839 |
Female | 43 (43.0) | 70 (26.408-113.592) | |
BW (kg)a) | |||
< 55 | 45 (47.9) | 49 (17.452-80.548) | 0.283 |
≥ 55 | 49 (52.1) | 83 (40.477-125.523) | |
BSA (m2)b) | |||
< 1.6 | 51 (54.3) | 53 (27.010-78.990) | 0.821 |
≥ 1.6 | 43 (45.7) | 77 (35.883-118.117) | |
CVD or DM | |||
Yes | 34 (34.0) | 70 (31.210-108.790) | 0.405 |
No | 66 (66.0) | 68 (27.197-108.803) | |
Liver metastasis | |||
Yes | 11 (11.0) | 98 (13.842-182.158) | 0.864 |
No | 89 (89.0) | 70 (40.227-99.773) | |
Presence of liver disease or HBV | |||
Yes | 6 (6.0) | 14 (7.999-20.001) | < 0.001 |
No | 94 (94.0) | 77 (40.894-113.106) | |
Daily dose (mg) | |||
≤ 400 | 93 (93.0) | 77 (42.365-111.635) | 0.049 |
> 400 | 7 (7.0) | 42 (0.000-85.626) | |
CYP3A4 inducer | |||
Yes | 0 | N.A | N.A |
No | 100 (100) | 70 (39.715-100.285) | |
CYP3A4 inhibitor | |||
Yes | 4 (4.0) | 105 (0.000-288.260) | 0.762 |
No | 96 (96.0) | 68 (40.154-95.846) | |
PPI | |||
Yes | 12 (12.0) | 24 (0.000-83.409) | 0.193 |
No | 88 (88.0) | 70 (34.899-105.101) | |
H2-antagonist | |||
Yes | 9 (9.0) | 88 (0.000-207.794) | 0.916 |
No | 91 (91.0) | 70 (38.572-101.428) | |
H2-antagonist/PPI | |||
Yes | 19 (19.0) | 88 (25.435-150.565) | 0.677 |
No | 81 (81.0) | 70 (41.599-98.401) |
Table 4.
Characteristic | Unadjusted HR (95% CI) | Adjusted HR (95% CI) |
---|---|---|
Female sex | 0.959 (0.636-1.445) | - |
Age ≥ 60 yr | 0.940 (0.628-1.406) | - |
BSA < 1.6 m2 | 0.953 (0.628-1.447) | - |
Daily dose > 400 mg | 2.136 (0.978-4.664) | 2.252 (1.020-4.974)* |
Presence of liver disease or HBV | 4.937 (2.074-11.749)** | 5.195 (2.151-12.544)** |
PPI | 1.491 (0.811-2.741) | 2.117 (1.109-4.042)* |