Introduction
Materials and Methods
1. Patient inclusion criteria and tissue samples
2. IHC and assessment of TMA
3. Interpretation of IHC expression on TMA
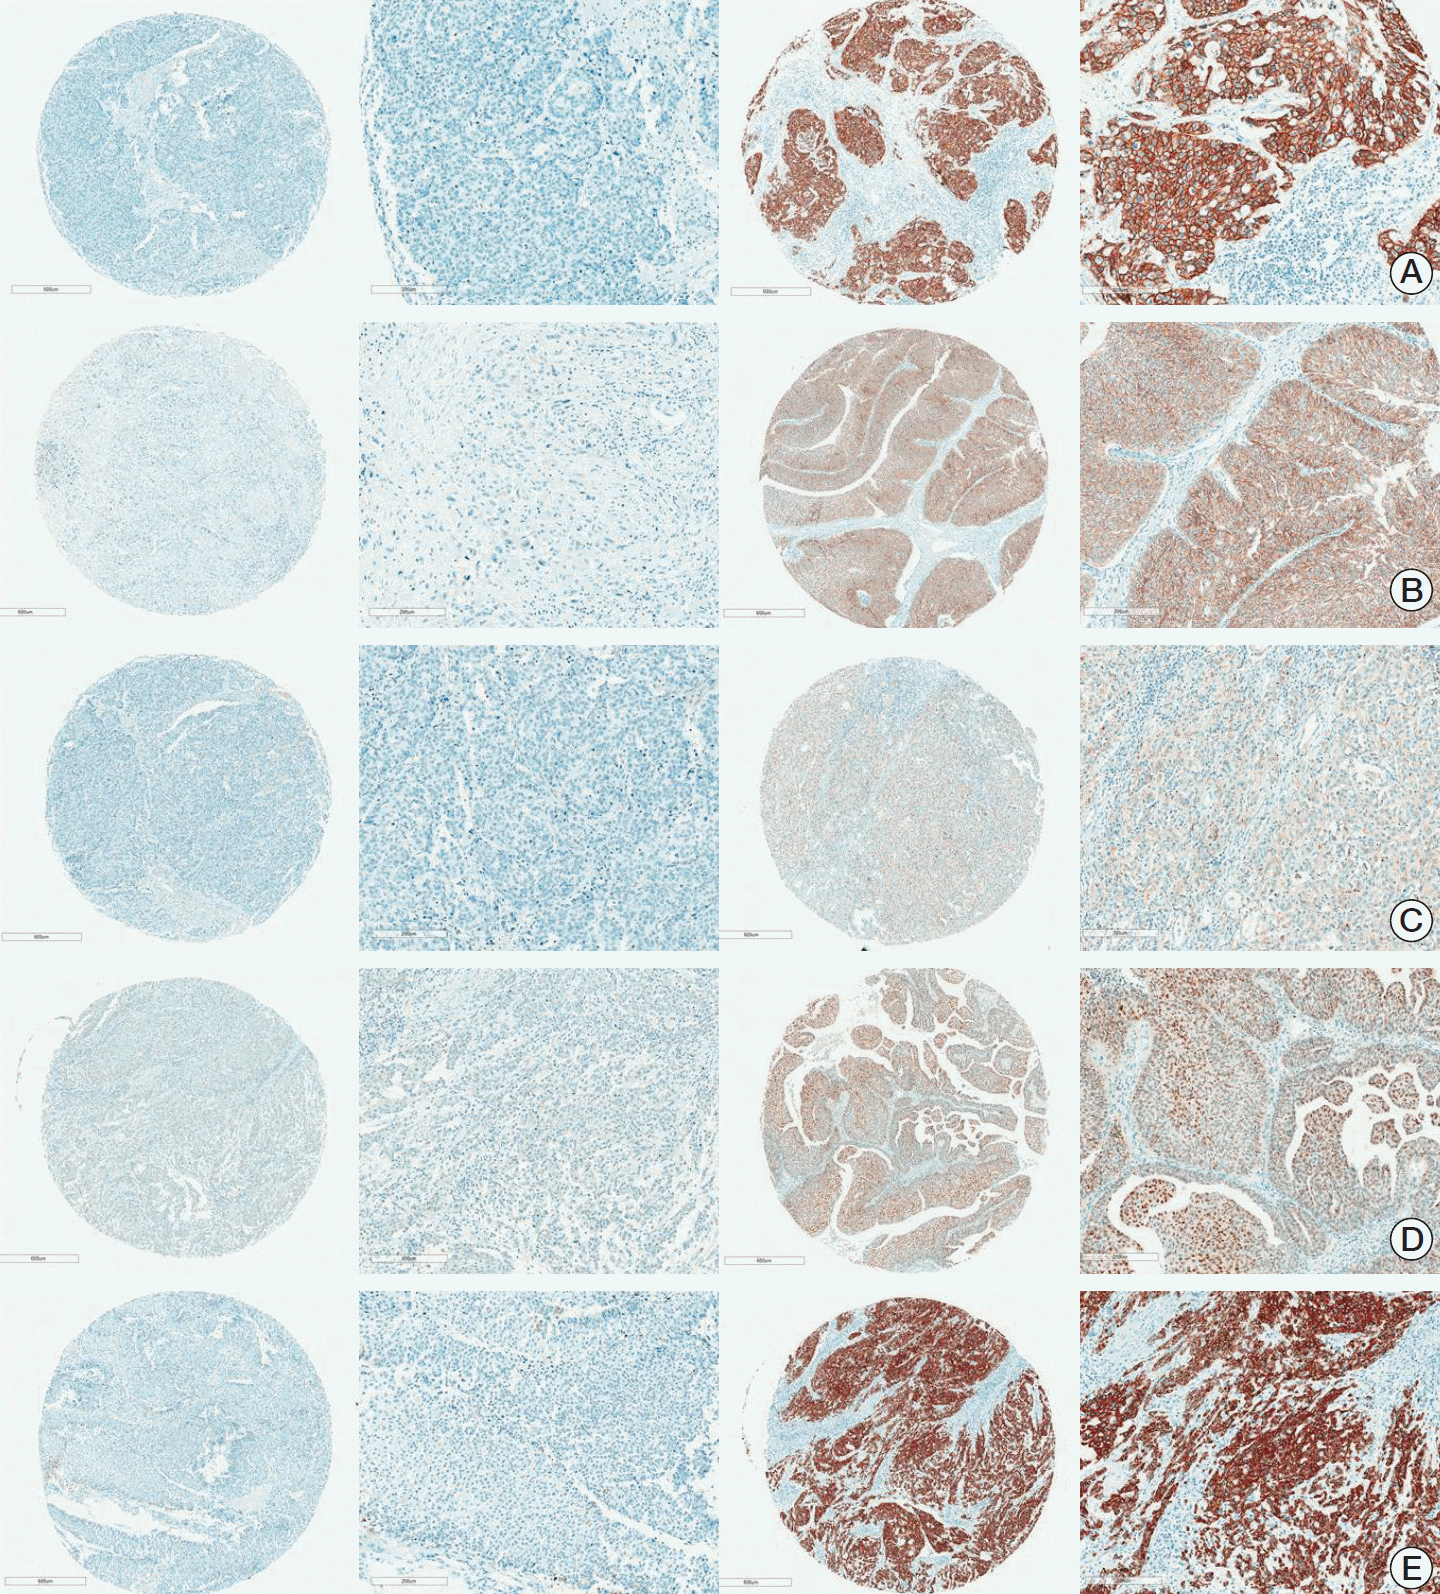
Fig. 1.

4. Statistical analysis
5. Ethical statement
Results
Table 1.
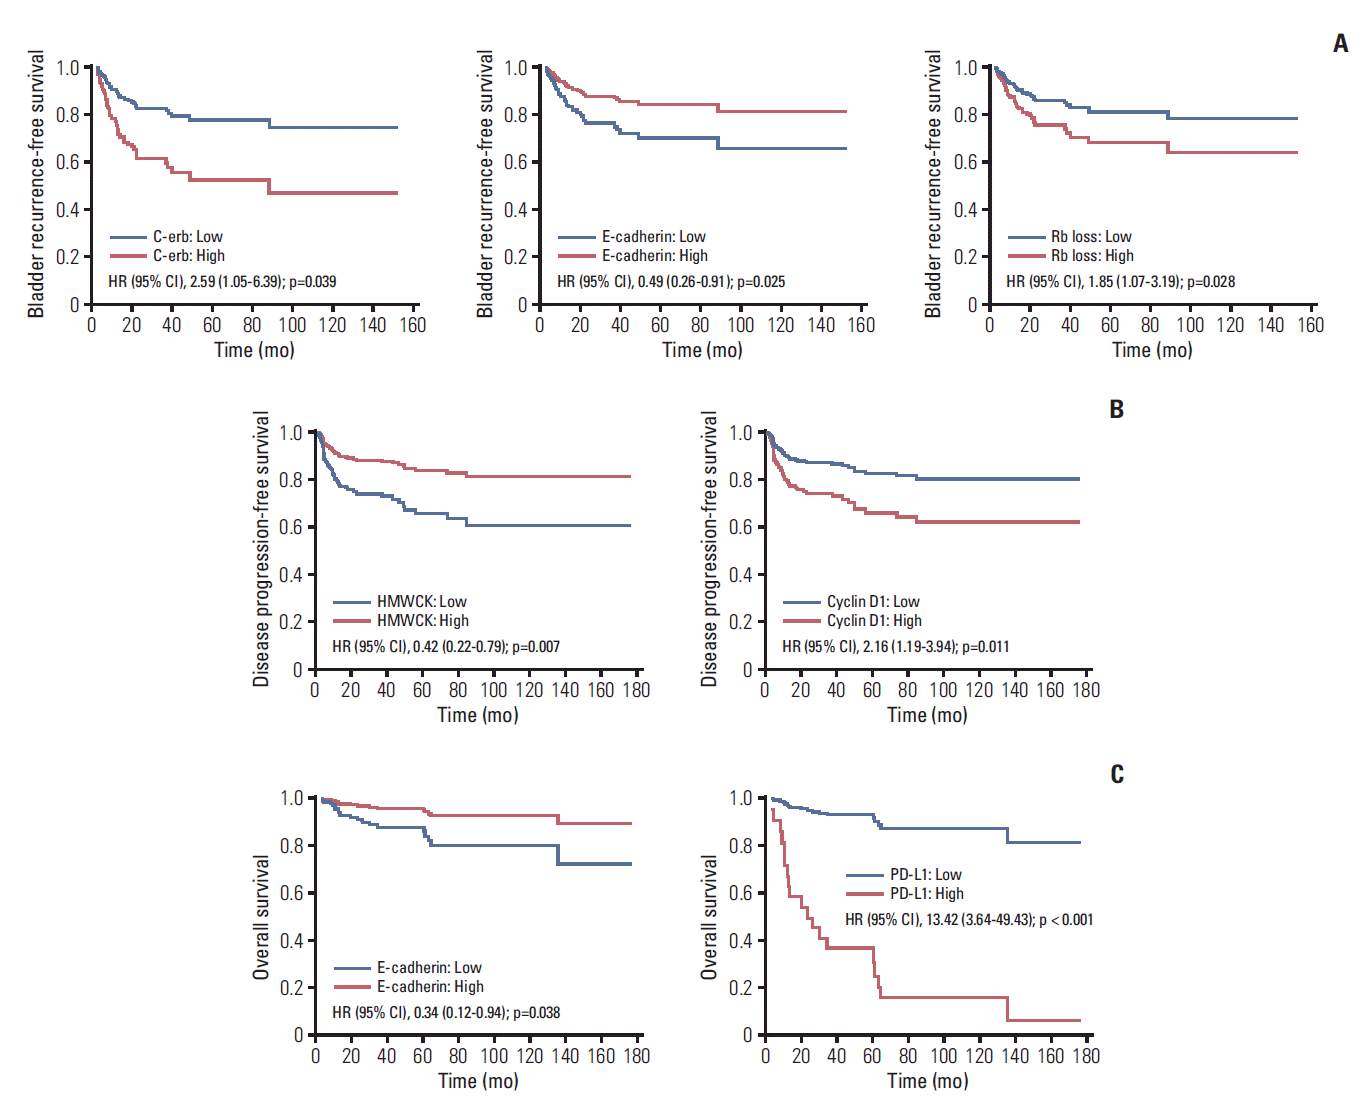
Fig. 2.

Table 2.
| Cut-point | No. (n=162) | Event (%) |
Univariable |
Multivariable |
|||
|---|---|---|---|---|---|---|---|
| HR (95% CI) | p-value | HR (95% CI) | p-value | ||||
| IVRFSa) (n=162, event=58) | |||||||
| C-erb | |||||||
| Low | 0 | 141 | 52 (36.9) | 1 (reference) | 1 (reference) | ||
| High | > 0 | 21 | 6 (28.6) | 0.74 (0.32-1.72) | 0.483 | 2.59 (1.05-6.39) | 0.039 |
| C-myc | |||||||
| Low | ≤ 30 | 82 | 35 (42.7) | 1 (reference) | 1 (reference) | ||
| High | > 30 | 80 | 23 (28.8) | 0.56 (0.33-0.95) | 0.031 | 0.88 (0.52-1.51) | 0.650 |
| E-cadherin | |||||||
| Low | ≤ 270 | 119 | 45 (37.8) | 1 (reference) | 1 (reference) | ||
| High | > 270 | 43 | 13 (30.2) | 0.69 (0.37-1.27) | 0.231 | 0.49 (0.26-0.91) | 0.025 |
| ERCC1 | |||||||
| Low | ≤ 130 | 63 | 31 (49.2) | 1 (reference) | 1 (reference) | ||
| High | > 130 | 99 | 27 (27.3) | 0.5 (0.3-0.83) | 0.008 | 1.06 (0.63-1.8) | 0.818 |
| Rb loss | |||||||
| Low | ≤ 20 | 66 | 22 (33.3) | 1 (reference) | 1 (reference) | ||
| High | > 20 | 96 | 36 (37.5) | 1.21 (0.71-2.06) | 0.478 | 1.85 (1.07-3.19) | 0.028 |
| VEGF | |||||||
| Low | ≤ 170 | 75 | 35 (46.7) | 1 (reference) | 1 (reference) | ||
| High | > 170 | 87 | 23 (26.4) | 0.45 (0.27-0.77) | 0.003 | 0.66 (0.39-1.13) | 0.132 |
| DFSb) (n=162, event=48) | |||||||
| COX2 | |||||||
| Low | < 300 | 110 | 27 (24.6) | 1 (reference) | 1 (reference) | ||
| High | ≥ 300 | 52 | 21 (40.4) | 1.9 (1.08-3.37) | 0.027 | 1.55 (0.87-2.75) | 0.137 |
| Cyclin D1 | |||||||
| Low | ≤ 40 | 81 | 17 (21.0) | 1 (reference) | 1 (reference) | ||
| High | > 40 | 81 | 31 (38.3) | 2.07 (1.15-3.75) | 0.016 | 2.16 (1.19-3.94) | 0.011 |
| HMWCK | |||||||
| Low | ≤ 130 | 88 | 34 (38.6) | 1 (reference) | 1 (reference) | ||
| High | > 130 | 74 | 14 (18.9) | 0.39 (0.21-0.72) | 0.003 | 0.42 (0.22-0.79) | 0.007 |
| PD-L1 | |||||||
| Low | 0 | 157 | 45 (28.7) | 1 (reference) | 1 (reference) | ||
| High | > 0 | 5 | 3 (60.0) | 4.05 (1.25-13.16) | 0.020 | 2.26 (0.69-7.37) | 0.178 |
| OSc) (n=162, event=19) | |||||||
| E-cadherin | |||||||
| Low | < 150 | 85 | 14 (16.5) | 1 (reference) | 1 (reference) | ||
| High | > 150 | 77 | 5 (6.5) | 0.37 (0.13-1.02) | 0.055 | 0.34 (0.12-0.94) | 0.038 |
| PD-L1 | |||||||
| Low | 0 | 157 | 16 (10.2) | 1 (reference) | 1 (reference) | ||
| High | > 0 | 5 | 3 (60.0) | 17.2 (4.68-63.18) | < 0.001 | 13.42 (3.64-49.43) | < 0.001 |
IVRFS, intravescial recurrence-free survival; DFS, disease-free survival; OS, overall survival; HR, hazard ratio; CI, confidence interval; ERCC1, ERCC excision repair 1; Rb, retinoblastoma; VEGF, vascular endothelial growth factor; COX2, cytochrome coxidase II; HMWCK, high-molecular-weight heparin; PD-L1, programmed cell death 1 ligand.
Table 3.
| Cut-point | No. (n=111) | Event (%) |
Univariable |
Multivariable |
|||
|---|---|---|---|---|---|---|---|
| HR (95% CI) | p-value | HR (95% CI) | p-value | ||||
| BRFSa) (n=111, event=36) | |||||||
| C-erb | |||||||
| Low | 0 | 95 | 30 (31.6) | 1 (reference) | 1 (reference) | ||
| High | > 0 | 16 | 6 (37.5) | 1.24 (0.52-2.99) | 0.629 | 2.55 (1.01-6.41) | 0.047 |
| C-myc | |||||||
| Low | ≤ 30 | 58 | 23 (39.7) | 1 (reference) | 1 (reference) | ||
| High | > 30 | 53 | 13 (24.5) | 0.54 (0.27-1.06) | 0.072 | 1.02 (0.50-2.05) | 0.964 |
| E-cadherin | |||||||
| Low | ≤ 270 | 84 | 27 (32.1) | 1 (reference) | 1 (reference) | ||
| High | > 270 | 27 | 9 (33.3) | 1.07 (0.50-2.27) | 0.867 | 1.28 (0.60-2.76) | 0.522 |
| ERCC1 | |||||||
| Low | ≤ 130 | 42 | 17 (40.5) | 1 (reference) | 1 (reference) | ||
| High | > 130 | 69 | 19 (27.5) | 0.61 (0.32-1.17) | 0.138 | 1.23 (0.62-2.42) | 0.554 |
| Rb | |||||||
| Low | ≤ 20 | 43 | 12 (27.9) | 1 (reference) | 1 (reference) | ||
| High | > 20 | 68 | 24 (35.3) | 1.37 (0.68-2.75) | 0.375 | 1.74 (0.85-3.54) | 0.129 |
| VEGF | |||||||
| Low | ≤ 170 | 47 | 19 (40.4) | 1 (reference) | 1 (reference) | ||
| High | > 170 | 64 | 17 (26.6) | 0.57 (0.30-1.11) | 0.097 | 0.97 (0.50-1.89) | 0.925 |
| DPFSb) (n=111, event=34) | |||||||
| COX2 | |||||||
| Low | < 300 | 71 | 18 (25.4) | 1 (reference) | 1 (reference) | ||
| High | 300 | 40 | 16 (40.0) | 1.85 (0.94-3.63) | 0.074 | 1.53 (0.77-3.01) | 0.223 |
| Cyclin D1 | |||||||
| Low | ≤ 40 | 53 | 12 (22.6) | 1 (reference) | 1 (reference) | ||
| High | > 40 | 58 | 22 (37.9) | 2.04 (1.01-4.14) | 0.048 | 2.33 (1.14-4.75) | 0.020 |
| HMWCK | |||||||
| Low | ≤ 130 | 59 | 22 (37.3) | 1 (reference) | 1 (reference) | ||
| High | > 130 | 52 | 12 (23.1) | 0.50 (0.25-1.02) | 0.057 | 0.48 (0.24-0.99) | 0.047 |
| PD-L1 | |||||||
| Low | 0 | 106 | 31 (29.3) | 1 (reference) | 1 (reference) | ||
| High | > 0 | 5 | 3 (60.0) | 4.05 (1.22-13.48) | 0.023 | 2.32 (0.69-7.74) | 0.173 |
| OSc) (n=111, event=17) | |||||||
| E-cadherin | |||||||
| Low | ≤ 150 | 57 | 12 (21.1) | 1 (reference) | 1 (reference) | ||
| High | > 150 | 54 | 5 (9.3) | 0.41 (0.14-1.15) | 0.090 | 0.35 (0.12-0.99) | 0.048 |
| PD-L1 | |||||||
| Low | 0 | 106 | 14 (13.2) | 1 (reference) | 1 (reference) | ||
| High | > 0 | 5 | 3 (60.0) | 13.82 (3.64-52.49) | < 0.001 | 10.8 (2.83-41.25) | 0.001 |
BRFS, bladder recurrence-free survival; DPFS, disease progression-free survival; OS, overall survival; HR, hazard ratio; CI, confidence interval; C-erb, epidermal growth factor receptor; ERCC1, ERCC excision repair 1; Rb, retinoblastoma; VEGF, vascular endothelial growth factor; COX2, cytochrome c oxidase II; HMWCK, high-molecular-weight heparin; PD-L1, programmed cell death 1 ligand.


 PDF
PDF Citation
 Print
Print


 XML Download